

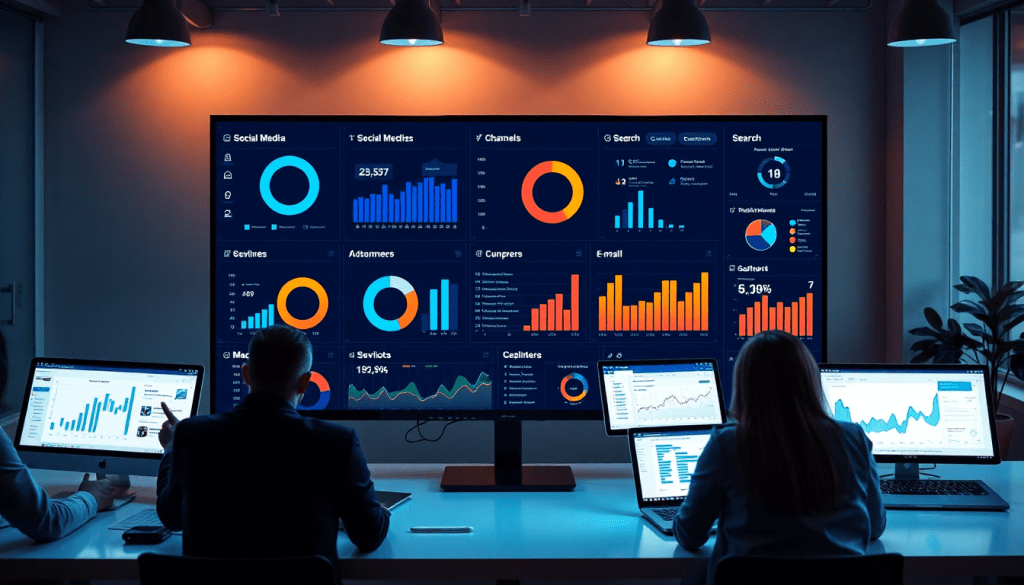
Multi-Channel Analytics Dashboard: Unified Marketing Insights
Modern marketing rarely happens on just one channel. For agencies, brands, and enterprise teams, the real challenge is bringing all your data together—ads, social, search, display, email, and more—into a single, actionable view. That's where a multi-channel analytics dashboard comes in. By unifying marketing data, automating reporting, and surfacing insights across every platform, solutions like TapClicks make it possible to see the whole story of your campaigns, compare performance, and optimize your strategy with confidence.
What is a Multi-Channel Analytics Dashboard?
A multi-channel analytics dashboard is a centralized platform that aggregates and visualizes marketing data from a wide array of sources—think paid search, social media, display ads, email campaigns, and beyond—into a single, cohesive view. Its core purpose is to break down data silos and provide marketing teams with a unified reporting environment where performance across every channel can be monitored, compared, and optimized in real time.
Instead of toggling between multiple native platforms or exporting endless spreadsheets, marketers use a multi-channel dashboard to see cross-channel metrics in context. This unified approach enables stakeholders to spot trends, track ROI, and make informed, strategic decisions without the manual legwork of blending disparate data. For agencies managing dozens or hundreds of clients, or for brands running omnichannel campaigns, this means every team member can access the same up-to-date insights—whether they’re focused on high-level KPIs or granular, channel-specific details.
The true power of a multi-channel analytics dashboard lies in its ability to enable cross-channel marketing analytics. By aggregating and normalizing data across platforms, these dashboards help marketers understand not just how each channel is performing individually, but how they work together to drive overall business results. This holistic view is essential for optimizing budget allocation, identifying the best-performing tactics, and ultimately improving marketing ROI.
Modern solutions like TapClicks take this a step further by automating data integration, reporting, and analysis—ensuring that your dashboard becomes a dynamic, actionable hub for marketing intelligence rather than a static collection of charts. In today’s multi-platform world, a unified analytics dashboard isn’t just a convenience—it’s a necessity for data-driven marketing success.
Why Unified Analytics Matter for Modern Marketing
Today’s marketing teams are asked to do more than ever—often across a dizzying array of channels and platforms. Without the right approach to analytics, campaign performance can quickly become a guessing game.
The Challenge: Fragmented Data Everywhere
-
Multiple Channels, Multiple Metrics:
Google Ads, Facebook, Instagram, programmatic display, email, SMS… each generates its own unique data and reporting formats. -
Manual Spreadsheets:
Teams are often stuck copying and pasting data just to create a basic performance snapshot. -
The Risks:
- Wasted time on manual reporting
- Increased risk of errors and inconsistencies
- Missed cross-channel insights and optimization opportunities
What Gets Lost in the Shuffle?
When data lives in silos:
- It’s nearly impossible to see how campaigns influence each other.
- Identifying top-performing channels or underperformers is slow and unreliable.
- Budget allocation becomes guesswork.
- Optimization is reactive, not proactive.
The Game-Changer: Unified Analytics
Bringing all your marketing metrics together in a single platform delivers:
-
Holistic Visibility:
Instantly see what’s working (and what’s not) across every channel. -
Cross-Channel Insights:
Spot trends, attribution paths, and synergies you’d otherwise miss. -
Smarter Budgeting:
Shift spend quickly to maximize ROI—no more flying blind. -
More Time for Strategy:
Let automation do the heavy lifting so your team can focus on creative and strategic work.
| Pain Point | Before Unified Analytics | After (with TapClicks) |
|---|---|---|
| Data Consolidation | Manual, error-prone, slow | Automated, real-time, accurate |
| Channel Visibility | Siloed, incomplete | Holistic, cross-channel views |
| Reporting | Reactive, time-consuming | Proactive, automated, insightful |
| Budget Allocation | Guesswork | Data-driven, optimized |
How TapClicks Solves the Puzzle
TapClicks is designed to bring order to the chaos:
-
Data Integration:
Connects to 10,000+ marketing, ad, and business platforms. -
Automated Reporting:
Consolidates and visualizes omnichannel data—no more spreadsheets. -
Actionable Insights:
Surfaces trends, opportunities, and optimization paths with AI. -
Single Source of Truth:
Everyone—from analysts to executives—works off the same data.
Want to see automated dashboards in action?
Check out "Marketing Dashboard Automation: Boost Agency Reporting Efficiency".
With unified analytics, marketers shift from chasing data to driving results—turning complexity into clarity, and insights into action.
What Makes a Multi-Channel Analytics Dashboard Truly Powerful?
A truly effective multi-channel analytics dashboard isn’t just a visualizer for your numbers—it’s the strategic HQ for your entire marketing operation. Here’s what sets the best platforms apart:
See Campaign Performance at a Glance
- Intuitive Visualization: Interactive charts and graphs for every channel—search, social, email, display, and more.
- Custom Comparison: Instantly compare KPIs across channels or drill into specific campaigns.
- Pattern Recognition: Spot trends and anomalies quickly for faster optimization.
Track ROI Across Every Effort
- Unified View: Combine spend, conversions, and revenue in one dashboard.
- Automatic Calculations: Instantly see return on investment for any campaign or channel.
- Budget Justification: Data-driven insights to support smarter budget allocation.
Let AI Do the Heavy Lifting
- Automated Insights: AI surfaces trends, outliers, and opportunities—no more manual number crunching.
- Real-Time Alerts: Get notified of performance shifts as they happen, not weeks later.
- Actionable Recommendations: Built-in suggestions help analysts and stakeholders take the next step, fast.
Make It Your Own
- Customizable Dashboards: Tailor dashboards by client, channel, region, or business unit.
- Audience-Specific Views: Create executive summaries or deep-dive reports—whatever your team needs.
- Flexible Workflows: Adapt dashboards to fit existing processes and reporting structures.
Automate Reporting, Save Hours
- Live Data Connections: Pulls metrics directly from your marketing platforms—no manual exports required.
- Scheduled Reports: Automatically deliver the latest insights to your team’s inboxes.
- Time Savings: Eliminate reporting bottlenecks and free up analysts for higher-value work.
Connect Every Platform
| Integration Must-Haves | Why It Matters |
|---|---|
| Connects to all major ad/marketing tools | Ensures a single source of truth |
| Compatible with BI & CRM systems | Streamlines enterprise workflows |
| Flexible API and data pipes | Supports your evolving tech stack |
TapClicks brings all of these features together in one unified platform—built for scale, automation, and actionable insights. By centralizing data, delivering real-time AI-powered recommendations, and supporting customizable reporting workflows, TapClicks empowers marketing leaders to drive growth and maximize ROI, campaign after campaign.
How TapClicks Unifies Data and Reporting
At the heart of TapClicks’ multi-channel analytics dashboard is a robust approach to data integration that simplifies the most complex marketing environments. TapClicks offers direct connections to over 10,000 data sources—including ad platforms, CRMs, social networks, email tools, and more—via its TapData and Smart Connectors. This expansive connector library enables agencies and brands to pull in virtually any marketing, advertising, or business dataset they need, no matter how many clients, channels, or locations they manage.
Once connected, TapClicks’ automated ETL/ELT pipeline seamlessly extracts, transforms, and loads your data—either into the TapClicks platform or to an external destination if you prefer. This means data is not only centralized but also continuously cleaned, normalized, and enriched, empowering you to blend cross-channel metrics or compare multi-location performance without tedious manual work.
Unified reporting workflows are a cornerstone of the TapClicks experience. Agencies can create and schedule branded dashboards for hundreds of clients at once, while brands and enterprise teams can consolidate all campaign data into a single, role-based view. Automated report generation and delivery ensure that stakeholders—from sales to fulfillment—always have the latest insights without waiting on analysts for manual updates.
Most importantly, TapClicks automates cross-channel reporting and analytics across every integrated source. This eliminates the need to juggle spreadsheets or patch together point solutions, providing a single source of truth for all your marketing efforts. With customizable dashboards, drag-and-drop visualization tools, and intelligent report scheduling, TapClicks transforms unified marketing analytics from a time-consuming chore into a streamlined, scalable process.
To see how TapClicks makes unified analytics effortless, explore "Marketing Dashboard Automation: Boost Analytics Reporting" or visit the TapClicks website for more details.
Visualizing and Tracking Campaign Performance
A multi-channel analytics dashboard isn’t just about consolidating data—it’s about unlocking clear, actionable visibility into your marketing performance. With a unified dashboard like TapClicks, campaign performance visualization becomes intuitive, bringing every advertising channel, audience segment, and conversion metric together in one place. By centralizing these insights, marketers can quickly assess which campaigns, creatives, or tactics are driving the highest ROI across search, social, display, email, and beyond.
Real-time and historical data trends are essential for truly informed marketing intelligence reporting. TapClicks dashboards let you monitor performance as it happens, while also offering the ability to analyze long-term trends, compare periods, and spot emerging opportunities or risks. Whether you’re tracking a single campaign’s daily clicks or evaluating year-over-year growth across dozens of channels, these visualizations provide the context needed for smarter decisions.
Custom views are another critical advantage—especially for multi-location, multi-client, or multi-brand organizations. With TapClicks, agencies and enterprise teams can create tailored dashboards for each client, region, or product line, ensuring stakeholders see only the data relevant to them. This flexibility not only streamlines reporting but also enhances collaboration, making it easier for every team member or client to focus on what matters most.
By providing a comprehensive, customizable view of campaign performance and ROI, multi-channel analytics dashboards transform raw marketing data into true business intelligence. To see how TapClicks brings this level of transparency and actionable insight to your analytics, learn more at TapClicks.
Automated Insights: Turning Data into Action
Sifting through endless marketing data can overwhelm even the most seasoned analysts, especially when campaigns run across dozens of platforms. That’s why AI-powered automated insights have become a game-changer in multi-channel analytics dashboards. By leveraging artificial intelligence and machine learning, these smart dashboards don’t just aggregate data—they interpret it, surfacing actionable recommendations and optimization opportunities right where you need them.
TapClicks, for example, uses AI agents like SmartPilot to analyze campaign performance in real time, flagging anomalies, pacing issues, and underperforming channels. Instead of waiting for a manual report or sifting through raw numbers, marketing teams receive proactive alerts—like when a campaign exceeds budget, an ad set underdelivers, or a new trend emerges in audience engagement. Features such as SmartEmail take this a step further by delivering automated, AI-curated summaries and insights directly to stakeholders’ inboxes, ensuring everyone has timely, relevant information to drive quick, confident decisions.
Automation doesn’t just make reporting smarter; it frees up analysts to focus on strategy rather than routine data wrangling. With TapClicks, agencies and brands often reduce routine reporting time by 50+ hours per month per analyst, giving teams more bandwidth to optimize campaigns and experiment with new tactics. Automated insights also help teams react faster to market changes, allocate budget more efficiently, and drive better ROI across every channel.
For a deeper dive into how AI-driven automation is revolutionizing analytics reporting, check out "Marketing Dashboard Automation: Smarter Analytics Reporting". With the right automated insights, your dashboard becomes more than a reporting tool—it transforms into a strategic partner, turning marketing data into meaningful action.
Choosing the Right Omnichannel Analytics Solution
With a growing number of platforms promising unified analytics, selecting the best multi-channel dashboard for your organization comes down to a few essential criteria:
1. Scalability
Look for a solution that can seamlessly handle your current campaign volume—and grow with you. Whether you manage a handful of accounts or thousands of clients, your dashboard should support high-volume data ingestion, complex reporting needs, and granular user permissions without sacrificing speed or reliability.
2. Integrations
A powerful analytics stack must connect to every source that matters to you. Evaluate the breadth and depth of native connectors: Does the platform offer connections to all your ad networks, social platforms, analytics tools, and CRM systems? TapClicks, for example, stands out with 10,000+ marketing, advertising, and business data connectors, plus the ability to build custom integrations for niche or proprietary sources.
3. Ease of Use
The best dashboards empower marketers—not just data analysts. Prioritize solutions with intuitive, drag-and-drop interfaces, customizable dashboards, and flexible reporting templates. This ensures every stakeholder, from executives to campaign managers, can access the insights they need—without relying on IT or BI teams.
4. Automation and AI-Powered Insights
Manual reporting is a productivity killer. Choose a platform that automates data pulls, report scheduling, and insight generation. Advanced solutions like TapClicks leverage AI agents to automatically surface optimization opportunities, flag anomalies, and even send proactive SmartEmail summaries to stakeholders. This allows your team to spend more time acting on insights rather than compiling them.
TapClicks vs. Other Platforms
While many solutions—like Funnel.io, Agency Analytics, and Supermetrics—offer strong data aggregation, they often lack unified workflow automation, deep AI-driven insights, or scalable reporting for large teams. TapClicks differentiates itself by combining robust data integration, actionable analytics, and end-to-end workflow automation in one platform. This holistic approach enables true omnichannel marketing intelligence, supporting both day-to-day management and long-term strategy.
Ultimately, the right multi-channel analytics dashboard should unify your data, automate the reporting process, and empower smarter, faster decision-making across your organization. For marketing teams seeking a comprehensive, scalable, and AI-driven solution, TapClicks delivers an integrated reporting stack purpose-built for the demands of modern marketing.
Conclusion and Next Steps
In today’s fragmented marketing landscape, a unified analytics dashboard isn’t just a nice-to-have—it’s a critical driver of efficiency, clarity, and growth. By bringing all your channel data into one actionable platform, you eliminate silos, automate time-consuming reporting, and unlock deeper insights that drive smarter decisions and better campaign results. The value goes beyond just data visualization: it’s about empowering your team to focus on strategy, maximize ROI, and respond quickly to market changes.
Ready to see the impact for yourself? Discover how TapClicks can streamline your marketing operations, unify your data, and supercharge your reporting. Request a personalized demo or start a trial to experience the full power of multi-channel analytics. Whether you’re an agency, brand, or enterprise team, the TapClicks experts are ready to help tailor a solution that fits your unique needs—so you can focus on what matters most: driving marketing success.
Start Automating Your Marketing Data Today!
No Credit Card Required.

