

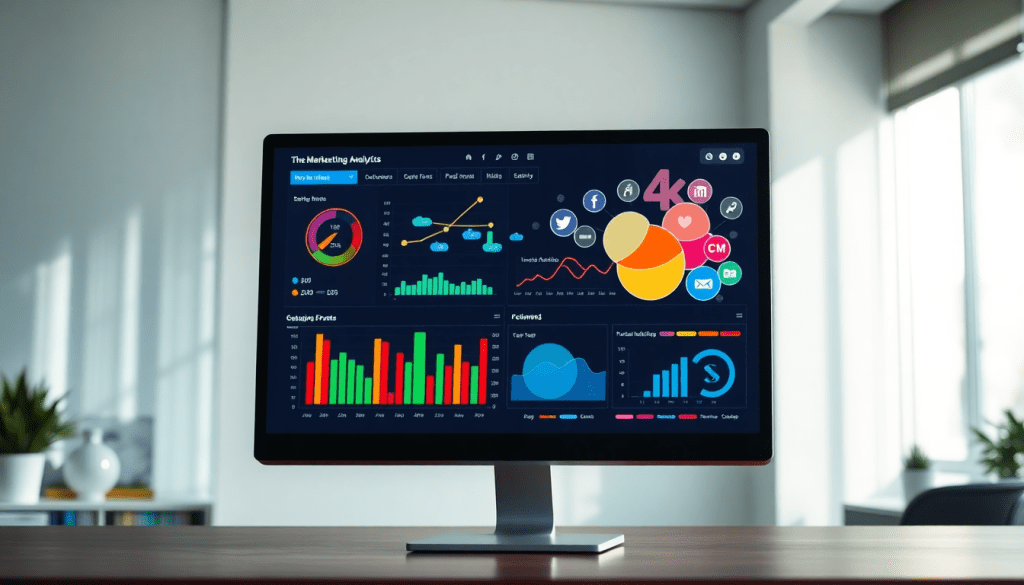
Multi-Channel Analytics Dashboard: Unify Your Marketing Data
A multi-channel analytics dashboard is more than just a reporting tool—it’s the nerve center for marketers aiming to make sense of complex data across campaigns, channels, and platforms. With TapClicks, you gain an integrated view of your marketing universe, allowing you to analyze performance, visualize ROI, and uncover insights automatically. This guide will walk you through what makes a unified reporting platform indispensable, how it simplifies data aggregation, and which features help you unlock true marketing intelligence.
What Is a Multi-Channel Analytics Dashboard?
A multi-channel analytics dashboard is a centralized platform that brings together marketing data from multiple sources—think Google Ads, Facebook, programmatic display, email platforms, CRMs, and beyond—into a single, unified view. Unlike single-channel dashboards that only report on one platform at a time, a multi-channel analytics dashboard provides marketers with a comprehensive perspective across the entire digital ecosystem. This unified approach is essential in today’s complex marketing landscape, where customers interact with brands through numerous channels and touchpoints.
The key advantage of a multi-channel dashboard is its ability to aggregate and harmonize data from disparate sources. With this, marketers can track integrated marketing metrics, such as total spend, impressions, conversions, and ROI, across all campaigns—regardless of where those campaigns run. Instead of toggling between separate tools or manually merging spreadsheets, teams can visualize campaign performance holistically, spot trends, and make data-driven decisions faster.
These dashboards typically include a range of core capabilities:
- Marketing data aggregation: Seamlessly collect and blend data from every channel you use.
- Integrated marketing metrics: View KPIs side-by-side, no matter the source.
- Campaign performance visualization: Use charts, graphs, and tables to monitor results in real time.
- ROI tracking dashboards: Calculate and display return on investment across all activities for stakeholders at every level.
For teams seeking to go beyond static reports and create a living, breathing command center for marketing operations, the right dashboard is crucial. To see how automation and AI can take this even further, explore this guide to automated KPI reporting and discover how platforms like TapClicks transform raw data into actionable insights.
Why Unified Reporting Matters for Marketers
Today’s marketers face a constant battle: data sprawled across disconnected tools, platforms, and channels. Each system—whether it’s search, social, programmatic, or CRM—generates its own reports, metrics, and dashboards. This fragmentation leads to siloed insights, time-consuming manual aggregation, and the risk of critical blind spots. When data isn’t unified, it’s easy to miss trends, duplicate spend, or make decisions based on incomplete information.
A unified reporting platform transforms this chaos into clarity. By centralizing data from every source into a single, always-up-to-date view, marketers gain the ability to spot trends, compare performance across channels, and measure true ROI—all in real time. This cohesion enables smarter, faster decisions: campaign optimizations, budget reallocations, and strategy pivots grounded in holistic, trustworthy data.
The value of multi-platform reporting software is especially pronounced for agencies managing dozens (or hundreds) of clients, for brands overseeing campaigns across regions, and for enterprises needing to break down departmental barriers. With all data, dashboards, and insights consolidated, teams save hours each week, eliminate reporting errors, and can focus their energy on driving results—not wrangling spreadsheets.
Beyond efficiency, unified reporting unlocks deeper strategic benefits. Marketers can benchmark performance, automate KPI tracking, and deliver actionable insights to stakeholders without delay. As highlighted in this discussion of real-time data collection benefits, instant data access means marketers can react to opportunities and risks as they happen—not days or weeks later.
Ultimately, unified reporting isn’t just a convenience; it’s a competitive advantage. It empowers marketers to move from reactive reporting to proactive optimization, driving better outcomes for clients, brands, and the business as a whole.
How TapClicks Powers Omnichannel Analytics
TapClicks stands out as a true omnichannel analytics solution, bringing together all your marketing data—no matter how many sources, clients, or channels you manage—into a single, intuitive analytics dashboard. Unlike point solutions that only aggregate data or provide static reports, TapClicks delivers a fully integrated platform purpose-built for comprehensive, cross-channel visibility and automated marketing insights.
At the heart of TapClicks’ power is its vast data connectivity. With over 10,000 pre-built connectors, TapClicks automates marketing data aggregation across paid, owned, earned, and offline channels—everything from Google Ads and Facebook to programmatic, OTT, CRM, and call tracking platforms. The platform’s Smart Connectors and ETL/ELT pipeline ensure that all your data is not only collected, but also blended, normalized, and made analysis-ready in real time. This eliminates manual downloads, spreadsheet wrangling, and the risk of data silos, so you can focus on interpreting results, not wrangling files.
But omnichannel analytics isn’t just about data collection. TapClicks empowers agencies, media companies, and enterprise marketing teams to streamline operations end-to-end. Role-based access allows you to control who sees which dashboards—perfect for client-facing reporting or distributed brand teams. Centralized order management and workflow automation tools enable seamless collaboration across sales, ops, and fulfillment, so campaign launches, optimizations, and approvals are all tracked in one place.
The result? A tapclicks analytics dashboard that’s not just a visualization layer, but a dynamic command center for marketing intelligence. With TapClicks, you get automated, always-on insights that surface trends, flag anomalies, and empower you to make smarter, faster decisions. Whether you need to monitor hundreds of campaigns across dozens of platforms or simply want a unified view of your marketing performance, TapClicks delivers the scale, flexibility, and actionable intelligence modern marketers demand. Explore more about how TapClicks can transform your analytics approach at TapClicks.com.
Visualizing Campaign Performance and ROI
The true power of a multi-channel analytics dashboard lies in its ability to transform raw marketing data into clear, actionable visualizations. With TapClicks, marketers can tap into a diverse suite of dashboard visualizations designed for every stage of the campaign lifecycle—from high-level performance summaries to granular ROI tracking.
Common visualizations include interactive campaign performance charts that display key metrics like impressions, clicks, conversions, and spend across all channels. Budget pacing dashboards help teams ensure that marketing spend aligns with planned allocations, spotlighting under- or overspending trends before they impact results. Performance tracking dashboards aggregate real-time data, making it easy to compare campaign outcomes by channel, creative, or audience segment.
To maximize the value of these insights, it’s best practice to tailor visualizations to your audience: give executives concise ROI tracking dashboards with clear profit and cost metrics, while providing analysts with deeper, channel-level breakdowns for optimization. Ensure dashboards are refreshed automatically—ideally daily or hourly—to enable fast, confident decisions.
Unified dashboards, like those offered by TapClicks, not only streamline marketing intelligence reporting but also make it easier to spot both high-performing campaigns and areas needing attention. By integrating all campaign data in one place, these dashboards reveal cross-channel patterns and attribution paths that would otherwise go unnoticed. This holistic perspective empowers teams to double down on what works and pivot quickly when needed—turning data into a true competitive advantage.
For more best practices on building automated KPI reporting into your dashboard strategy, check out this guide on automated KPI reporting with TapClicks. And to see how TapClicks can help you visualize every facet of your marketing performance, visit TapClicks.
Automated Insights: Turning Data Into Action
The true power of a multi-channel analytics dashboard lies not just in aggregating marketing data, but in surfacing the insights that drive smarter decisions—automatically. TapClicks stands apart with its suite of AI-powered features designed to turn raw data into actionable intelligence, without requiring hours of manual analysis.
At the heart of TapClicks’ advantage is TapInsights, an AI-driven engine that continuously monitors your dashboards and datasets, proactively surfacing trends, anomalies, and opportunities. Instead of sifting through endless charts, marketers receive clear, prioritized insights—such as underperforming campaigns, sudden cost spikes, or channels exceeding expectations. These automated marketing insights empower teams to quickly identify what’s working, what needs attention, and where budget or creative adjustments could have the biggest impact.
Predictive analytics further amplify the value of TapClicks. SmartPilot, for example, uses historical and real-time data to generate optimization recommendations, forecast budget pacing, and benchmark performance against industry standards. This means marketers can confidently allocate spend, set more accurate goals, and avoid costly surprises.
A major differentiator is TapClicks’ SmartEmail feature. Imagine receiving a curated summary of your most important campaign insights, delivered automatically to your inbox or your client’s inbox—no logging in required. SmartEmail ensures stakeholders and clients stay informed with timely, easy-to-digest updates, improving communication and accelerating decision-making.
Customizable AI agents are another innovation that sets TapClicks apart. These agents can be tailored to monitor specific KPIs, alert teams to critical changes, or even suggest optimization actions—freeing up analysts to focus on strategy rather than data wrangling.
By combining these automated insight tools, TapClicks transforms multi-channel analytics dashboards from passive reporting systems into intelligent marketing copilots. The result: faster, more informed decisions, optimized campaign performance, and a clear competitive edge.
To learn more about how TapClicks’ AI-powered analytics can drive your marketing forward, visit https://www.tapclicks.com/.
Making Cross-Channel Data Work for You
Modern marketing isn’t just about collecting data—it’s about connecting the dots across dozens of channels, platforms, and sources. With every tool generating its own unique data set and format, marketers face a real challenge: How do you bring it all together for a single, actionable view?
Why Data Integration Is So Challenging
Here’s what marketers are up against:
- Too Many Sources: Google Ads, Facebook, email platforms, CRM tools, eCommerce…the list keeps growing.
- Incompatible Formats: Each source exports data differently (think CSVs, APIs, dashboards, etc.).
- Manual Overload: Stitching together reports by hand is time-consuming and error-prone.
How TapClicks Simplifies Data Aggregation
TapClicks is built to take the pain out of marketing analytics. Here’s how:
10,000+ Pre-Built Connectors:
- Instantly connect to major advertising, social, analytics, and business platforms.
- No more custom coding or IT tickets for every new data source.
Automated ETL/ELT Pipeline:
- Extract: Pull raw data from each channel.
- Transform: Normalize and blend metrics, dates, and dimensions.
- Load: Populate your dashboards or data warehouse automatically.
Smart Connectors & Enrichment Tools:
- Map fields and join datasets without writing code.
- Handle cross-channel, multi-location, or multi-client complexities with ease.
- Designed for marketers—not just IT pros.
The Power of Unified Dashboards
With TapClicks, you get:
- Centralized campaign visualization: See all your data in one place.
- Effortless performance monitoring: Track trends, spot opportunities, and drill down by channel or client.
- Seamless multi-touch attribution: Align metrics for true cross-channel analysis.
| TapClicks Feature | What It Delivers |
|---|---|
| Pre-built Connectors | 10,000+ integrations, updated automatically |
| Automated ETL/ELT | Real-time data extraction and normalization |
| Smart Connectors | No-code field mapping and blending |
| BI Tool Integrations | Easily push data into Tableau, Power BI, Looker |
Built for Flexibility
Whether you want TapClicks to be your all-in-one analytics engine, or just the “data refinery” for your existing BI stack, you’re covered:
- Plug directly into Tableau, Power BI, Looker, or your data warehouse
- Scale up or down as your needs change
- Stay in control of your unified marketing data
Focus on Insights, Not Integration
By removing the friction from data aggregation, TapClicks lets marketers:
- Spend less time wrangling spreadsheets
- Make faster, smarter decisions
- Deliver real value to clients and stakeholders
Ready to see how unified data can transform your marketing operations?
Learn more at TapClicks.
Who Benefits Most from Multi-Channel Analytics Dashboards?
Multi-channel analytics dashboards deliver transformative value for a variety of marketing professionals, but their impact is most profound for agencies, media companies, multi-location brands, and enterprise teams. Each of these organizations faces unique challenges that unified analytics are uniquely positioned to solve.
Agencies and Media Companies rely on multi-channel dashboards to efficiently manage reporting for dozens—or even hundreds—of clients. With campaigns running across paid search, social, display, and more, manually aggregating and visualizing performance data is both time-consuming and error-prone. A centralized dashboard streamlines client reporting, improves transparency, and enables agencies to deliver insights faster. As detailed in marketing dashboard automation for agencies, tools like TapClicks automate repetitive reporting work, freeing up analysts to focus on optimization and strategy.
Multi-Location Brands—such as retail chains, franchise groups, or service providers—benefit from the ability to roll up performance data across regions, stores, or business units. A unified analytics platform makes it easy to compare campaign effectiveness by location, maintain consistent KPIs, and quickly spot areas that need support or additional budget. This consolidated view supports better budget allocation and localized marketing strategies.
Enterprise Teams often grapple with complex martech stacks and data silos. Multi-channel analytics dashboards become the single source of truth for marketing performance, bridging disparate systems and allowing teams to share insights across departments. Whether you’re supplying data to BI teams, feeding insights into CRM platforms, or supporting executive-level decision-making with high-level dashboards, unified reporting ensures everyone is working from the same playbook.
In all these scenarios, a robust platform like TapClicks provides not only comprehensive data integration but also customizable dashboards that serve both granular analyst needs and executive summary reporting. The result: actionable intelligence, faster client delivery, and marketing teams empowered to optimize strategies at scale.
Getting Started with TapClicks Analytics Dashboard
Implementing a unified analytics dashboard with TapClicks is a straightforward process designed to get your marketing team up and running quickly—while ensuring your reporting is both comprehensive and tailored to your unique needs. Here’s how to get started:
1. Define Your Objectives and Key Metrics
Begin by outlining the specific business goals and KPIs you need to track. Whether it’s channel attribution, campaign ROI, or budget pacing, having clarity on your reporting priorities will guide the entire setup process.
2. Connect Your Marketing Data Sources
TapClicks supports over 10,000 marketing, advertising, and business data connectors—making it easy to aggregate information from all your channels. Use the platform’s intuitive interface to select and authenticate integrations with sources like Google Ads, Facebook, programmatic platforms, CRM systems, and more.
3. Blend and Organize Your Data
Leverage TapClicks’ robust data enrichment and normalization tools to blend data across campaigns, locations, and clients. This ensures your dashboards reflect a true apples-to-apples comparison for performance analysis, no matter how complex your marketing ecosystem.
4. Customize Your Dashboard Experience
With TapClicks’ drag-and-drop reporting studio, you can tailor dashboards to different user roles—executives, analysts, clients, or sales teams. Choose from a library of visualizations, set up automated scheduled reports, and apply your organization’s branding for a professional, cohesive look.
5. Onboard Your Team
Invite users with role-based access controls, ensuring the right stakeholders see the right data. Take advantage of TapClicks’ support resources and onboarding specialists to train your team and answer technical questions.
6. Explore Advanced Features
Once your dashboards are live, activate AI-powered insights, predictive analytics, and automated notifications (like SmartEmail) to transform raw data into actionable intelligence.
Ready to see TapClicks in action?
Explore a live demo or request a personalized walkthrough at TapClicks.com. Our team is ready to help you unlock the full potential of unified, automated analytics tailored to your organization’s needs.
Start Automating Your Marketing Data Today!
No Credit Card Required.

