

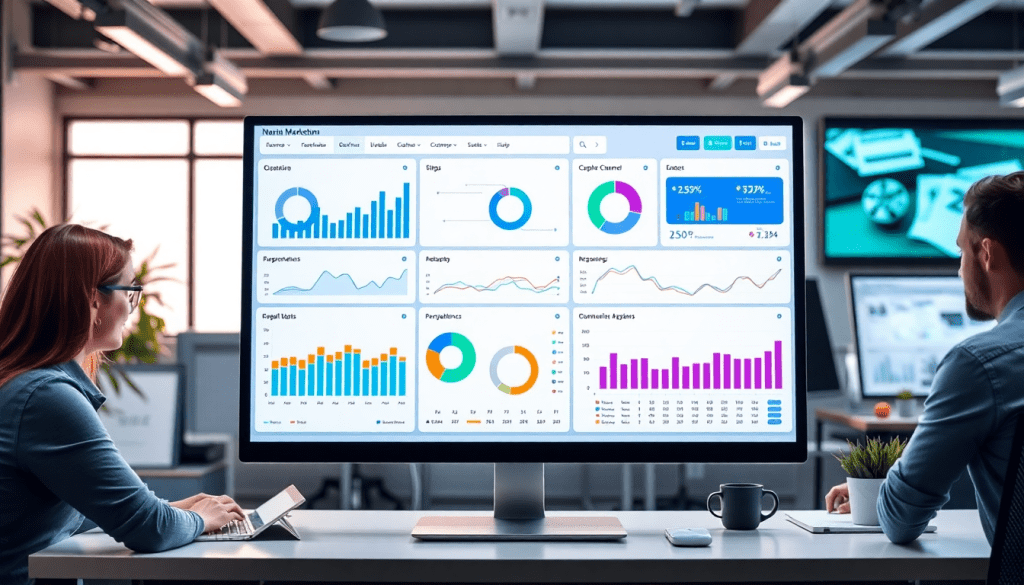
Digital Marketing KPI Dashboard: Visualize Metrics & ROI Fast
A digital marketing KPI dashboard brings clarity and speed to your strategy by transforming scattered data into actionable insights—often in real time. With the right dashboard, you can monitor key metrics across every channel, track ROI, and automate reporting, all from one interactive interface. Marketers, agencies, and enterprise teams can finally see what’s working, what needs attention, and where to optimize, making decision-making more precise and less reactive. Let’s break down how to get the most from your KPI dashboard, what to track, and how tools like TapClicks can elevate your entire reporting process.
What is a Digital Marketing KPI Dashboard?
A digital marketing KPI (Key Performance Indicator) dashboard is a unified, visual workspace designed to track and display the most important metrics for your digital marketing campaigns—all in one place. Its core purpose is to centralize fragmented marketing data into an interactive, real-time view that empowers marketers, agencies, and business leaders to make faster, data-driven decisions.
Unlike static spreadsheets or reports, a KPI dashboard aggregates data from multiple platforms—think Google Ads, Meta, programmatic, email, SEO, and beyond—and translates it into instantly digestible graphs, charts, and widgets. This consolidation eliminates time-consuming manual data pulls and removes guesswork by providing a single source of truth for campaign performance.
But not all dashboards are created equal. Basic dashboards might offer a handful of static widgets or charts, showing siloed metrics like impressions or clicks from one channel at a time. In contrast, advanced, interactive dashboards—like those built with TapClicks—enable true cross-channel analytics. These solutions allow users to filter, drill down, and compare metrics across campaigns, audiences, and timeframes. Marketers can spot trends, diagnose issues, and share insights with stakeholders in real time, all without leaving the dashboard.
As digital marketing grows more complex, the need for automated KPI reporting is also on the rise. With dozens of platforms, evolving goals, and high client or stakeholder expectations, fast, accurate reporting isn’t just a nice-to-have—it’s essential for staying competitive and proving ROI. A robust KPI dashboard forms the backbone of modern marketing analytics, making it possible to track what matters, when it matters most.
What Should You Really Track? Making Sense of Marketing Metrics
Building a dashboard that drives real impact starts with choosing the right KPIs. Not every metric is created equal—so let’s break down what matters most, and how to tailor your tracking to fit your business goals.
Start with the Essentials
Here are the foundational metrics every digital marketing dashboard should include:
- Impressions:
How many times your ads or content are displayed. This is your baseline for brand awareness. - Clicks:
Shows initial engagement and audience interest. - Click-Through Rate (CTR):
Measures how compelling your creative and messaging are (clicks ÷ impressions). - Conversions:
Tracks real business outcomes like form fills, purchases, or downloads.
Get Insightful with Cost-Based KPIs
Want to understand efficiency? Zero in on these:
- Cost per Lead (CPL):
How much you spend to acquire each new lead. - Cost per Acquisition (CPA):
The cost to secure each paying customer. - Return on Ad Spend (ROAS):
Revenue generated per dollar spent—a must for optimizing your marketing budget.
Don’t Forget Strategic Indicators
Beyond the basics, these metrics offer deeper insight:
- Customer Lifetime Value (CLTV):
Projects the total value each customer brings over time. - Engagement Rates:
Includes likes, shares, and comments to show ongoing audience interaction. - Attribution Metrics:
Reveals which channels are driving conversions or assisting in the customer journey.
Customize by Objective
No two organizations are alike. Here’s how focus can shift:
| Type of Organization | High-Priority KPIs |
|---|---|
| B2B Agency | Lead quality, funnel progression |
| Retailer/E-commerce | ROAS, average order value, retention |
- Pro tip: Review KPIs daily, weekly, and by campaign cycle to spot trends and react quickly.
Why Continuous Monitoring Matters
- Agility:
Spot performance shifts early, so you can reallocate budget or refine strategy on the fly. - Data-Driven Strategy:
Use historical trends for forecasting, planning, and long-term growth. - Unified Visibility:
A robust dashboard (like TapClicks!) brings all your data together, making it easier to act on insights.
Want to see how a customizable dashboard can take your KPI tracking to the next level?
Check out TapClicks’ unified marketing operations platform.
Why Real-Time Performance Dashboards Matter More Than Ever
In today’s digital marketing world, waiting days or weeks for performance data just doesn’t cut it. Real-time dashboards have become essential for agencies, enterprise teams, and marketers who need to make fast, data-driven decisions.
What Can You Do With Real-Time Dashboards?
Instant Access Means Instant Action
With live dashboards, you always have your finger on the pulse:
- Spot issues as they emerge: Get alerts on underperforming channels or creative fatigue before they impact results.
- Adapt campaigns in the moment: Adjust budgets, targeting, or messaging in real time.
- Monitor multiple clients or brands: See performance across all accounts—no more toggling between spreadsheets.
Supercharge Optimization and Budget Management
Real-time dashboards aren’t just about speed—they’re about smarter strategy:
- Continuous optimization: Instantly see what’s working and what isn’t, so you can double down or pivot.
- Granular insights: Drill down by channel, audience, or campaign to reveal hidden opportunities.
- Efficient budget allocation: Move spend between campaigns based on live performance, not outdated reports.
Cut the Reporting Chore—For Good
Tired of manual data pulls and endless spreadsheets? Real-time dashboards deliver:
| Challenge | Manual Reporting | Real-Time Dashboards |
|---|---|---|
| Data Updates | Delayed, static | Instant, always current |
| Error Risk | High | Automated, consistent |
| Time Spent | Hours per report | Set up once, auto-updating |
| Collaboration | Fragmented | Everyone sees the same data |
TapClicks’ automation ensures your reports are always up-to-date and error-free—no more chasing numbers or fixing broken links.
Why TapClicks Sets the Standard
Not all dashboard tools are created equal. TapClicks is built for organizations that need:
- Unified, scalable dashboards: Manage thousands of campaigns or clients with ease.
- Custom, branded visualizations: Tailor dashboards for each stakeholder.
- Smart automation: Set up once, then let TapClicks deliver continuous, accurate reporting.
Learn more about how TapClicks automates marketing dashboards and reporting.
The Takeaway
Real-time dashboards aren’t just a convenience—they’re a competitive advantage.
They empower you to:
- Catch opportunities and risks as they arise
- Optimize faster and smarter
- Free up time for strategy, not number crunching
With TapClicks, you don’t just track performance—you transform it.
Automating KPI Reports: Save Time and Reduce Errors
For marketing teams and agencies managing ever-growing campaign portfolios, the value of automated KPI reports cannot be overstated. Automation delivers scalability, accuracy, and significant time savings, freeing up analysts and account managers to focus on strategy and optimization rather than repetitive manual work.
Manual vs. Automated Reporting Workflows
Manual reporting typically involves gathering data from multiple platforms, exporting CSVs, cleaning and blending spreadsheets, and assembling slides or PDFs for each client or stakeholder. This process is not only time-consuming—often taking hours per report—but also highly prone to human error, version control issues, and delays that leave decision-makers working from outdated information.
By contrast, automated reporting workflows centralize data collection, transformation, and visualization. With a platform like TapClicks, data is ingested from every marketing source, automatically refreshed, and piped into pre-built or custom dashboards. Reports can be scheduled, generated, and sent to stakeholders with zero manual intervention, ensuring consistency and reliability at any scale.
TapClicks’ Approach to Automated Dashboard Reporting
TapClicks takes automated dashboard reporting to the next level with a robust suite of tools designed for high-volume agencies and enterprise teams. Users can set up automated report schedules—daily, weekly, monthly, or custom cadences—tailored to each client or campaign. Branded templates allow for customized visuals and commentary, while role-based access ensures the right people receive the right insights without data overload.
Tips for Scheduling, Customizing, and Sharing Automated Reports
- Align Schedules with Decision Cycles: Set reporting frequencies that match your team’s or clients’ review rhythms. For fast-moving campaigns, daily or weekly reports keep everyone in sync.
- Customize for Audience Needs: Use TapClicks’ drag-and-drop dashboard builder to segment data by channel, region, product, or any relevant dimension. Add narrative context or action items to guide recipients.
- Automate Distribution: Leverage TapClicks’ automated delivery to email insights directly to stakeholders or publish dashboards to secure portals, eliminating the need for manual follow-up.
- Maintain Flexibility: Even with automation, always allow for ad-hoc report generation—TapClicks makes it easy to pull and share custom insights on demand.
Ultimately, automated KPI reporting transforms how agencies and marketers operate: reducing errors, accelerating insight delivery, and scaling reporting to hundreds (or thousands) of clients without adding headcount. To see how TapClicks can streamline your own workflows, visit tapclicks.com.
Cross-Channel Analytics: Unifying Data for a Complete View
Modern marketing strategies rarely rely on a single channel—your campaigns might span Google Ads, Facebook, programmatic display, email, influencer partnerships, SEO, and more. But the real power of marketing is unlocked when you can see the entire landscape at a glance. That’s where cross-channel analytics dashboards come in.
A true cross-channel dashboard consolidates data from all your paid, owned, and earned media sources into one unified interface. Instead of jumping between siloed platforms and manually stitching together numbers, marketers and agencies get holistic, apples-to-apples visibility into performance. This means you can compare the impact of a Facebook campaign to a Google Ads effort, track how social engagement affects website conversions, or analyze how email remarketing lifts overall ROI—all in one place.
The challenge, of course, is that marketing data is notoriously fragmented. Data silos slow down reporting, create inconsistencies, and make it difficult to attribute results or spot optimization opportunities. Unifying this data requires robust integration, normalization, and enrichment—capabilities where TapClicks excels.
TapClicks offers a vast ecosystem of 10,000+ data connectors that can ingest metrics from virtually any marketing, advertising, or business platform. Whether you’re tracking impressions from niche ad networks or conversions in your CRM, TapClicks pulls it all together. Its smart data normalization and enrichment tools ensure that disparate metrics (like CPM, CPC, ROAS) are standardized, allowing for true cross-channel comparisons and blended reporting.
With unified cross-channel analytics, marketers can identify which tactics are driving the highest value, optimize budget allocations in real time, and present stakeholders with clear, trustworthy results. Agencies benefit from faster, more accurate client reporting, while brands gain a 360-degree view of their marketing investments. To see how streamlined, cross-channel reporting can transform your analytics process, explore TapClicks' smarter analytics reporting and learn more about the platform at TapClicks.com.
Leveraging AI for Marketing Data Insights
As marketing data grows more complex, AI-powered dashboards are transforming how teams uncover and act on insights. Traditional dashboards may visualize metrics, but they require manual analysis to spot trends, anomalies, or optimization opportunities. In contrast, AI marketing dashboards elevate your data from static charts to a dynamic, insight-driven decision engine.
With AI, dashboards don’t just display numbers—they actively interpret them. For example, advanced anomaly detection algorithms can flag unusual spikes or drops in campaign performance the moment they happen, letting marketers respond before issues escalate or opportunities are missed. Predictive analytics take things further by forecasting future ROI, channel performance, or budget pacing, empowering teams to plan proactively rather than reactively.
Automated recommendations are another game-changer. Instead of sifting through dozens of metrics, AI agents analyze your dashboards, identify underperforming segments, and suggest specific actions—such as reallocating spend to high-ROI channels or adjusting creative for better engagement.
TapClicks stands at the forefront of this evolution with its suite of AI-driven features. SmartPilot leverages machine learning to surface campaign insights, performance benchmarks, and optimization recommendations directly within your dashboard. SmartEmail takes automation a step further by generating and delivering curated insight summaries to stakeholders, ensuring no critical trends go unnoticed—even outside the platform. TapClicks’ predictive models help marketers track ROI, anticipate campaign outcomes, and optimize budget allocation based on data-driven forecasts.
The result? Marketing teams and agencies move from simply monitoring KPIs to actively improving them—faster, smarter, and at scale. To learn more about how TapClicks’ AI-powered dashboards can transform your marketing analytics, visit TapClicks.
Building and Customizing Your KPI Dashboard
Creating a digital marketing KPI dashboard that truly empowers your team starts with a thoughtful, step-by-step approach. Here’s how to build a dashboard that not only aggregates data but also drives smarter decision-making at every level of your organization.
1. Start with Seamless Data Integration
The foundation of any effective KPI dashboard is robust data integration. Begin by connecting your core channels—think paid search, social, programmatic, email, and web analytics. Platforms like TapClicks make this process seamless with 10,000+ prebuilt connectors and flexible data mapping tools, so you can unify campaign data from virtually any source. Smart integration also enables automated data refreshes, ensuring your dashboard always reflects the latest performance.
2. Select KPIs Aligned with Your Goals
Next, identify the marketing metrics that matter most to your business objectives. Prioritize KPIs that map to your campaign goals—such as conversions, CPA, ROAS, engagement rate, or customer lifetime value. Consider customizing metric sets for different teams or stakeholders (for example, executives may want high-level ROI, while channel managers need granular data). This targeted approach keeps dashboards focused and actionable.
3. Design Intuitive Visualizations
Effective dashboards present complex data in clear, interactive formats. Use a mix of charts, graphs, and scorecards to highlight trends and anomalies at a glance. Leverage color coding, conditional formatting, and summary widgets to draw attention to key insights. Interactive features—like date range selectors, channel filters, and geo-mapping—empower users to drill down for deeper analysis without switching tools.
4. Set Up Access Controls and Roles
To maximize utility and security, configure role-based access. Sales teams, campaign managers, and clients can each have tailored views, protecting sensitive data while ensuring everyone gets the information they need. TapClicks, for example, allows you to assign permissions and customize dashboards for individual users, teams, or clients, streamlining collaboration and transparency.
Best Practices for Customization:
- Segment by Channel or Campaign: Build dashboards for specific campaigns, brands, or locations to zero in on relevant performance.
- Incorporate Real-Time Elements: Enable live refresh or scheduled updates to keep data current for fast-paced environments.
- Enable Stakeholder Interactivity: Add elements like dropdown filters, clickable widgets, and annotations so stakeholders can explore data independently.
- Automate Reporting: Schedule recurring report delivery to key audiences, reducing manual work and keeping everyone aligned.
Examples of Interactive Features:
- Drag-and-drop modules for custom layouts
- Multi-level drill-downs (e.g., from total conversions to source/channel details)
- Downloadable CSVs or PDFs for offline analysis
- Embedded comment threads for team collaboration
- Real-time alerts and notifications for KPI thresholds
By following these steps and embracing customization, you’ll create a KPI dashboard that’s not only visually compelling but also a daily driver of marketing performance. Tools like TapClicks make it easy to evolve your dashboard as your strategy changes—ensuring your reporting stays as agile as your marketing.
Choosing the Right Dashboard Platform for Your Needs
Selecting the ideal digital marketing KPI dashboard isn’t just about pretty graphs—it’s about finding a solution that meets your organization’s scale, complexity, and growth ambitions. Here are the most important factors to weigh as you evaluate your options:
1. Scalability and Performance:
Can the platform handle your current and projected reporting needs? Agencies and enterprise teams often juggle hundreds (or thousands) of clients, campaigns, and dashboards. A robust solution like TapClicks is purpose-built for high-volume environments, seamlessly supporting large datasets and multiple users without performance bottlenecks.
2. Integration Ecosystem:
Your dashboard is only as powerful as the data it can access. Look for platforms that offer deep, native integrations with all your marketing, advertising, and business data sources. For example, TapClicks boasts over 10,000 connectors, allowing true cross-channel analytics, whereas alternatives like Funnel.io and Supermetrics primarily focus on being data pipes and may require extra steps to achieve unified reporting.
3. Automation and Reporting Efficiency:
Manual reporting consumes time and is prone to errors—especially at scale. Leading platforms automate data refreshes, report generation, and distribution. TapClicks’ automated dashboard reporting not only saves analysts hours each month but also reduces the risk of oversight, enabling teams to focus on optimization rather than repetitive tasks.
4. AI and Analytics Capabilities:
The future of marketing dashboards lies in intelligent insights, not just static numbers. Does the platform offer AI-powered features like anomaly detection, predictive analytics, and automated recommendations? TapClicks stands out with SmartPilot and SmartEmail, which automatically surface actionable insights and deliver them directly to stakeholders—far beyond traditional dashboard solutions.
5. Customization and Usability:
Ease of use is essential for widespread adoption. The platform should support custom dashboards, flexible visualization, and role-based access so every stakeholder—executives, analysts, clients—sees exactly what matters to them. Compare this to lighter tools like Agency Analytics or NinjaCat, which may offer simplicity but lack the depth and customization required by larger teams.
6. Workflow Integration:
Does the dashboard platform integrate with your existing processes—order management, collaboration, and campaign operations? TapClicks uniquely unifies workflow and reporting in one system, streamlining operations from sales to fulfillment.
Making Your Choice:
Ultimately, the “best” dashboard is the one that solves your real pain points—whether that’s consolidating siloed data, automating time-consuming tasks, or surfacing insights you might otherwise miss. Take time to map your current workflows, identify bottlenecks, and prioritize features that align with your strategic goals. Comparing platforms side-by-side, you’ll find that TapClicks’ blend of scale, automation, AI, and workflow integration delivers significant advantages over fragmented or lightweight alternatives, helping you unlock faster, smarter marketing decisions.
Start Automating Your Marketing Data Today!
No Credit Card Required.

