

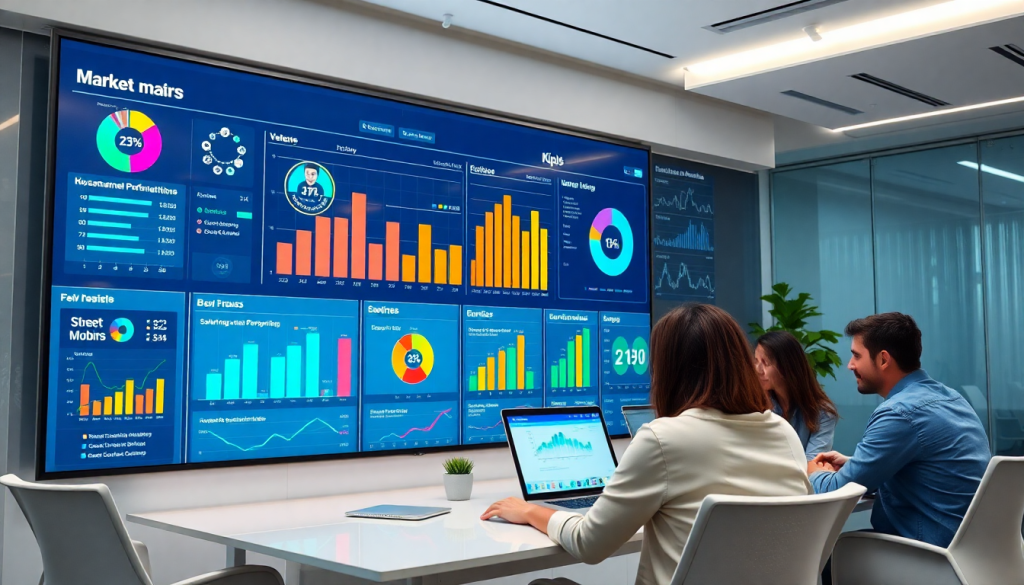
Digital Marketing KPI Dashboard: Visualize Metrics & ROI Fast
For marketers aiming to prove value and drive smarter decisions, a digital marketing KPI dashboard is essential. It transforms scattered campaign data into clear, actionable marketing metrics visualization—giving you and your team a single source of truth for performance tracking, ROI measurement, and real-time insights. Whether you’re managing dozens of channels or reporting to clients, the right dashboard cuts through the noise with interactive performance metrics, cross-channel analytics, and automated KPI reports that let you focus on strategy, not spreadsheets.
What is a Digital Marketing KPI Dashboard?
A digital marketing KPI dashboard is an interactive platform that consolidates, visualizes, and tracks the most important key performance indicators (KPIs) for your marketing campaigns—all in real time. Unlike static, one-off reports, a KPI dashboard automatically ingests data from multiple sources (like Google Ads, Facebook, email platforms, and more) and presents it in dynamic charts, graphs, and tables you can explore and customize. This turns raw numbers into clear, actionable insights, making it far easier to monitor progress, identify trends, and prove ROI.
For marketers, the value of a digital marketing KPI dashboard lies in its ability to transform scattered campaign data into a centralized “mission control” for performance monitoring. Instead of juggling spreadsheets or waiting for manual report updates, you gain a live view of metrics that matter—from impressions and clicks to conversions and return on ad spend (ROAS). This level of visibility empowers teams to react faster, optimize tactics on the fly, and demonstrate value to stakeholders with confidence.
Crucially, dashboards go beyond what static reports can offer. While a static report is a snapshot in time, a dashboard is interactive—letting you drill into specific campaigns, compare channels side-by-side, or set up custom alerts for KPI fluctuations. This interactivity speeds up analysis, supports smarter decision-making, and allows for ongoing optimization rather than after-the-fact adjustments.
To learn more about how these dashboards work and why they’re foundational for modern marketing teams, check out this Digital Marketing KPI Dashboard Overview.
Key Metrics and KPIs Every Marketer Should Track
A digital marketing KPI dashboard is only as valuable as the metrics it tracks. To move the needle on business outcomes, marketers need to focus on the KPIs that truly map to their campaign objectives and organizational goals. Here are the essential marketing KPIs every team should monitor—and why they matter:
1. Impressions
Impressions measure how often your ads or content are displayed, regardless of clicks. This top-of-funnel metric is critical for assessing brand awareness and reach across channels like display, social, and search.
2. Clicks & Click-Through Rate (CTR)
Clicks show user engagement, while CTR (clicks divided by impressions) reveals how compelling your messaging and creative are. Tracking CTR helps refine ad copy and targeting for platforms like Google Ads or Facebook.
3. Conversions & Conversion Rate
A conversion is any action you define as valuable: purchases, signups, downloads, or contact form submissions. Conversion rate (conversions divided by clicks) is a fundamental indicator of landing page and campaign effectiveness.
4. Cost Per Acquisition (CPA)
CPA tells you how much you’re spending, on average, to acquire a customer or lead. This metric is crucial for budget optimization and profitability analysis, especially in paid search, social, and display.
5. Return on Ad Spend (ROAS) & Return on Investment (ROI)
ROAS (revenue generated divided by ad spend) provides a direct view of campaign efficiency. ROI goes further by factoring in total costs—helping marketers prove marketing’s impact on the bottom line.
6. Engagement Metrics
For channels like social and email, tracking likes, shares, comments, and open/click rates helps assess audience resonance and content strategy.
Mapping KPIs to Business Goals
The true power of these metrics is unlocked when they’re aligned with business objectives. For example, brand-focused campaigns may prioritize impressions and engagement, while lead-gen or ecommerce efforts zero in on conversions, CPA, and ROI. By connecting each KPI to a specific goal—awareness, consideration, conversion, or retention—you ensure your dashboard delivers actionable insights, not just data.
Channel-Specific Examples
- Search (Google Ads): Impressions, CTR, conversions, CPA, Quality Score
- Social (Meta, LinkedIn): Engagement rate, reach, conversions, ROAS
- Display: Impressions, viewability, clicks, post-view conversions
- Email: Open rate, click rate, conversion rate, unsubscribe rate
For more strategies on building a cross-channel analytics dashboard that visualizes and tracks these metrics, check out these cross-channel analytics dashboard tips.
By focusing on the right KPIs and consistently tying them back to your objectives, your digital marketing dashboard becomes a vital tool for performance improvement, client reporting, and strategic growth.
Why Automated KPI Reporting and Visualization Are a Game-Changer
Automating KPI reports and unlocking powerful data visualizations isn’t just about convenience—it’s about transforming your marketing operations. Here’s how these tools elevate your team’s impact, performance, and strategic agility.
Instant Time Savings and Efficiency
Manual reporting is a thing of the past when you automate:
- No more spreadsheet wrangling: Data from all your sources is pulled, blended, and formatted automatically.
- Scheduled (or on-demand) delivery: Reports arrive in your inbox or client portal when you need them—no more last-minute scrambles.
- Error reduction: Automation minimizes human mistakes, ensuring accuracy and consistency.
- Focus on strategy: Free up your team from repetitive tasks so they can focus on campaign optimization and growth.
Visualization: Making Data Actionable for Everyone
Great visualization turns raw numbers into business intelligence. Here’s what interactive dashboards and charts deliver:
- Immediate trend spotting: See campaign performance at a glance—no more digging through rows of data.
- Stakeholder-friendly: Visuals make insights accessible to team members and clients, even those less familiar with analytics.
- Actionable insights: Spot outliers, correlations, and “aha!” moments that drive optimization.
- Performance transparency: Clearly see which channels, tactics, or creatives are moving the needle.
| Data Type | Manual Process | Automated + Visualized |
|---|---|---|
| Campaign Spend | Spreadsheet entry | Live dashboard, auto-updated |
| Channel ROI | Manual calculation | Visualized, instant insights |
| Creative Testing | Static slides/reports | Interactive charts, drill-downs |
Real-Time Dashboards: Move at the Speed of Marketing
When every minute counts, up-to-date data is your secret weapon:
- Continuous refresh: Always-on dashboards surface opportunities and risks as they happen.
- Faster decisions: Respond to shifts in channel performance or budget pacing in real time.
- Competitive edge: In a world where speed drives ROI, rapid insight means smarter, more effective campaigns.
Why It Matters for Modern Marketers
Automated KPI reporting and visualization aren’t just “nice to have”—they’re essential for growth-minded teams. By embracing these tools, you:
- Drive smarter, faster decisions
- Demonstrate clear value to stakeholders and clients
- Create a sustainable reporting workflow that scales with your business
Ready to take your analytics to the next level? Check out our cross-channel analytics dashboard tips for more ways to optimize your reporting and visualization strategy.
Setting Up a Performance Tracking Dashboard (Without the Headaches)
You don’t need to be a data engineer to build a dashboard that delivers actionable insights. Here’s a straightforward roadmap to launch a dashboard that actually drives results—whether you’re an agency scaling for hundreds of clients or a marketing team juggling multiple channels.
Start With the Right Platform
What to Look For:
- Scalability: Will it handle your current—and future—data load?
- Data Integration: Does it connect to all your channels (Google Ads, Facebook, web analytics, etc.)?
- User Experience: Is it intuitive enough for both analysts and executives?
- Customization: Can you tailor dashboards for different users or clients?
💡 TapClicks checks all these boxes, with 10,000+ connectors, automated reporting, and flexible templates.
Connect Your Data—All of It
Integration Checklist:
- Google Ads/Analytics
- Facebook/Meta Ads
- LinkedIn Campaigns
- Email Platforms
- CRM & Sales Tools
- Web Analytics
- Any niche or proprietary platforms via Smart Connectors
Pro Tip: Opt for a tool with automated ETL/ELT pipelines to save hours on manual imports and ensure data is always fresh.
Build Your Metrics and Visuals
Map Out What Matters:
- Impressions
- Clicks
- Conversions
- Cost per Acquisition (CPA)
- Return on Investment (ROI)
- Custom KPIs by campaign, channel, or business goal
Dashboard Design Table:
| Metric | Widget Type | Visualization | Use Case |
|---|---|---|---|
| Impressions | Scorecard | Single Value Tile | Campaign reach overview |
| CPA | Line Chart | Trend Over Time | Budget efficiency |
| ROI | Bar Chart | Channel Comparison | Optimize spend |
Organize widgets so users can spot trends, outliers, and progress at a glance.
Make the Dashboard User-Friendly
Design Tips:
- Clarity: Only include essential KPIs. Use consistent colors and clear labels.
- Personalization: Allow users to filter by region, channel, or date range.
- Access Control: Set role-based permissions—clients see topline, analysts get details.
- Accessibility: Make sure dashboards are mobile-friendly and easy to share.
Don’t Forget These Key Details
- How often do you need data updated? (Real-time, hourly, daily…)
- Are your dashboards secure for multiple clients or brands?
- Do you need mobile access for teams on the go?
The Payoff
By following these steps, you’ll build a dashboard that’s robust, scalable, and actually empowers your team.
Less spreadsheet wrangling. More time optimizing campaigns. Greater marketing ROI.
Ready to get started? See how TapClicks can help.
AI Marketing Dashboards: Smarter Insights, Less Effort
Modern marketing teams are under constant pressure to sift through mountains of data, spot trends, and pivot campaigns quickly. Traditional dashboards are powerful for aggregating metrics, but today’s leaders want more than data—they want intelligence. That’s where AI marketing dashboards come in, transforming performance tracking from reactive to proactive with features like automated insights, anomaly detection, and predictive analytics.
AI-powered dashboards automatically analyze your campaign KPIs in real time, surfacing not just what happened, but why—and what to do next. For example, if your cost per acquisition (CPA) suddenly spikes or click-through rates dip on a specific channel, AI agents can flag these anomalies instantly, helping you investigate and resolve issues before they impact ROI. Instead of poring over spreadsheets or waiting for weekly reports, you get actionable alerts as soon as they matter.
Advanced platforms like TapClicks go a step further by offering AI-driven recommendations directly within the dashboard. TapClicks’ SmartPilot, for instance, can suggest budget reallocations, identify underperforming creatives, or highlight which audience segments are exceeding benchmarks. These insights aren’t just static data points—they’re tailored, data-backed recommendations that empower marketers to optimize campaigns on the fly.
Even better, features like SmartEmail automate the delivery of AI-curated performance summaries straight to stakeholders’ inboxes—internal teams or clients—so everyone stays informed without manual intervention. Predictive modeling tools can also forecast future outcomes based on historical trends, giving you a head start on planning and resource allocation.
By harnessing the power of AI marketing dashboards, teams can move beyond basic reporting to achieve true data-driven optimization, freeing up valuable time and ensuring you never miss an opportunity to improve results.
Cross-Channel Analytics: See the Full Picture
In today’s multi-platform landscape, relying on single-channel reports only tells part of the story. True marketing insight comes from a unified cross-channel analytics dashboard, which brings all your marketing efforts—paid, organic, social, and even offline—into one cohesive view. This comprehensive approach allows marketers to connect the dots between campaigns, identify attribution paths, and spot trends that would otherwise go unnoticed in siloed data.
Blending diverse data sources is essential for digital campaign reporting. By integrating everything from Google Ads and Facebook campaigns to SEO performance and email marketing, you can visualize the real impact of each effort in the context of your entire strategy. The ability to combine online and offline channels—such as linking digital ads with in-store sales—further elevates your understanding of ROI and customer journey.
A sophisticated cross-channel dashboard streamlines all this complexity. Marketers can quickly filter by channel, campaign, or region, and drill down into specific KPIs like cost per acquisition (CPA), return on ad spend (ROAS), and engagement metrics. Automated visualizations reveal which channels drive the most value, where budget reallocations could boost performance, and how holistic attribution models outperform last-click reporting.
For inspiration, explore these advanced multi-channel dashboard examples to see how leading marketers unify their data for actionable insights. Whether you’re reporting to stakeholders or optimizing campaigns, cross-channel analytics delivers the full picture—so you can make smarter, data-driven decisions at scale. To see how TapClicks makes unified analytics effortless, visit TapClicks.
Optimizing ROI Tracking for Marketers
To drive real business results, marketers need more than just a snapshot of campaign metrics—they need crystal-clear visibility into marketing ROI across every channel, campaign, and client. A best-in-class digital marketing KPI dashboard makes ROI tracking actionable by centralizing performance, automating calculations, and enabling smarter budget decisions.
Visualizing and Tracking ROI Across Campaigns and Channels
Start by mapping revenue and costs directly within your dashboard. Leading solutions let you pull in spend and revenue data from platforms like Google Ads, Facebook, CRM systems, and even offline sources, then configure widgets to display ROI, ROAS, and cost-per-acquisition at every level—campaign, channel, client, or region. This layered visualization instantly highlights which investments drive the best returns, and which need reallocation.
Attributing Revenue to Marketing Touchpoints
Attribution is critical for understanding the true impact of your marketing efforts. Modern dashboards support multi-touch attribution models, letting you see how each interaction—whether it’s a paid search click, a social ad view, or an email open—contributes to conversions and revenue. By leveraging these attribution tools, marketers can move beyond last-click bias, uncover hidden value in supporting channels, and justify budget across the full customer journey.
Using Dashboard Data for Budget Planning and Optimization
With ROI tracking at your fingertips, dashboards become a launchpad for continuous improvement. Analyze historical ROI trends to spot seasonal patterns, compare budget allocation by channel, and identify underperforming segments. Some platforms, like TapClicks, even provide predictive insights and budget pacing recommendations powered by AI. Use these insights to shift spend in real-time, double down on high-performing tactics, and build data-driven forecasts for future campaigns.
By combining robust visualization, multi-touch attribution, and actionable analytics, a digital marketing KPI dashboard empowers marketers to prove true value, optimize spend, and maximize ROI—no matter how complex the marketing ecosystem.
Choosing the Right Dashboard Solution
Selecting the best digital marketing KPI dashboard isn’t just about pretty charts—it’s about empowering your team to work smarter, scale confidently, and turn data into real business value. With a crowded market of dashboard solutions, it’s crucial to focus on features that truly drive results.
Must-Have Features for Modern Marketing Dashboards
First, integration is non-negotiable. Your dashboard should seamlessly connect to all your marketing data sources—think ad platforms, analytics tools, CRMs, and beyond. Robust integration (with thousands of connectors, not just a handful) ensures your KPIs are always up-to-date and comprehensive.
Customization is equally critical. Look for dashboards that let you tailor visualizations, branding, and reporting formats to fit your team’s unique needs and client expectations. The ability to build drag-and-drop widgets, set access permissions, and automate scheduled reports can save countless hours and reduce errors.
Scalability should also be top of mind. As your campaigns, clients, and channels grow, your dashboard solution must keep up—handling thousands of reports, users, and datasets without breaking a sweat. If you work at an agency or multi-location brand, multi-client support and role-based access controls are essential for secure, streamlined operations.
Finally, consider vendor support and ongoing innovation. The right partner won’t just help you onboard—they’ll keep you ahead of the curve with AI-powered insights, predictive analytics, and regular feature updates.
Evaluating Vendors: What Matters Most
When comparing vendors, request live demos and trial periods. Test how easily the platform ingests your actual data and adapts to your workflows. Don’t settle for surface-level dashboards—dig into how the tool handles cross-channel analytics, custom KPIs, and data normalization.
Be sure to assess the platform’s ability to automate repetitive tasks, such as scheduled reporting and alerting. Strong documentation, training resources, and responsive support teams are signs of a partner committed to your long-term success.
TapClicks: Scalable, AI-Powered Marketing Analytics
A leading example in this space is TapClicks, a unified marketing operations platform designed for agencies, media companies, and enterprise brands. TapClicks stands out with its 10,000+ data connectors, flexible dashboard studio, and powerful AI-driven insights that surface optimization opportunities and automate KPI summaries. Its platform is purpose-built for high-volume reporting, multi-client management, and workflow automation—making it a top choice for organizations seeking both scale and intelligence.
By focusing on integration, customization, scalability, and innovation, you’ll be positioned to choose a dashboard solution that not only visualizes your KPIs but also transforms your marketing operations for the better.
Start Automating Your Marketing Data Today!
No Credit Card Required.

