

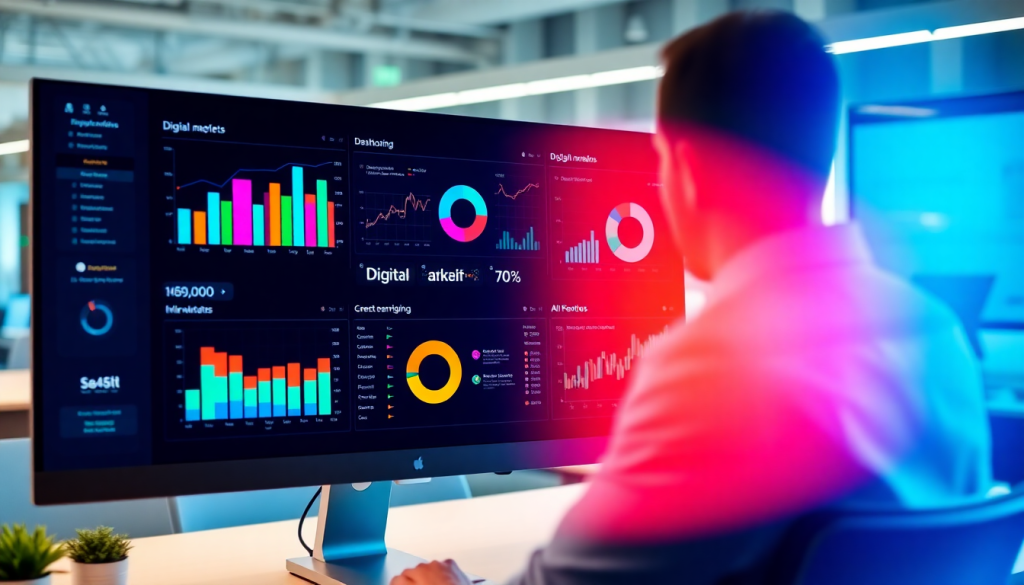
Digital Marketing KPI Dashboard: Metrics & Performance Insights
A digital marketing KPI dashboard brings all your essential marketing metrics into one place, giving teams and stakeholders a real-time, visual overview of campaign performance. From cross-channel analytics to AI-powered insights, these dashboards streamline reporting and make it easier to track ROI, optimize strategy, and communicate results. Whether you manage campaigns for a single brand or hundreds of clients, a well-designed dashboard empowers you to move quickly from data to action.
What Is a Digital Marketing KPI Dashboard?
A digital marketing KPI dashboard is a centralized, visual platform that compiles and displays your most important marketing metrics—Key Performance Indicators (KPIs)—in real time. Its core purpose is to give marketing teams, agencies, and stakeholders immediate access to the data that matters most, ensuring everyone can monitor campaign performance, identify trends, and make informed decisions faster.
Unlike spreadsheets or siloed analytics tools, a digital marketing KPI dashboard brings together data from multiple channels—such as paid ads, social media, email, SEO, and more—into a single, cohesive view. This unified visibility is critical for modern marketing operations, where agility and cross-channel alignment drive results. With all your KPIs in one place, teams can spot underperforming campaigns, optimize budgets, and clearly demonstrate ROI to leadership or clients.
Basic dashboards typically offer static reports and simple visualizations: think pie charts of traffic sources or tables of conversion data. While useful, these tools often require manual data pulls and lack deeper insights. Advanced, AI-powered dashboard solutions go far beyond. They automate data collection, normalize metrics across platforms, and use artificial intelligence to surface actionable insights—such as budget pacing recommendations, anomaly detection, and performance forecasts. This next level of automation not only saves hours of manual work but also empowers marketers to act on data, not just observe it.
For a deeper dive into how automation elevates dashboard effectiveness, check out this resource on automation for smarter analytics and reporting. Ultimately, a digital marketing KPI dashboard is your command center for marketing performance—enabling data-driven decisions, streamlined reporting, and continuous optimization at scale.
What Makes a Marketing Dashboard Truly Effective?
A great marketing dashboard isn’t just a collection of numbers—it’s your real-time command center for campaign performance and business impact. But what exactly should you track to get a full picture?
The Must-Have Metrics for Every Dashboard
Here’s what to include to ensure your dashboard delivers actionable insights:
-
Traffic Metrics
- Website visits, unique users, session duration
- Break down by channel (organic, paid, social, referral) to pinpoint what’s working
-
Conversion Metrics
- Track key actions: form submissions, purchases, downloads, and other goal completions
- Reveals how well you’re moving users through the funnel
-
Cost Per Acquisition (CPA)
- Shows your average spend to acquire each customer or lead
- Monitor CPA by channel to optimize your budget
-
Return on Investment (ROI)
- Directly tie campaign costs to revenue generated
- Offers a quick read on overall marketing effectiveness
-
Engagement Metrics
- Click-through rate (CTR), bounce rate, time on page
- Indicates how compelling your content is, and where users might be dropping off
-
Lead Quality & Sales Metrics
- Marketing-qualified leads (MQLs), sales-qualified leads (SQLs), pipeline value
- Especially important for B2B and lead-gen teams to align marketing with sales outcomes
Why Unified, Cross-Channel Analytics Matter
When your dashboard aggregates data from all your marketing platforms—Google Ads, Facebook, LinkedIn, email, SEO, display, and more—you:
- Eliminate data silos
- See true channel performance side-by-side
- Quickly identify where to double down or pivot
Unlocking Deeper Insights with Interactivity
Modern dashboards aren’t static. With interactive features, you can:
- Drill down by timeframe, campaign, or audience segment
- Filter and sort KPIs on the fly
- Visualize trends and outliers for faster decision-making
Your Next Step
By focusing on these core KPIs—and leveraging cross-channel, interactive dashboards—your team gains a holistic, real-time understanding of what’s driving results.
Ready to go further?
- Learn more about automating your analytics and reporting: Smarter analytics and reporting automation
- See how TapClicks brings all your metrics together at scale: Visit TapClicks
Why Visualizing Your Marketing Metrics Changes Everything
Turning raw marketing data into something meaningful isn’t just about crunching numbers—it’s about making those numbers speak. Well-designed visualizations bridge the gap between data overload and actionable insight, enabling everyone from campaign managers to C-suite leaders to move faster and smarter.
What Makes Visualization So Powerful?
-
Instant Clarity:
- Bar graphs quickly highlight your top-performing channels.
- Trend lines show growth (or dips) at a glance.
- Heatmaps reveal geographic hot spots for engagement.
-
Interactive Exploration:
- Custom widgets and drill-down charts let users slice and dice data any way they need.
- Spot patterns, outliers, or sudden shifts—before they impact your bottom line.
-
Role-Based Views:
- Campaign managers can compare conversion rates across platforms in seconds.
- Executives get a high-level view of ROI trends—no manual spreadsheets required.
How Real-Time Dashboards Boost Your Results
Here’s why automation in dashboard reporting is a game-changer:
| Benefit | What It Means for Your Team |
|---|---|
| Always Current | Dashboards auto-update with the latest data—no waiting. |
| Less Manual Work | Automated workflows eliminate repetitive reporting tasks. |
| More Accurate | Reduces human error and keeps insights reliable. |
| Faster Decisions | Teams spot issues and act in real time, not after-the-fact. |
For a deeper dive, check out how dashboard automation boosts analytics reporting.
The Real Business Value
Automated, visual reporting isn’t just about pretty charts—it’s about:
- Making analytics accessible to everyone, not just data specialists
- Fueling smarter, faster strategy adjustments
- Scaling marketing operations effortlessly
Why TapClicks Leads Here
With robust visualization tools, TapClicks turns complex performance data into clear, instantly usable dashboards—helping your team see exactly what’s working and where to focus next.
Ready to make your marketing data work harder—and smarter? Explore TapClicks and see the difference visualized data can make.
Campaign KPI Monitoring & Automated Reports
At the heart of high-performing digital marketing lies the continuous monitoring of campaign KPIs. Campaign KPI monitoring is essential for ongoing optimization, allowing marketers to track key metrics—such as impressions, clicks, conversions, and spend—in real time. By keeping a close eye on these indicators, teams can quickly identify underperforming channels or creative assets, make swift adjustments, and ensure that campaigns are always aligned with strategic goals.
Traditionally, manually tracking and compiling these metrics has been both time-consuming and error-prone. This is where automated KPI reporting steps in, transforming the process with features like scheduled report delivery, customizable report templates, and built-in error checking. Modern marketing platforms, such as TapClicks, enable users to set up recurring reports that are automatically populated and distributed to relevant stakeholders at the desired frequency—be it daily, weekly, or monthly. Customization options ensure that each stakeholder receives the exact data and visualizations they need, tailored to their focus areas or business units.
Automated reports not only reduce the risk of human error but also free up valuable analyst hours previously devoted to manual data wrangling and slide building. With automated KPI monitoring and reporting, marketing teams routinely report time savings of 50+ hours per analyst each month. This efficiency gain allows teams to shift focus from tedious reporting tasks to deeper analysis, campaign strategy, and creative innovation. Ultimately, automated campaign KPI monitoring and reporting drive both accuracy and agility in marketing operations—delivering the timely, actionable insights needed to optimize performance and maximize ROI.
Cross-Channel Analytics: Seeing the Full Picture
In today’s fragmented digital landscape, marketers are challenged to measure performance across a sprawling array of channels—social, search, email, programmatic, and more. Each platform comes with its own data silos, metrics, and reporting quirks, making it painfully difficult to get a unified, actionable view of marketing efforts. Manual aggregation is time-consuming, error-prone, and often leaves teams reacting to outdated insights.
That’s where cross-channel analytics dashboards step in. By automatically consolidating campaign data from every channel into a single, unified dashboard, these solutions cut through the noise and reveal the metrics that truly matter. Instead of toggling between dozens of ad manager tabs or wrestling with manual spreadsheets, marketers get real-time, apples-to-apples comparisons of performance. This unified perspective is invaluable for pinpointing which channels drive conversions, identifying underperformers, and reallocating budget to maximize ROI.
The benefits are especially pronounced for agencies managing multiple clients, brands running campaigns across regions, or enterprises with complex, multi-location operations. For instance, an agency can instantly generate client-ready dashboards showing Facebook, Google Ads, and LinkedIn campaign results side by side—no manual merges required. Multi-location brands can track local campaign effectiveness and roll up results to see national trends at a glance.
Ultimately, cross-channel analytics dashboards empower marketing teams to make smarter, faster decisions. By removing data silos and delivering holistic campaign analytics, they provide the clarity needed to optimize performance, demonstrate value, and stay ahead in a competitive digital world. To see how a platform like TapClicks can unify your cross-channel data and streamline reporting at scale, visit TapClicks.
AI Marketing Dashboards: Your New Competitive Edge
AI is turning traditional marketing dashboards into proactive, intelligent allies. No longer just static data displays, today’s AI-powered dashboards are dynamic tools that anticipate, alert, and advise—enabling marketers to act faster and smarter than ever before.
What Sets AI Dashboards Apart?
Let’s break down the latest advancements in AI-driven dashboards:
1. Predictive Insights: See Around Corners
- Forecast outcomes: AI models analyze historical campaign data to predict future results.
- Spot budget risks early: Receive alerts about pacing issues or possible conversion dips before they impact ROI.
- Plan smarter: Adjust strategies mid-flight with confidence, rather than reacting after the fact.
2. Anomaly Detection: Catch What Others Miss
- Automatic monitoring: AI scans all campaigns and channels 24/7.
- Instant alerts: Get notified of unusual spikes in cost per acquisition (CPA) or unexpected drops in engagement.
- Swift action: Investigate issues or double down on positive trends in real time—no more manual data sifting.
3. Automated Optimization Recommendations: Turn Insight Into Action
- Data-driven suggestions: AI algorithms recommend specific actions, like reallocating budget to top-performing channels.
- Creative tweaks: Receive tips on adjusting ad creative or messaging for better results.
- No more guesswork: Move from “what happened” to “what should we do next?”
Why AI Dashboards Matter for Agencies & Marketers
Managing dozens (or hundreds) of campaigns across multiple clients can be overwhelming. AI-empowered dashboards:
- Automate complex analysis that would normally take hours.
- Accelerate reporting, boosting both speed and accuracy.
- Deliver strategic value by surfacing insights you might otherwise miss.
Learn how automation is changing agency reporting.
Ready to Level Up Your Performance Tracking?
The future isn’t just about reporting on what’s happening; it’s about knowing what to do next. Unified, AI-powered dashboards—like those from TapClicks—make that future a reality for marketers who demand more from their data.
Stop looking back. Start moving ahead—automatically.
ROI Tracking for Marketers: Making Data Actionable
Accurate ROI tracking is the linchpin of effective digital marketing—and your KPI dashboard should make this process both seamless and insightful. Modern dashboards go beyond surface-level metrics, empowering marketers to connect every dollar spent to tangible business outcomes.
Techniques for Accurate ROI Tracking:
To ensure reliable ROI calculations, your dashboard should integrate data from all relevant sources—ad platforms, web analytics, CRM systems, and finance tools. This unified view allows you to automatically match marketing spend to conversions, revenue, and customer lifetime value. Advanced platforms, like TapClicks, leverage ETL/ELT pipelines to clean and normalize disparate datasets, minimizing manual errors and ensuring consistency across reporting.
Integrations that Close the Loop:
True ROI tracking happens when your dashboard seamlessly connects with the systems that matter most. For example, integrating with Google Ads, Facebook Ads, Salesforce, and accounting platforms lets you automatically attribute conversions and revenue to specific campaigns, channels, or even keywords. This closed-loop measurement is crucial for understanding which tactics drive the greatest return—and where budget adjustments are needed.
Communicating ROI to Stakeholders:
Even the most sophisticated analysis is only valuable when it’s clearly communicated. Use visualizations—such as ROI trend lines, budget vs. revenue widgets, and interactive breakdowns—to make data accessible for all audiences. Automated, scheduled reports ensure stakeholders receive timely insights, while AI-powered summaries can highlight key performance drivers and optimization recommendations. By turning raw numbers into compelling stories, you’ll not only prove marketing’s value but also build trust and alignment across your organization.
With the right dashboard and approach, ROI tracking becomes more than a reporting requirement—it becomes the foundation for data-driven growth.
Choosing the Right Dashboard Solution
Selecting the right digital marketing KPI dashboard is a pivotal decision that impacts your team’s efficiency, insight quality, and bottom-line results. With a crowded landscape of tools and platforms, it’s essential to ensure your chosen solution not only tracks metrics but genuinely supports your business goals. Here are the core criteria you should evaluate as you compare options:
1. Scalability:
Can the platform handle your current workload—and grow with you? Whether you’re reporting on a handful of campaigns or managing data for hundreds of clients and locations, your dashboard solution must support high volumes of data, users, and reports without sacrificing performance or user experience.
2. Data Integration:
A modern marketing dashboard should easily connect with all your key data sources: ad platforms, analytics tools, CRMs, and more. Look for solutions offering a broad library of pre-built connectors, as well as the flexibility to build custom integrations for niche or proprietary data.
3. Customization & Visualization:
Your dashboard should adapt to your unique business needs, not the other way around. Prioritize platforms that allow for custom metrics, branding, and interactive widgets—enabling you to create tailored views for each client, channel, or stakeholder.
4. Automation & AI-Driven Insights:
Today’s leading solutions go beyond static reporting. Seek out dashboards with built-in automation for report scheduling, error reduction, and data refreshes. Advanced platforms leverage AI for predictive analytics, anomaly detection, and actionable recommendations, helping you surface insights—and act on them—faster.
5. Support & User Experience:
Responsive support, intuitive interfaces, and comprehensive onboarding resources are critical to long-term success. Ensure your provider offers the training and assistance needed to maximize platform value for every member of your team.
Questions to Ask Before You Choose
- Can the dashboard aggregate and normalize data from all my marketing channels?
- How easy is it to build and share custom dashboards with stakeholders?
- What level of automation and AI insights does the platform provide?
- Does the solution scale to accommodate multi-client or multi-location reporting?
- What are the onboarding, support, and training options?
- Can I export or integrate my data with other business intelligence tools?
The Bottom Line
Choosing the right dashboard solution is about more than just visualizing data—it’s about creating a single source of truth that empowers smarter decision-making and streamlines every phase of marketing operations. By focusing on scalability, robust integration, customization, automation, and support, you’ll ensure your team has the tools it needs to deliver timely, actionable insights and drive campaign success.
Ready to transform your digital marketing reporting? Explore how TapClicks unifies data, analytics, and workflow for agencies, brands, and enterprises here.
Start Automating Your Marketing Data Today!
No Credit Card Required.

