

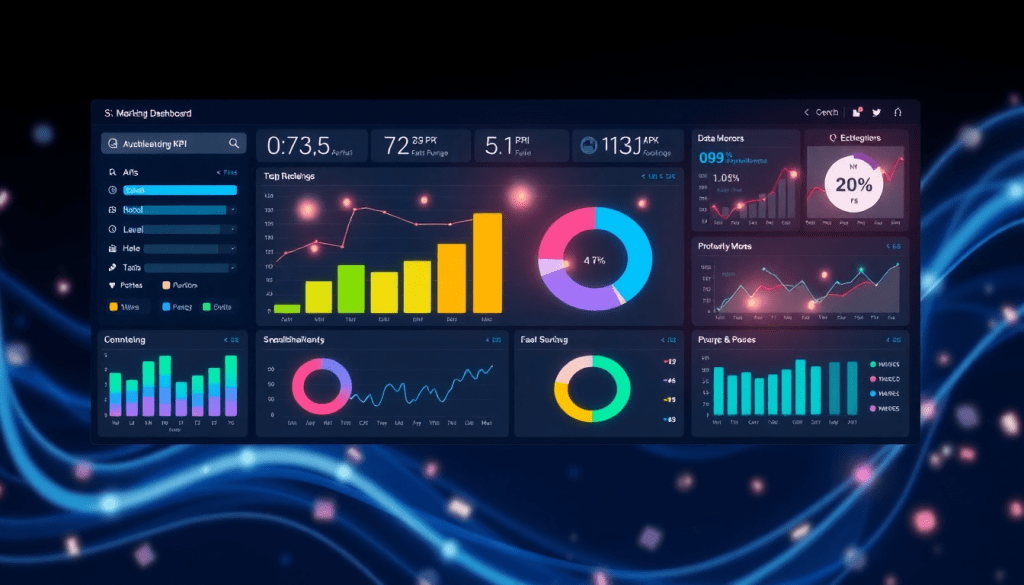
Automated KPI Reporting Dashboard: Smarter Analytics with AI
Marketing teams and agencies manage a flood of campaign data from dozens of channels every week. But sifting through spreadsheets and manually building reports drains time and leaves little space for strategic thinking. An automated KPI reporting dashboard, powered by AI, transforms this process—bringing together marketing analytics automation, instant dashboard creation, and actionable insights in one unified platform. With TapClicks AI, you can track ROI, visualize cross-channel performance, and deliver smart, automated reporting for your clients or stakeholders, all while reclaiming valuable hours for more impactful work.
Why Marketing Analytics Automation Matters
In today’s digital marketing landscape, analytics teams are awash in data—campaign metrics pour in from countless platforms, often in different formats, at breakneck speed. Manually collecting, cleaning, and consolidating this data into reports isn’t just labor-intensive; it’s a process fraught with human error, delays, and missed insights. As teams juggle spreadsheets and chase down out-of-sync numbers, valuable hours are lost to repetitive work instead of strategic analysis or campaign optimization.
That’s where automated KPI reporting dashboards come in. By automating the entire data pipeline—from extraction to visualization—these platforms drastically improve efficiency, allowing marketers to focus on what truly matters: interpreting results and driving action. Automated dashboards eliminate manual errors, accelerate reporting cycles, and ensure that every stakeholder has access to real-time, accurate performance metrics. As your campaigns scale across more channels and clients, automation ensures your analytics stay reliable and manageable.
With TapClicks, marketing analytics automation is seamless. TapClicks unifies all your data sources, automates KPI tracking, and delivers branded reports on a schedule—freeing up teams to make smarter decisions, faster. Instead of wrangling disparate sources, marketers can rely on a single platform for holistic campaign visibility and actionable insights. Looking to dive deeper? Explore marketing dashboard automation strategies to see how automation can transform your analytics workflow.
Core Features of an Automated KPI Reporting Dashboard
An effective automated KPI reporting dashboard is more than just a collection of charts—it's a dynamic command center for marketing intelligence. The best dashboards are built on a foundation of several core features that together drive efficiency, clarity, and actionable insights.
1. Robust Data Integration:
The cornerstone of any automated dashboard is seamless data connectivity. Modern platforms like TapClicks offer access to over 10,000 marketing and business data connectors, automatically pulling campaign data from sources such as Google Ads, Facebook, programmatic platforms, CRM systems, and more. This eliminates manual data wrangling and ensures that your dashboard always reflects the freshest performance data.
2. Smart Visualization Tools:
Data is only as powerful as it is understandable. Automated dashboards provide drag-and-drop visualization tools, letting you quickly build interactive charts, tables, and scorecards that highlight the KPIs that matter most. Whether you’re tracking impressions, conversions, or customer acquisition costs, smart visualization turns complex datasets into clear, compelling stories. For more examples of how to visualize digital marketing KPIs for rapid ROI insights, check out this guide on KPI dashboard visualization.
3. Automated and Scheduled Reporting:
Manual reporting is time-consuming and prone to error. Automated dashboards let you set up scheduled reports—daily, weekly, or monthly—so your team and clients receive up-to-date performance snapshots without lifting a finger. This not only saves hours every week but also ensures consistency and accuracy across all your reporting.
4. Multi-Source Aggregation:
Today’s marketing landscape is fragmented across dozens of channels and platforms. Automated KPI dashboards aggregate data from all these sources into a single, unified view. This cross-channel consolidation is essential for understanding the true impact of your marketing efforts and ensuring nothing slips through the cracks.
5. AI-Powered Reporting Assistants:
Perhaps the most transformative feature is the rise of AI-driven insights. AI reporting assistants, like those built into TapClicks, continuously analyze your dashboards and datasets to surface trends, anomalies, and optimization opportunities automatically. Instead of spending hours searching for insights, marketers receive instant, actionable recommendations—enabling smarter, faster decision-making.
6. Cross-Channel Performance and ROI Dashboards:
A world-class dashboard doesn’t just show channel-specific metrics—it delivers a holistic view of performance. Cross-channel dashboards track KPIs across paid, owned, and earned media, while ROI dashboards tie spend directly to business outcomes. This empowers marketers to optimize budgets, benchmark performance, and clearly demonstrate value to stakeholders.
By combining these features, automated KPI reporting dashboards free marketing teams from tedious manual tasks and unlock the full power of their data. To learn more about building dashboards that drive results, explore TapClicks’ digital marketing KPI visualization strategies, or discover the capabilities of TapClicks at tapclicks.com.
How TapClicks AI Platform Powers Smarter Reporting
TapClicks stands apart as a true marketing operations platform (MOP), unifying every aspect of marketing analytics, reporting, and workflow into a single, scalable system. At the heart of its AI-powered solution are over 10,000 data connectors, allowing you to seamlessly integrate marketing, advertising, and business data from virtually any source—no manual stitching or data wrangling required. This deep connectivity means agencies and brands can instantly pull in campaign performance, budget data, and ROI metrics across paid, owned, and earned channels.
Once the data is centralized, TapClicks leverages artificial intelligence through its TapInsights and SmartPilot features. These AI agents automatically analyze dashboards and datasets to surface actionable insights—no more digging through endless rows of numbers. With predictive analytics, TapClicks not only benchmarks campaign performance but also provides optimization recommendations and budget pacing, helping you proactively adjust strategies for the best outcomes.
Automated dashboard creation is another hallmark: with drag-and-drop visualization tools and a branded reporting studio, users can build custom dashboards and schedule reports in minutes, not hours. This means agencies can deliver beautiful, white-labeled client reports at scale, and brands can ensure consistent, up-to-date analytics for every stakeholder.
Most importantly, TapClicks’ automation doesn’t stop at reporting. Its workflow and order management modules streamline campaign operations—assigning tasks, managing approvals, and providing role-based access for collaboration between sales, ops, and fulfillment teams. The result: less time spent on manual processes, and more time focused on strategy and growth.
To see how TapClicks’ AI-driven approach to analytics automation is transforming reporting for marketing teams, check out their smarter analytics automation guide, or learn more at tapclicks.com.
Setting Up Your Automated Dashboard: Step-by-Step
Launching an automated KPI reporting dashboard is easier than you might think—especially with a platform like TapClicks that’s built for scale and simplicity. Here’s a step-by-step guide to get your dashboard up and running, ensuring you capture the metrics that matter and automate reporting from day one.
1. Connect Your Data Sources
Start by linking all your marketing, advertising, and business data sources to your dashboard platform. TapClicks offers 10,000+ prebuilt connectors, making it effortless to integrate everything from Google Ads and Facebook to programmatic platforms, CRMs, and even offline data. For custom sources, TapClicks’ Smart Connectors let you easily ingest spreadsheets or bespoke datasets with minimal setup.
2. Select and Define Your KPIs
Before building visualizations, clarify the key performance indicators (KPIs) that align with your goals—whether that’s cost per acquisition, ROAS, impressions, or lead quality. TapClicks enables you to filter and blend data across sources, so you can create standardized metrics that make sense for each client, team, or campaign.
3. Build Visualizations Tailored to Your Audience
With your data connected and KPIs defined, use TapClicks’ drag-and-drop reporting studio to create clear, engaging dashboards. Choose from a library of charts, tables, and widgets to visualize trends, compare channels, and highlight what’s driving results. Build custom dashboards by client, channel, or campaign to ensure each stakeholder sees exactly what they need—no more one-size-fits-all reports.
4. Automate Report Scheduling and Distribution
Save hours every month by automating when and how your reports are delivered. In TapClicks, you can schedule dashboards and reports to go out as branded PDFs or interactive links—daily, weekly, or monthly—to internal teams or directly to clients. With features like SmartEmail, TapClicks even sends AI-generated insight summaries alongside your reports, adding instant value to every update.
Best Practices for Success
- Segment by audience: Create dashboard templates for different client tiers, regions, or campaign types.
- Leverage role-based access: Use TapClicks’ permissions to control who sees what, keeping data secure and relevant.
- Iterate regularly: As priorities shift, update your dashboards to reflect the latest goals and KPIs.
By following these steps, you’ll move from manual, reactive reporting to a proactive, automated approach—freeing up time for higher-impact analysis and strategy. For more on how TapClicks can accelerate your marketing analytics workflow, visit TapClicks or explore marketing dashboard automation strategies.
Tracking Performance and ROI Across Every Channel—Made Effortless
Modern marketing spans a dizzying array of channels—search, social, display, email, and more. But getting a unified, up-to-the-minute view of performance? That’s where most analytics tools fall short.
Why Unified Dashboards Matter
With TapClicks, all your marketing data comes together in one place. Here’s what that means for your day-to-day:
- No more platform-hopping: See search, social, programmatic, and email results side by side.
- Automated KPI reporting: Dashboards refresh in real time, so you’re never working with outdated numbers.
- Single source of truth: Every campaign, channel, and location is integrated—no more cobbling together spreadsheets.
AI: Your Performance Analyst on Demand
The magic really happens when AI enters the mix. TapClicks uses advanced AI to:
- Benchmark your results: Instantly see how paid, owned, and earned media stack up against industry standards or past campaigns.
- Spot optimization opportunities: AI flags underperforming channels and surfaces where to double down.
- Forecast ROI: Predictive analytics look ahead, projecting return based on current spend and trends.
- Get proactive recommendations: TapClicks AI suggests budget pacing, creative tweaks, and channel reallocations—no manual digging required.
Building and Visualizing ROI Like a Pro
With TapClicks, visualizing ROI isn’t a manual chore. Instead, you get:
| What You Can Track | How TapClicks Helps |
|---|---|
| Campaign spend vs revenue | Automated dashboards for spend, revenue, and margin—updated in real time |
| Channel attribution | Attribution modeling that shows which channels drive the most conversions |
| Location-specific results | Drill down to see performance by market, region, or even individual store |
| Creative & audience impact | Analyze results by creative type or audience segment for granular insights |
Looking for visualization tips? Check out our digital marketing KPI dashboard guide.
Turning Data Into Decisive Action
With TapClicks, cross-channel reporting and ROI measurement aren’t just streamlined—they’re transformed. Complex, siloed data becomes:
- Actionable insights for real-time optimization
- Clear value demonstrations for clients and stakeholders
- Confident budget allocation based on real results
Curious how unified reporting can supercharge your marketing intelligence? Explore TapClicks and see the difference for yourself.
Delivering Client Analytics Automation at Scale
For agencies and multi-location brands, managing analytics for dozens—or even hundreds—of clients is a monumental task. Each client expects timely, transparent, and customized reporting on their marketing performance. Manual processes can’t keep up with this demand, leading to bottlenecks, inconsistent insights, and overworked teams. This is where a platform like TapClicks truly excels: by delivering client analytics automation at scale.
With TapClicks, agencies can seamlessly manage large portfolios thanks to robust role-based access controls. This ensures each stakeholder—whether it’s a brand manager or an account executive—sees only the data relevant to them, while administrators maintain complete oversight. Custom white-label reporting lets agencies and brands present branded dashboards and reports, enhancing professionalism and strengthening client trust.
The platform’s workflow automation tools—including TapOrders and TapWorkflow—streamline campaign intake, order management, and internal collaboration. This means less time spent tracking requests or chasing approvals, and more time focusing on campaign strategy and optimization.
Perhaps most impactful is the time saved. Routine data pulls and report generation can be fully automated, often reclaiming 50+ hours per analyst each month. Agencies have reported onboarding hundreds of client dashboards in weeks, not months, and delivering scheduled, error-free reports with minimal manual effort. This operational efficiency translates directly into improved transparency for clients, faster turnarounds, and the ability to scale service offerings without adding headcount.
To see how TapClicks enables agencies and enterprise brands to unify campaign data, automate client reporting, and operate at scale, explore more at TapClicks.
Unlocking Campaign Performance Insights with AI
An automated KPI dashboard does more than just display numbers—it translates raw data into actionable insights, in real time and at scale. With AI-powered analytics like those in TapClicks, marketing teams can shift from reactive reporting to proactive decision-making.
How AI-Driven Analytics Change the Game
With tools like TapClicks’ SmartPilot, marketers no longer have to sift through endless dashboards for answers. Instead, AI surfaces the most important insights, instantly and contextually:
-
Automatic Insight Discovery:
Receive real-time recommendations on trends, anomalies, and opportunities—no manual analysis required. -
Anomaly Detection:
Spot sudden spikes or drops in performance. AI flags these automatically so you can investigate and act before small issues become big problems. -
Predictive Pacing:
Stay on budget with alerts if your campaigns are over- or under-spending, helping you optimize in the moment. -
Benchmarking Tools:
Compare your results against industry standards or your own historical performance, all without manual calculations.
Keep Stakeholders in the Loop—Automatically
One of TapClicks’ standout features is SmartEmail:
- AI-Generated Insight Summaries:
SmartEmail automatically creates plain-language updates and delivers them directly to your inbox (or your clients’). - No More Manual Reporting:
Automated, curated insights keep teams and stakeholders informed—no more pulling reports or missing key trends.
What Does This Mean for Marketers?
By harnessing TapClicks’ AI-powered analytics:
- Be Proactive, Not Reactive:
Identify and act on opportunities or issues before they impact performance. - Optimize In-Flight:
Adjust campaigns on the go, not just after the fact. - Save Time:
Focus on strategy and creativity, not manual reporting or data wrangling. - Make Confident Decisions:
Leverage always-on, data-backed recommendations to drive better results.
| Feature | Benefit |
|---|---|
| SmartPilot AI | Instant, actionable insights |
| Anomaly Detection | Fast response to performance changes |
| Predictive Pacing | Real-time budget management |
| Benchmarking | Context for performance vs. past/industry norms |
| SmartEmail | Automated, curated insight delivery |
TapClicks transforms your dashboard from a static report into a dynamic analytics assistant—empowering your team to unlock deeper marketing intelligence with every campaign.
➡️ Ready to see the difference? Explore TapClicks’ intelligent reporting solutions.
Choosing the Right Platform for Marketing Intelligence Automation
With a growing landscape of dashboard and reporting tools—ranging from Funnel.io and Adverity to Agency Analytics, Datorama, Supermetrics, and NinjaCat—selecting the best-fit platform for automated KPI reporting is crucial for marketing teams aiming to drive smarter analytics and operational efficiency.
TapClicks stands out by unifying data integration, AI-powered analytics, and workflow automation under one roof. While many competitors function as lightweight dashboard tools (like Agency Analytics and NinjaCat) or act solely as data pipelines (such as Funnel.io and Supermetrics), TapClicks uniquely delivers both the breadth and depth needed for agencies and brands at scale. With over 10,000 data connectors, TapClicks enables seamless aggregation and normalization of multi-channel data, eliminating the manual headaches of stitching together disparate sources.
The platform’s AI-driven capabilities go beyond static dashboarding. TapClicks surfaces actionable insights, offers predictive campaign recommendations, and automates routine reporting tasks—freeing up analyst hours and accelerating time to value. Features like SmartEmail and AI Agents proactively deliver insights to stakeholders, while robust workflow and order management tools support role-based access, white-label reporting, and collaboration across teams.
When evaluating automated KPI reporting solutions, consider the following:
- Scalability: Can the platform manage hundreds (or thousands) of dashboards, clients, and reports simultaneously?
- AI Insights: Does it provide not just visualization, but also intelligent recommendations and automated analysis?
- Workflow Integration: Are there built-in tools for order management, client access control, and report approval processes?
- Flexibility: Can you use it as a single source of truth or integrate seamlessly with existing BI stacks?
For organizations seeking a true marketing operations platform—one that brings together analytics, reporting, and operational workflow at enterprise scale—TapClicks delivers unified intelligence where others fall short. Make sure your chosen solution doesn’t just automate the creation of dashboards, but also empowers your team with the insights and operational agility needed for a rapidly evolving marketing landscape.
Start Automating Your Marketing Data Today!
No Credit Card Required.

