

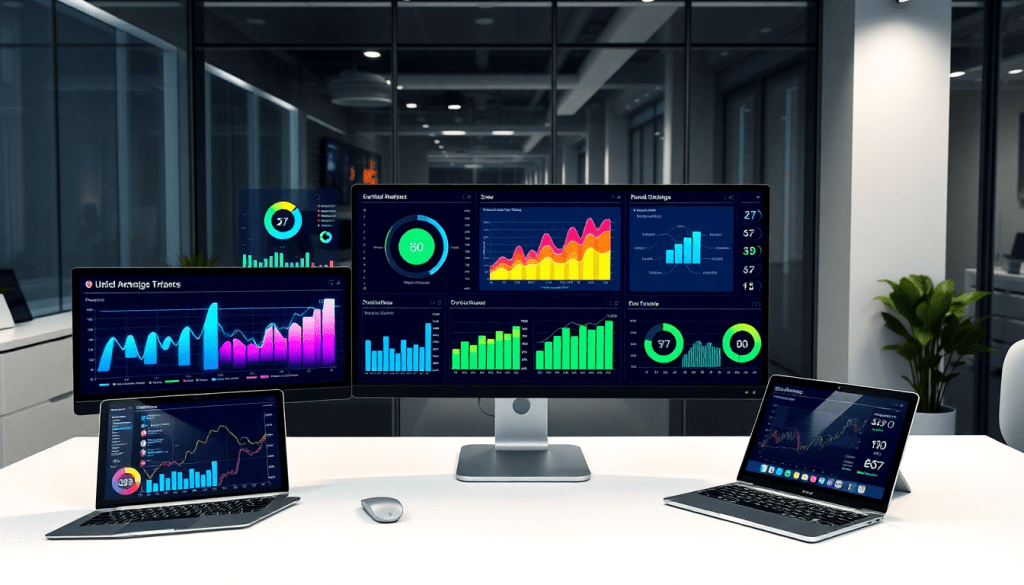
Supermetrics Alternative: TapClicks Marketing Analytics Dashboard
Choosing the right marketing analytics dashboard can make or break your agency’s ability to deliver clear, actionable insights to clients at scale. If you’re searching for a Supermetrics alternative that streamlines reporting automation, unifies cross-channel analytics, and delivers powerful client dashboard insights, TapClicks offers a robust platform built for agencies, brands, and enterprise teams. This guide explores how TapClicks compares to Supermetrics and other competitors, with a focus on automating performance reports, improving data visualization, and elevating your agency’s analytics workflow.
Why Agencies Seek a Supermetrics Alternative
Agencies today operate in a fast-paced, data-driven environment where clients expect real-time insights and transparent, impactful reporting. While Supermetrics is a well-known tool for pulling marketing data into spreadsheets and BI platforms, many agencies begin to encounter significant challenges as their client base and reporting complexity scale.
Manual Processes and Reporting Bottlenecks
One of the most common pain points with Supermetrics is the reliance on manual workflows. Setting up data pulls, wrangling spreadsheets, and building dashboards often require ongoing hands-on effort, which can quickly become overwhelming when managing dozens or hundreds of client accounts. This manual overhead not only eats into valuable analyst time but also increases the risk of errors and inconsistencies in client reports.
Dashboard Customization and Insights Limitations
Supermetrics users frequently cite limitations in dashboard customization and the depth of analytics available out-of-the-box. Since Supermetrics primarily acts as a data pipeline, agencies are left to construct, maintain, and update their own dashboards in external tools like Google Data Studio or Excel. This fragmented approach can hinder the delivery of cohesive, branded dashboards and make it difficult to deliver actionable, cross-channel insights at scale.
Channel Coverage and Integration Gaps
As agencies expand their services, the need for broad and deep channel integrations becomes critical. Supermetrics offers a solid set of connectors, but gaps often emerge—especially when agencies need to blend data from less common ad platforms, CRM systems, or offline sources. The inability to easily normalize and unify disparate data can lead to reporting blind spots and missed optimization opportunities.
The Need for Scalable, Automated Reporting
Modern agencies are seeking solutions that go beyond just data extraction. They want automated reporting platforms that can centralize analytics, enable drag-and-drop dashboard creation, and deliver scheduled, branded reports automatically to clients. This level of automation is essential for reducing manual workloads, improving accuracy, and scaling agency operations without ballooning headcount.
For a deeper dive into why agencies are moving away from patchwork solutions like Supermetrics, see TapClicks vs Supermetrics for Agencies, which outlines how unified platforms like TapClicks address these pain points and empower agencies to grow with confidence.
In summary, agencies seeking a Supermetrics alternative are looking for a marketing analytics dashboard that eliminates manual processes, closes integration gaps, and automates the entire reporting workflow—enabling them to deliver greater value to clients while saving time and resources. For many, TapClicks has emerged as the all-in-one platform that meets these evolving needs. Learn more about the TapClicks approach at TapClicks.com.
TapClicks vs Supermetrics: Feature-by-Feature Comparison
When evaluating marketing analytics dashboards, agencies need more than just basic data connectors—they require true automation, deep customization, and seamless delivery of insights at scale. Let’s break down how TapClicks and Supermetrics compare across the most critical features for agencies and marketing teams.
Data Integration: Connectors and Data Management
TapClicks leads with over 10,000 marketing, advertising, and business data connectors, supporting virtually every channel your clients demand—including niche ad platforms, CRMs, and offline sources. TapClicks’ Smart Connectors and automated ETL/ELT pipelines not only extract and load data but also transform and normalize it for advanced cross-channel analysis. This is essential for agencies handling multi-location brands or complex client portfolios.
Supermetrics boasts a strong set of connectors as well, but its coverage is generally focused on the most common digital channels. Agencies sometimes report the need for manual workarounds or additional connectors for less mainstream sources, which can limit scalability.
Automated Performance Reports and Scheduling
TapClicks offers automated, fully branded reporting with drag-and-drop dashboards and scheduled delivery to internal teams or clients. Reports can be set to run daily, weekly, or monthly—ensuring stakeholders always have up-to-date insights without lifting a finger. TapClicks’ workflow engine also allows for advanced report routing and approval processes, which is critical for agencies with multiple clients or account managers.
Supermetrics provides automated data transfer into spreadsheets and BI tools (like Google Sheets or Data Studio), but often relies on manual dashboard assembly or less flexible scheduling options. For agencies needing to deliver polished, client-ready reports at scale, this can mean extra effort.
Dashboard Customization and Client Insights
With TapClicks, agencies get a robust dashboard builder that supports custom branding, user permissions, and tailored views per client, location, or team. You can blend multiple data sources into unified dashboards and visualize KPIs with advanced widgets and AI-powered insights. This enables agencies to deliver not just data, but meaningful stories and recommendations.
Supermetrics primarily delivers raw data feeds and relies on third-party visualization tools for dashboarding. While this offers some flexibility, it requires more setup and often lacks the unified, agency-branded experience that TapClicks provides out of the box.
Key Metrics at a Glance
| Feature | TapClicks | Supermetrics |
|---|---|---|
| Data Connectors | 10,000+ | 100+ |
| ETL/ELT Automation | Yes (built-in) | Limited |
| Dashboard Builder | Drag-and-drop, white-label, multi-client | Via third-party tools |
| Automated Scheduling | Yes, advanced workflows | Basic, dependent on data destination |
| AI Insights & Recommendations | Yes (TapInsights, SmartPilot) | No |
| Report Delivery | Automated, branded, at scale | Manual or basic automation |
For a more detailed side-by-side analysis, check out the TapClicks vs Supermetrics Comparison.
Bottom Line: If your agency is looking for a Supermetrics alternative that goes beyond data pipes to deliver robust automation, deep customization, and AI-driven insights, TapClicks emerges as the superior choice for scalable, client-centric marketing analytics.
Benefits of TapClicks for Agency Reporting Automation
When it comes to streamlining agency reporting workflows, TapClicks stands out for its intuitive drag-and-drop dashboard builder and robust automated report scheduling. These features minimize the manual effort traditionally required to prepare, customize, and distribute client reports—freeing up agency teams to focus more on strategy and client service.
With TapClicks, agencies can design visually engaging, fully branded dashboards in minutes, without needing specialized technical skills. The platform’s dashboard builder empowers users to assemble cross-channel visualizations, set up custom KPIs, and tailor reports for each client or campaign segment—all through a simple drag-and-drop interface. This not only accelerates the reporting process but also ensures each client receives insights in a format that resonates.
Perhaps the most significant boost to agency efficiency comes through TapClicks’ automated report scheduling. Reports, once configured, can be delivered automatically to clients or internal stakeholders at any cadence—daily, weekly, monthly, or custom intervals. This eliminates the repetitive task of manually exporting, compiling, and emailing reports, which can save analysts and account managers 50+ hours per month, according to agency case studies.
Crucially, TapClicks is designed for scale. Whether you manage a handful of clients or hundreds, the platform’s infrastructure supports high-volume reporting without sacrificing performance or reliability. Role-based access controls ensure that each client or team member only sees the data relevant to them, enhancing data security and simplifying client communication.
Finally, TapClicks goes beyond static reporting by surfacing actionable insights directly within client dashboards. AI-powered agents and SmartEmail summaries automatically highlight campaign wins, optimization opportunities, and budget pacing—making it easier for agencies to deliver proactive, consultative recommendations at scale.
For agencies seeking a reporting automation solution that reduces manual workload, increases productivity, and delivers client dashboard insights seamlessly, TapClicks is an ideal choice. Learn more about how TapClicks can transform your reporting automation workflow at TapClicks.com.
Cross-Channel Analytics and Data Visualization That Actually Work
Today’s marketing agencies and brands are managing campaigns across dozens of platforms—think search, social, programmatic, email, and beyond. Keeping all those metrics in check shouldn’t mean hours lost to spreadsheets or patchwork dashboards. That’s where TapClicks comes in.
Why Unified Data Matters
TapClicks automatically connects to over 10,000 data sources. Here’s what that means for you:
- No more manual exports: Campaign performance, ad spend, conversions, and engagement metrics flow in automatically from every platform your clients use.
- A true single source of truth: All your marketing data, unified and standardized—no more jumping between tools or reconciling mismatched numbers.
Build Dashboards Your Way
With TapClicks, you’re in control of how data is visualized and shared:
- Drag-and-drop widgets: Quickly build real-time dashboards tailored to your needs.
- Custom views for every audience: Create dashboards for each client, region, or vertical.
- Advanced filtering: Segment by channel, campaign, geo, or any metric that matters.
- Live updates: Dashboards refresh automatically as new data comes in—no more waiting for batch updates.
| Dashboard Feature | What You Get |
|---|---|
| Drag-and-drop customization | Personalize dashboards for each use case |
| Real-time data | Always up-to-date with the latest campaign metrics |
| Role-based access | Share the right data with the right stakeholders |
| Advanced segmentation | Drill down by location, channel, or campaign attribute |
From Data to Decisions—Fast
With all your cross-channel data visualized in TapClicks, you can:
- Benchmark campaigns side by side (e.g., compare Facebook vs. Google Ads ROAS).
- Spot trends across digital touchpoints—see what’s working, where, and why.
- Surface actionable insights instantly—identify optimization opportunities at a glance.
No more “pretty charts” that don’t drive action. Every TapClicks report is designed to tell a clear, compelling story—helping agencies and brands make smarter, faster decisions.
Curious how TapClicks can transform your agency’s analytics and reporting?
Explore the platform in depth at TapClicks.
Automated Performance Reports: Saving Time and Improving Accuracy
For agencies juggling multiple clients and campaigns, manual reporting is a productivity killer—and it’s prone to error. TapClicks eliminates these hurdles through end-to-end report automation powered by robust ETL/ELT pipelines. With TapClicks, data is automatically extracted from over 10,000 marketing, advertising, and business sources, then transformed and loaded into your dashboards without the need for tedious manual intervention.
This seamless data flow is a game-changer for agency operations. Automated ETL/ELT ensures that data is always current, standardized, and report-ready, reducing the risk of human error from manual data entry or disparate spreadsheets. As a result, agencies can deliver accurate, up-to-date client reports with confidence, even as campaign complexity grows.
TapClicks’ reporting automation extends to scheduled delivery and customizable templates. Agencies can set up drag-and-drop dashboards once and automate recurring, branded reports to go out to stakeholders at any cadence—daily, weekly, or monthly—saving analysts and account managers 50+ hours a month. This not only streamlines internal workflows but also means clients receive insights faster, with less back-and-forth and fewer delays.
Ultimately, TapClicks empowers agencies to focus on strategic analysis and client relationships rather than wrestling with data. For a deeper dive on how reporting automation can transform your agency’s efficiency and accuracy, explore Reporting Automation for Agencies or visit TapClicks to see automated reporting in action.
TapClicks vs Funnel.io: How Does It Stack Up?
When evaluating marketing analytics platforms, Funnel.io is frequently mentioned alongside TapClicks for agencies that require automated data collection and reporting. However, a closer look reveals significant differences in reporting automation, analytics features, and scalability—areas where TapClicks consistently stands out.
Reporting Automation:
While both platforms offer automated data extraction and transformation, TapClicks takes reporting automation several steps further. TapClicks enables agencies to set up fully automated, scheduled reports tailored for each client, leveraging a drag-and-drop dashboard builder and branded reporting studio. This eliminates repetitive manual work and ensures stakeholders always receive up-to-date insights—without analyst intervention. Funnel.io, in contrast, is primarily a data pipeline tool, requiring users to export data to external dashboards or BI tools before meaningful visualizations or client-ready reports can be created. For agencies managing dozens or hundreds of clients, TapClicks’ integrated reporting engine streamlines delivery and minimizes friction.
Analytics Features and Scale:
TapClicks is designed for high-volume agency and enterprise use. It supports thousands of concurrent dashboards and reports, role-based access, and multi-client management—all from a single, unified platform. Beyond raw data aggregation, TapClicks provides advanced enrichment tools for blending, normalizing, and analyzing data across multiple channels, locations, or brands. Funnel.io, while robust in its connector library, focuses on moving data rather than end-to-end analytics or campaign performance visualization. Agencies that need more than a data pipe—such as AI-powered insights, campaign scoring, and predictive recommendations—find TapClicks’ analytics stack far more comprehensive.
Dashboard Flexibility and Data Enrichment:
Customization is another key differentiator. TapClicks’ dashboards are highly customizable, enabling agencies to create branded, client-specific views with interactive widgets and visualizations. The platform’s enrichment tools make it easy to blend disparate data sources, providing unified and actionable insights without the need for additional BI tools. Funnel.io users often rely on third-party platforms for dashboarding, which can introduce complexity and slow down insight delivery.
For a detailed breakdown of these distinctions, see the in-depth TapClicks vs Funnel.io comparison.
In summary, while Funnel.io is well-suited for organizations simply looking to centralize and export marketing data, TapClicks excels as a true all-in-one marketing operations platform—delivering automated reporting, scalable analytics, and flexible dashboards that drive real agency efficiency. To see how TapClicks can transform your agency’s reporting workflow, visit TapClicks.
Real-World Results: Agencies Upgrading to TapClicks
The real test of any marketing analytics dashboard comes from agencies who put it to work—especially those who have outgrown the limitations of Supermetrics or Funnel.io. For many, switching to TapClicks has yielded transformative results across efficiency, client satisfaction, and analytics depth.
Time Savings and Workflow Efficiency:
Agencies consistently report dramatic reductions in manual work after adopting TapClicks. For example, a multi-location digital agency that migrated from Supermetrics to TapClicks was able to automate over 90% of its recurring reporting tasks. What once required upwards of 60 analyst hours a month—extracting, transforming, and merging data from disparate sources—was cut down to just a few hours of oversight, thanks to TapClicks’ automated ETL workflows and scheduled reporting. This freed up analysts to focus on strategic optimization and proactive client recommendations, rather than wrangling spreadsheets.
Enhanced Cross-Channel Analytics:
A major pain point with many point-solution tools is fragmented data, making it tough to deliver unified insights to clients. Agencies that switched to TapClicks cite the platform’s deep data integration—over 10,000 connectors and powerful Smart Connectors—as a game-changer. One agency with a diverse roster of clients (from e-commerce to local franchises) used TapClicks to unify paid search, social, programmatic, and offline data into single, customizable dashboards. This allowed them to surface cross-channel performance trends in real time, fueling more impactful client conversations and data-driven recommendations.
Improved Client Satisfaction:
With TapClicks’ drag-and-drop dashboards and automated client reporting, agencies can deliver polished, branded reports on a consistent schedule—without manual intervention. According to a testimonial from a leading US media agency, their Net Promoter Score (NPS) jumped 30% after implementing TapClicks, largely due to faster turnaround, more granular insights, and the ability to instantly answer client questions with real-time data.
Onboarding and Support Experience:
Making the leap to a new reporting platform can be daunting, but agencies highlight TapClicks’ onboarding and support as key differentiators. TapClicks offers tailored implementation plans, in-depth training, and ongoing support from a dedicated success manager. Agencies describe the onboarding process as “white-glove,” with clear timelines and proactive troubleshooting to ensure a smooth transition that minimizes disruption.
For an in-depth look at agency success stories and the measurable impact of upgrading from Supermetrics or Funnel.io, explore the TapClicks customer stories and resources. These real-world results show why TapClicks isn’t just a Supermetrics alternative—it’s the unified marketing operations platform agencies rely on to scale data, reporting, and client value.
How to Get Started with TapClicks Reporting Platform
Getting started with TapClicks is designed to be straightforward—whether you’re transitioning from Supermetrics, Funnel.io, or another analytics tool. Here’s a step-by-step guide to help your agency launch faster, drive value sooner, and start delivering scalable, automated insights to your clients.
1. Request a Personalized Demo
Begin by requesting a demo with the TapClicks team. A product specialist will tailor the walkthrough to your agency’s unique requirements, showcasing how TapClicks handles your specific data sources, workflows, and reporting needs.
2. Map Your Data Sources
TapClicks supports over 10,000 marketing, advertising, and business connectors. During onboarding, you’ll identify the platforms you need—Google Ads, Meta, LinkedIn, programmatic, CRM, and more. TapClicks’ implementation team will guide you through connecting these data sources securely via TapData or Smart Connectors.
3. Build or Import Dashboards
Leverage the intuitive drag-and-drop dashboard builder to create custom, branded dashboards for each client or business unit. If you have existing templates (from Supermetrics, Data Studio, or other platforms), TapClicks can help you replicate or enhance them for seamless transition.
4. Automate Reporting Workflows
Set up automated report scheduling to deliver insights to clients or internal teams at your desired cadence—daily, weekly, or monthly. TapClicks’ robust automation reduces manual steps and ensures stakeholders always have up-to-date performance analytics.
5. Train Your Team and Clients
TapClicks offers comprehensive training resources, including live sessions, on-demand tutorials, and a dedicated knowledge base. You’ll also have access to a customer success manager to ensure a smooth onboarding and adoption experience for both your team and your clients.
6. Explore AI-Powered Insights
Activate TapClicks’ AI agents to begin surfacing actionable campaign insights, optimization recommendations, and automated SmartEmail summaries—empowering you to move from reactive to proactive client service.
7. Scale with Confidence
As your agency grows, TapClicks scales with you—supporting new data sources, additional clients, and advanced analytics needs without missing a beat. The platform is designed for high-volume reporting and multi-client management at enterprise scale.
Ready to upgrade your marketing analytics dashboard? Visit TapClicks to schedule a personalized demo or start your free trial, and experience how easy it is to unify, automate, and elevate your agency’s reporting with TapClicks.
Start Automating Your Marketing Data Today!
No Credit Card Required.

