

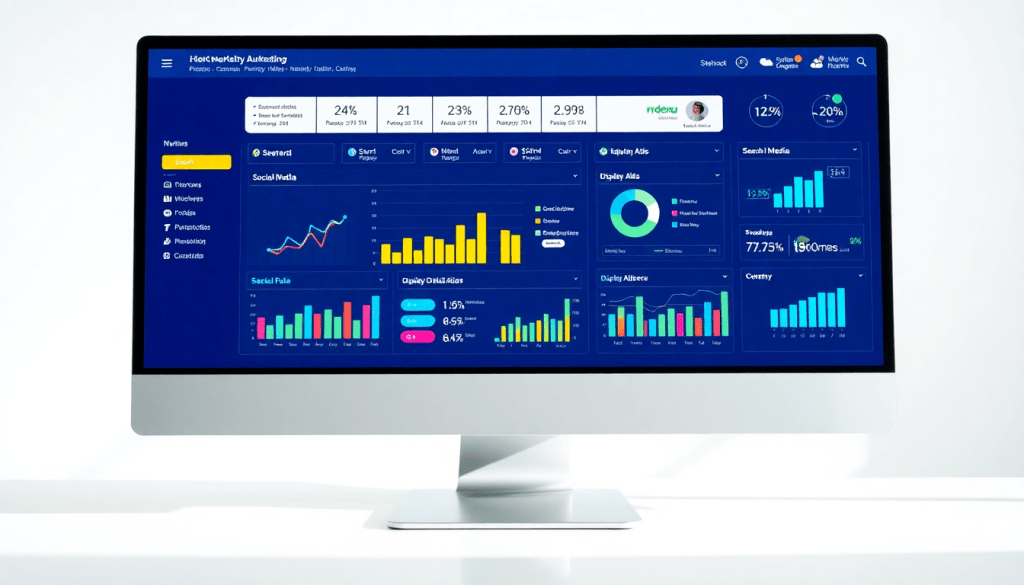
Performance Marketing Reporting Software: Automate Campaign Insights
Performance marketing thrives on real-time data, actionable insights, and the ability to pivot quickly. But as campaigns span more channels and client expectations for transparency grow, manual reporting quickly becomes unsustainable. Performance marketing reporting software automates data collection, centralizes analytics, and delivers custom dashboards—helping teams optimize campaigns and boost ROI with far less friction. This guide explores the essential features, benefits, and best practices for choosing and using a platform that turns your marketing data into a strategic asset.
What Is Performance Marketing Reporting Software?
Performance marketing reporting software transforms how marketers measure, analyze, and communicate campaign results. It automates the collection of real-time data from channels like search, social, display, and programmatic advertising, then distills that information into dashboards and reports that drive smarter decision-making.
Why Use Performance Marketing Reporting Software?
Here’s how these platforms help agencies, brands, and media companies:
- Automation: No more manual spreadsheets or time-consuming data pulls—reporting is streamlined and error-free.
- Centralization: All your channel data (Google Ads, Facebook, programmatic, and more) lives in one place.
- Actionable Insights: Not just raw numbers—platforms surface trends, optimization opportunities, and recommendations.
- Outcome Focus: Keeps the spotlight on measurable results—clicks, conversions, ROAS—so you can prove and improve marketing ROI.
How Is This Different from General Analytics Tools?
Performance marketing reporting software stands apart because it’s built for outcome-obsessed marketers. While traditional analytics tools might focus on web traffic or general brand awareness, performance platforms offer:
- Cross-Channel Attribution: Connect the dots between touchpoints and outcomes.
- Granular Conversion Tracking: Trace every click, lead, or sale back to its source.
- Budget Pacing & Optimization: Stay on top of spend, prevent over/underspending, and maximize returns.
Essential Terms to Know
| Term | What It Means |
|---|---|
| Automated Campaign Reporting | Programmatically collecting and distributing campaign results, eliminating manual work. |
| Performance Analytics Tool | Software that unifies multi-channel data to identify trends and insights for smarter marketing. |
| ROAS Tracking Platform | Tracks the return on every advertising dollar, enabling precise budget allocation. |
| Client Performance Reports | Custom dashboards/summaries for stakeholders—offering transparency and demonstrating marketing value. |
The Big Picture
In the fast-moving world of digital marketing, performance reporting software is your command center.
It turns messy, fragmented data streams into actionable, outcome-focused intelligence. For teams that need to move quickly, prove ROI, and scale, platforms like TapClicks are not just useful—they’re essential.
Key Features: What to Look For
Selecting the right performance marketing reporting software hinges on a robust feature set that not only simplifies campaign management but also amplifies results. Here’s what the best platforms should offer:
1. Cross-Channel Campaign Tracking:
Modern marketers rarely operate in a single channel. Look for software that unifies data from search, social, display, and more into one interface. This provides holistic visibility, making it easy to compare campaign performance and identify winning strategies across platforms.
2. Ad Spend Optimization Dashboards:
To maximize ROI, it’s critical to track spend in real time and spot inefficiencies instantly. The ideal solution visualizes spend versus results, flags overspending, and suggests where to reallocate budgets for greater impact.
3. Conversion Rate Analytics:
Granular conversion insights are at the heart of performance marketing. Choose tools that break down conversion metrics by channel, campaign, and audience segment—so you know precisely what’s driving engagement and revenue.
4. Paid Media Dashboards:
Centralized, customizable paid media dashboards let you monitor KPIs for all your digital advertising in one place. This empowers you to act on data quickly, without toggling between platforms or wrangling spreadsheets.
5. Automated Client Performance Reports:
Client communication should be seamless and insightful. Top software delivers scheduled, white-labeled reports that highlight key outcomes and trends—minimizing manual effort and ensuring clients stay informed.
The Power of Automation
Manual data pulls and spreadsheet work are error-prone and time-consuming. Automation transforms this process, enabling teams to reclaim dozens of hours each month while improving data accuracy and consistency.
For a deeper dive into how these features translate into real-world impact, check out "TapClicks: Powerful Marketing Analytics", which explores how unified reporting, automation, and advanced dashboards can revolutionize your marketing analytics workflow.
Why Centralized Data Integration Matters More Than Ever
Today’s marketing campaigns stretch across search, social, display, video, and beyond—each with its own metrics, attribution models, and reporting dashboards. This fragmentation makes it nearly impossible to get a true view of performance or optimize your marketing spend. The solution? Centralized data integration and cross-channel visibility.
What Does Centralized Data Integration Actually Do?
It’s not just about pulling data into one place. Centralized integration:
- Breaks down channel silos so you can view all campaigns side-by-side
- Normalizes and blends metrics for true apples-to-apples comparisons
- Uncovers trends and attributions that get lost in disconnected spreadsheets
- Empowers faster, smarter decisions by eliminating manual data wrangling
Real-World Impact: From Siloes to Strategy
With all your data in a single platform (like TapClicks), you can:
- Compare ROI across Google Ads, Facebook, programmatic, email, and more
- Spot wasted spend by identifying overlapping audiences or underperforming campaigns
- Connect the dots between social engagement and branded search conversions
- Answer key questions instantly:
- Which channel is truly driving conversions?
- Where are the biggest attribution gaps?
- How do campaigns perform across locations or clients?
How TapClicks Makes Cross-Channel Visibility Effortless
| Feature | Benefit |
|---|---|
| 10,000+ Data Connectors | Connect virtually any marketing, ad, or analytics source |
| Automated ETL/ELT Pipelines | Ingest, normalize, and blend data without manual effort |
| AI-Powered Data Tools | Automate transformation and enrichment for deeper insights |
| Scalable for Multi-Account/Client | Manage thousands of dashboards, clients, or locations |
Learn more about TapClicks' AI-powered data tools.
The Payoff: Smarter, Faster, and More Agile Marketing
When you unify all your channel data:
- Benchmark performance across campaigns and clients with ease
- Spot winning strategies and double down faster
- Pivot quickly as market conditions change, with real-time, unified dashboards
In short, centralized data integration and cross-channel visibility aren’t “nice to have” anymore—they’re essential for performance marketing at scale. With platforms like TapClicks, you’re not just collecting data. You’re unlocking insights that drive results.
Automated Campaign Reporting & Client Performance Reports
Manual campaign reporting is one of the biggest bottlenecks for performance marketing teams and agencies. Pulling data from each channel, customizing visuals, and double-checking metrics for every client can eat up dozens of hours each month—and introduces unnecessary risk of errors. Automated reporting software transforms this process by seamlessly collecting, aggregating, and presenting the latest campaign insights, freeing your team to focus on strategy and optimization rather than spreadsheets.
With automated campaign reporting, you can set up scheduled reports to deliver timely updates to internal stakeholders and clients—daily, weekly, or monthly—without lifting a finger. These platforms often support extensive white-labeling and branding options, so your reports reflect your agency or client’s identity, not a generic template. Customization features allow you to tailor dashboards and reports for each client’s unique goals—whether that’s focusing on ROAS, conversion rates, or specific channel performance.
For agencies managing dozens or hundreds of clients, automation is a game changer: it ensures consistent, professional reports delivered on time, reduces manual data entry, and eliminates repetitive tasks. As highlighted in "Marketing Dashboard Automation for Agencies", automated dashboards can dramatically boost reporting efficiency, allowing teams to scale without increasing overhead.
To create client-ready performance reports with minimal manual work, start by defining key metrics and KPIs that matter most to your stakeholders. Use customizable templates and drag-and-drop widgets to build dashboards once, then automate delivery on your chosen schedule. With the right platform, like TapClicks, you can even grant clients role-based access to real-time dashboards, providing transparency and empowering them to dive into the data at their convenience—no back-and-forth required.
Advanced Analytics: ROAS Tracking & Conversion Rate Insights
In the world of performance marketing, success hinges on your ability to measure and act on what matters most—return on ad spend (ROAS) and conversion rates. A robust ROAS tracking platform doesn’t just crunch numbers; it transforms raw campaign data into clear, actionable insights that drive smarter budget allocation and continuous campaign optimization.
ROAS tracking is essential because it quantifies the effectiveness of every advertising dollar. Real-time ROAS analytics reveal which channels, creatives, and audience segments are delivering the highest returns, empowering marketers to double down on what works and quickly pivot away from underperforming tactics. When these insights are surfaced automatically, you can make proactive decisions—reallocating spend to top-performing campaigns, pausing wasteful ads, or testing new strategies with confidence.
Similarly, conversion rate analytics provide instant visibility into how well your campaigns are turning clicks into results, whether that’s purchases, sign-ups, or other key actions. With advanced performance marketing reporting software, you gain access to granular breakdowns by channel, device, audience, and even creative variant. Automated alerts and AI-driven recommendations flag areas where conversion rates are slipping, so you can troubleshoot landing pages, adjust targeting, or tweak ad messaging before minor issues impact your ROI at scale.
For example, leading platforms like TapClicks combine automated data integration with powerful analytics tools to surface insights such as:
- Underperforming channels that are draining budget without adequate return
- High-ROAS audiences or geographies that should receive more spend
- Conversion funnel drop-offs that indicate friction in the user journey
- Predictive pacing alerts to ensure you’re on track with revenue and lead goals
By leveraging these advanced analytics capabilities, performance marketers move beyond static reporting. Instead, they create a dynamic feedback loop—where every campaign insight is an opportunity to optimize, innovate, and outperform the competition.
Ad Spend Optimization & Budget Pacing Dashboards
Maximizing ROI in performance marketing requires more than just tracking spend—it demands real-time visibility into how budget allocations impact results across every channel. This is where ad spend optimization dashboards become indispensable. These dashboards consolidate spend data from search, social, display, and other paid media campaigns, giving marketers a unified view of where every dollar is going and, crucially, how those dollars are performing.
Modern performance marketing reporting software, such as TapClicks, offers advanced budget pacing tools that automate the once-tedious process of monitoring spend against goals. With customizable pacing dashboards, marketing teams can set daily, weekly, or monthly budget targets and instantly see whether campaigns are over- or under-spending. Automated alerts and anomaly detection flag spend spikes or under-delivery as soon as they occur—empowering teams to take corrective action before they impact campaign effectiveness or client satisfaction.
Predictive analytics take this a step further, helping marketers forecast end-of-period spend and performance based on real-time trends. These models can recommend budget reallocations across channels or campaigns to maximize conversions or ROAS (Return on Ad Spend). For example, if a dashboard reveals that paid social is outperforming search in real-time, teams can shift budget mid-flight, all from within a single interface.
The true power of these visual dashboards lies in their accessibility. With intuitive graphs, pacing bars, and drill-down capabilities, even non-technical stakeholders can quickly grasp spend patterns and performance trends. This transparency accelerates decision-making, fosters trust with clients, and ensures that every marketing dollar is working as hard as possible. By leveraging ad spend optimization and budget pacing dashboards, agencies and brands move from reactive reporting to proactive management—turning insights into action, and action into sustained growth.
Choosing the Right Performance Analytics Tool
When selecting a performance marketing reporting platform, finding the right fit is crucial for both immediate efficiency and long-term growth. Here’s a practical checklist to guide your evaluation:
1. Scalability:
Does the software handle your current campaign volume and client base—and will it grow with you? For agencies or brands managing hundreds of accounts or locations, platforms like TapClicks are designed for high-volume, multi-client operations, ensuring you won’t outgrow your solution.
2. Integrations:
A modern performance analytics tool should offer extensive data integrations, not just a handful of connectors. Look for platforms that unify all your marketing and advertising data sources—search, social, display, CRM, ecommerce, and more—into a single dashboard. This reduces manual data wrangling and ensures holistic insights.
3. Ease of Use:
An intuitive interface, drag-and-drop dashboard builders, and guided setup make it easy for both technical and non-technical users to access and share insights. Consider how quickly your team can adapt to the platform, as well as the learning curve for clients.
4. Reporting Flexibility:
Customizable, white-labeled reports are a must for agencies and brands seeking to present data in their own style. Automated scheduling, branded templates, and granular user permissions make it easy to deliver the right data to the right stakeholders—without repetitive manual work.
5. Support & Training:
Responsive customer support, onboarding resources, and ongoing training help maximize your investment. Check for robust knowledge bases, dedicated account managers, or community forums to ensure continued success.
All-in-One vs. Point Solutions:
While point tools (like single-channel reporting apps) may solve specific problems, they often require manual stitching of data and fragmented workflows. All-in-one platforms, such as TapClicks, bring together data integration, analytics, reporting, and workflow automation in one unified hub. This reduces complexity, minimizes errors, and saves significant time—especially for teams managing multi-channel campaigns or numerous clients.
Aligning Capabilities with Your Needs:
- Agencies benefit from role-based access, workflow automation, and client-ready reporting at scale.
- Brands with multiple locations or business units need consolidated analytics and budget oversight across regions, products, or teams.
- Enterprises often require seamless data exports to BI tools or finance systems, plus advanced features like AI-powered insights and predictive modeling.
Ultimately, the right performance marketing reporting software should match your business model, reporting requirements, and growth ambitions—setting the foundation for smarter, faster, and more impactful marketing decisions.
Kick-Start Your Performance Marketing Automation: Steps for Success
Adopting performance marketing reporting software is a smart way to boost efficiency and results—but the real magic happens when you roll it out the right way. Here’s a practical roadmap to help your team unlock maximum value from day one.
1. Map Your Marketing Data Landscape
- List every channel and platform: Think Google Ads, Facebook, programmatic, social, email, web analytics, CRMs, and more.
- Prioritize integration: Use your reporting tool’s connectors to unify all sources into a single platform.
- Eliminate data silos: Platforms like TapClicks enable you to blend paid, owned, and earned data for a true 360° view.
2. Build Dashboards That Matter—Fast
- Identify key KPIs: Focus on what drives business and client value (ROAS, conversions, CPL, budget pacing, etc.).
- Leverage templates and drag-and-drop tools: Get branded dashboards live with minimal effort.
- Automate updates: Ensure your dashboards refresh in real time or on a chosen schedule.
- Pro tip: Check out this guide to marketing dashboard automation for workflow shortcuts.
3. Automate Reporting and Scheduling
- Set up recurring reports: Schedule delivery to internal teams and clients—daily, weekly, or monthly.
- White-label everything: Branded templates reinforce your agency or brand identity.
- Reduce manual work: Let automated workflows handle the heavy lifting.
4. Make Training Relatable and Actionable
- Tailor sessions by user role: Analysts, account managers, and clients each need different insights.
- Create quick guides or video walk-throughs: These boost confidence and adoption.
- Focus on interpretation, not just button-clicking: Teach teams how to turn data into action.
5. Iterate Based on Real Feedback
- Collect user input: Encourage teams and clients to share what works—and what doesn’t.
- Refine and expand: Update dashboards, add sources, or tweak reporting cadence as needs evolve.
- Stay agile: The best automation grows with your business.
6. Explore Before You Commit
- Take advantage of free trials or demos: Evaluate features and integrations with your live data.
- Assess usability and support: Make sure the platform fits your workflows and team skillsets.
Quick Checklist: Have You Covered the Essentials?
| Step | Have You Done This? |
|---|---|
| Data sources integrated | ⬜️ |
| Custom dashboards built | ⬜️ |
| Automated reports set up | ⬜️ |
| Team/client training done | ⬜️ |
| User feedback gathered | ⬜️ |
| Free trial/demo completed | ⬜️ |
By following these steps, you’ll accelerate onboarding, minimize missteps, and ensure your performance marketing reporting foundation is ready for scale, accuracy, and actionable insight—right from the start.
Start Automating Your Marketing Data Today!
No Credit Card Required.

