

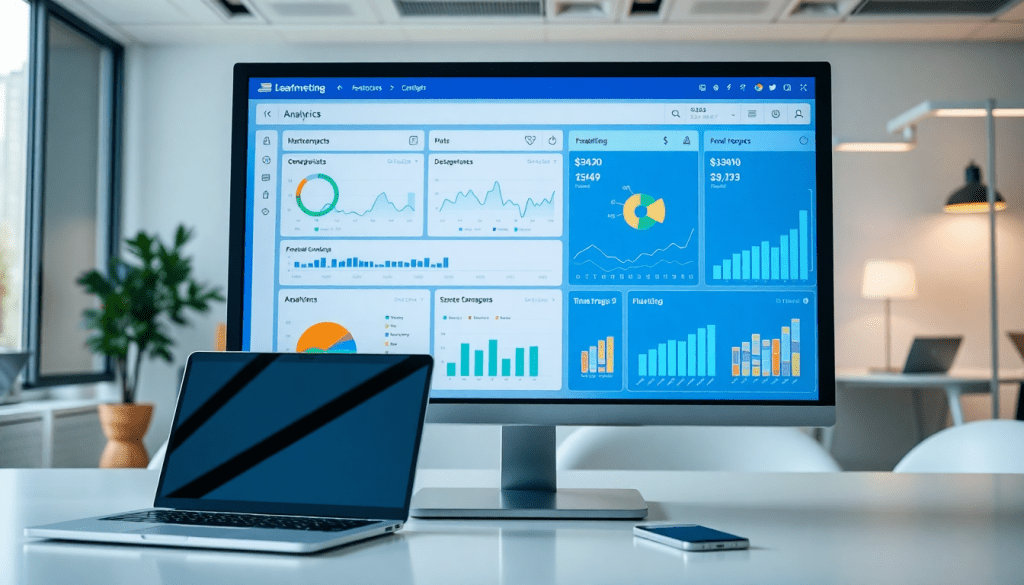
Performance Marketing Reporting Software: Automate Campaign Insights
Performance marketing reporting software empowers marketers and agencies to automatically capture, analyze, and act on campaign data across every paid channel. Instead of wrestling with spreadsheets and manual updates, these tools streamline reporting, reveal deep insights, and drive better results through real-time analytics and automation. This guide explores the essential features, benefits, and selection criteria for the best performance marketing reporting platforms—so you can unlock more value from every marketing dollar and deliver client-ready reports with confidence.
Why Performance Marketing Reporting Software Matters
Modern marketers face a daunting reality: campaign data sprawls across countless platforms, channels, and formats. Attempting to consolidate and report on this information manually is not only time-consuming but also error-prone. Copy-pasting metrics between spreadsheets, reconciling numbers between ad networks, and building custom presentations for stakeholders can consume hours—or even days—every week. This manual approach leaves teams at risk for missed insights, delayed reactions, and reporting inconsistencies that undermine trust and campaign performance.
Automation is now essential for success in digital advertising. Performance marketing reporting software eliminates the heavy lifting by integrating with all major ad platforms, aggregating data in real time, and delivering a unified view of campaign performance. This automation ensures marketers always have the latest metrics at their fingertips, enabling them to pivot quickly, seize new opportunities, and address issues before they escalate.
Real-time data and cross-channel visibility are no longer luxuries—they’re requirements. With dozens of channels contributing to the customer journey, marketers need a holistic view to understand what’s working and where budgets can be optimized. Automated reporting platforms surface actionable insights, benchmark performance, and highlight areas for improvement—empowering teams to make data-driven decisions that maximize return on ad spend.
To see how marketing dashboard automation transforms reporting and elevates campaign analysis, explore "How Marketing Dashboard Automation Boosts Reporting with TapClicks". Automated solutions like TapClicks not only reduce reporting workloads but also unlock the strategic insights needed to drive better results in an increasingly complex digital landscape.
What Sets Great Performance Marketing Reporting Platforms Apart
Choosing high-impact reporting software isn’t just about “pulling data.” The best platforms transform how marketers and agencies operate—saving time, surfacing insights, and optimizing campaigns in real time. Here’s how:
Why Automated Reporting Is the Foundation
Manual reporting is out; automation is in. Top platforms empower marketers to:
- Aggregate data from every paid channel (Google Ads, Facebook, LinkedIn, programmatic, and more)
- Visualize campaign performance instantly—no spreadsheet gymnastics required
- Track every campaign touchpoint in real time, not just at weekly or monthly intervals
Key Metrics Go Beyond the Basics
A robust analytics solution should provide more than just impressions and clicks. Look for features like:
| Metric Type | Why It Matters |
|---|---|
| Click-through rates | Measure audience engagement |
| Impressions | Track channel reach and scale |
| Conversion analytics | Reveal what actually drives business |
| ROAS tracking | Directly tie ad spend to revenue |
Customizable, Always-On Dashboards
Not all dashboards are created equal. The right solution lets you:
- Tailor views to your KPIs—whether you oversee a single brand or hundreds of clients
- Update dashboards live, so everyone (internal teams and clients) sees the freshest data
- Empower decision-makers with clear, intuitive interfaces
Set It and Forget It: Automated, Branded Reports
No more last-minute data scrambles.
- Schedule branded, client-ready reports to send automatically (daily, weekly, or monthly)
- Ensure consistency and reliability—reports always go out on time
Unified, Cross-Channel Visibility
A modern reporting platform should:
- Normalize data across all platforms (social, search, display, programmatic, etc.)
- Enable holistic optimization—see what’s working (and what’s not) across every channel, not just in isolation
Optimize Your Budget, Maximize ROI
Look for features like:
- ROAS dashboards—understand the true impact of every advertising dollar
- Ad spend optimization tools—quickly spot where budgets can deliver better returns
- Automated alerts and predictive insights—stay ahead of the curve with proactive recommendations
Why TapClicks?
TapClicks brings all these capabilities together in one unified marketing operations platform:
- No more juggling point solutions or siloed data
- Scale to thousands of dashboards and reports—effortlessly
- Pair smart automation with actionable insights
The result? Marketers and agencies can deliver smarter, faster, and more actionable reporting—driving better outcomes for their business or clients. See how TapClicks works.
Benefits of Automated Campaign Reporting
Automated campaign reporting is a game-changer for marketing teams and agencies seeking to maximize efficiency and accuracy in their performance marketing efforts. By eliminating the manual process of gathering and formatting data from disparate sources, automation frees up significant time—often saving analysts 50+ hours per month—while dramatically reducing the risk of human error. This means your team spends less time troubleshooting spreadsheets or double-checking numbers and more time focused on strategy, optimization, and client communication.
Beyond time savings, automated reporting fosters greater team efficiency. Scheduled, always-on reports ensure that every stakeholder, from account managers to executives, has access to the latest campaign insights without delay. This continuous access to up-to-date, actionable data not only informs smarter decision-making but also enhances client satisfaction; clients receive timely, professional, and easily digestible reports that build trust and demonstrate your agency’s value.
Perhaps most importantly, automated reporting platforms ensure that your digital advertising insights are never stale. Real-time data pipelines and automated visualizations mean you can quickly identify trends, spot anomalies, and act on opportunities as they emerge—giving you a competitive edge in today’s fast-paced marketing landscape. For a deeper dive into the transformative impact of automation on agency reporting, check out "How Marketing Dashboard Automation Boosts Agency Reporting Fast".
Automation in campaign reporting isn’t just about doing things faster—it’s about doing them better. With the right tools in place, marketing teams deliver more value, scale their efforts seamlessly, and consistently exceed client expectations.
Going Beyond Vanity Metrics: Conversion Rate & ROAS That Drive Real Results
Conversion rate and ROAS aren’t just buzzwords—they’re the heartbeat of performance marketing. Let’s break down how you can track, visualize, and act on these metrics to maximize every dollar and click.
What Are Conversion Rate & ROAS—And Why Should You Care?
-
Conversion Rate:
Measures how many ad clicks lead to meaningful outcomes (purchases, sign-ups, downloads, etc.).- Why it matters: A high conversion rate means your targeting, creative, and landing page are working together.
-
ROAS (Return on Ad Spend):
Shows how much revenue you earn for every dollar spent on ads.- Why it matters: It’s your direct line to campaign profitability—are your ads making money or draining your budget?
Without clear visibility:
You risk wasting spend on low performers or missing out on channels that could scale your results.
How to Visualize Conversion Rate & ROAS Without the Headaches
Modern marketing analytics platforms like TapClicks bring everything together in one place—no more spreadsheet juggling or multi-tab headaches.
Here’s what you can see, at a glance:
| What You Can Visualize | Why It’s Useful |
|---|---|
| Conversion rates by channel | Spot which platforms drive true action |
| ROAS by audience/geography | Find your most profitable segments |
| Trends over time | See if optimizations are working |
| Benchmarks vs. current results | Know if you’re above or below the curve |
Bonus:
Automated dashboards and scheduled reports mean you never miss a sudden dip or spike—TapClicks can even send instant alerts when KPIs change dramatically.
From Data to Decisions: Turning Analytics Into Action
Here’s how to make your analytics work for you:
-
Segment, Segment, Segment:
Break down results by device, creative, audience, and landing page. Find the hidden gems and bottlenecks. -
Track Trends, Not Just Today:
Monitor performance over time to spot the impact of changes—like a new ad creative or updated landing page. -
Benchmark Everything:
Compare against your own history and industry averages to get real context. -
Set Up Smart Alerts:
Use automated notifications for sudden shifts—so you can pivot before small issues become big losses. -
Share & Collaborate:
Visual dashboards make it easy for teams and clients to align, celebrate wins, and solve challenges—together.
The Takeaway
Smart, automated tracking of conversion rate and ROAS gives you a built-in feedback loop:
- Optimize spend in real time
- Double down on what works
- Fix what doesn’t—before it eats your budget
Ready to streamline your analytics? TapClicks has you covered—bringing data, insights, and workflows together so you can focus on growth, not reporting.
Cross-Channel Campaign Tracking and Visualization
Modern marketers face a persistent challenge: channel data is often siloed across disparate ad platforms, making it nearly impossible to get a unified, actionable view of campaign performance. When Facebook, Google Ads, LinkedIn, programmatic, and other channels each live in their own reporting universe, teams are forced to manually compile spreadsheets, guess at attribution, and risk missing big-picture insights. This fragmentation not only slows down optimization but also makes it harder to demonstrate value to clients or stakeholders.
Performance marketing reporting software solves this by integrating campaign data from every channel—search, social, display, video, and beyond—into a single, cohesive paid media dashboard. With automated data connectors and robust ETL pipelines, platforms like TapClicks pull in metrics from thousands of sources, normalize them, and visualize performance side-by-side. This unified reporting approach eliminates the need for manual data wrangling, letting marketers instantly compare channel effectiveness and spot trends that would otherwise be hidden.
Consider a scenario: An agency manages multi-location campaigns for a retail brand, running ads on Facebook, Google, TikTok, and programmatic DSPs. Without unified reporting, the team would juggle logins, export CSVs, and spend hours blending data for each client location. With cross-channel campaign tracking, all performance data flows into one dashboard. The team can easily compare ROAS by channel, visualize spend pacing, and identify which creative or audience segments are outperforming across platforms. They can then drill down by location, time period, or campaign type—making optimizations and reporting not only faster, but far more insightful.
Unified, cross-channel visualization empowers both agencies and brands to make smarter, faster decisions—maximizing ROI and keeping clients delighted with clear, comprehensive insights.
Delivering Client Performance Reports That Impress
Client reporting should do more than just deliver numbers—it should tell the story behind campaign results, inspire confidence, and spark productive conversations.
What Makes a Client Report Stand Out?
-
Storytelling, Not Just Stats:
Go beyond data dumps. Use visualizations and narrative to explain what the results mean and why they matter. -
Customization:
Tailor dashboards and reports to each client’s unique goals and KPIs—no one-size-fits-all summaries. -
Clarity & Simplicity:
Minimize jargon. Highlight top metrics (like KPIs, conversion rates, and ROAS) using clear, uncluttered layouts. -
Branding:
Ensure every report reflects your agency’s or the client’s brand—with custom logos, colors, and messaging.
How to Build Impressive Client Reports (Checklist)
-
Start with the Audience:
Identify what matters most to your client—brand awareness, leads, sales, or something else. -
Choose the Right Template:
Use customizable templates to keep reports consistent but flexible. -
Automate the Mundane:
Set up recurring, scheduled reports to pull the latest data automatically. -
Visualize Success:
Incorporate charts, graphs, and callouts to make insights pop. -
Deliver with Polish:
White-label your reports for a professional, agency-branded touch.
Scaling Client Reporting with TapClicks
Manual reporting just doesn’t scale when you’re managing dozens—or even thousands—of clients. Here’s how TapClicks makes reporting effortless:
| TapClicks Feature | How It Helps Your Agency |
|---|---|
| Automated Data Pulls | Always up-to-date with the latest cross-channel performance. |
| Drag-and-Drop Dashboards | Quickly assemble client-ready views with zero coding. |
| Scheduled Reporting | Set it and forget it—clients receive fresh insights on time, every time. |
| Role-Based Access | Give clients secure, self-serve visibility into their own data. |
| White-Labeling | Brand every dashboard and report as your own. |
| SmartEmail | AI-curated, plain-English summaries delivered to stakeholders’ inboxes. |
Why It Matters
By embracing automation and customization with TapClicks, agencies and brands can:
- Drastically cut manual reporting time
- Deliver consistently polished, branded experiences
- Free up teams to focus on strategic insights and client growth
The result?
Clients get more value from every report—and you get more time to deliver on what matters most.
How to Choose the Right Performance Marketing Reporting Tool
Selecting the ideal performance marketing reporting software is a pivotal decision that can shape your team’s efficiency, client satisfaction, and campaign outcomes. To find the platform that fits your needs, start with these critical criteria:
1. Integrations & Data Coverage
A top-tier reporting tool should offer seamless integrations with all your key ad channels, analytics platforms, and CRM systems. Look for solutions that provide a robust library of pre-built connectors, as well as options for custom integrations, to ensure all your marketing data flows into a single source of truth without manual intervention.
2. Scalability & Workflow Support
Whether you’re an agency managing hundreds of client accounts or an in-house team overseeing multi-location campaigns, scalability is essential. Assess whether the platform can handle your current—and future—reporting volume. Features like automated report scheduling, role-based access, and workflow automation are must-haves for teams that need to grow efficiently.
3. Automation Features
Evaluate the depth of automation. The best platforms go beyond basic data pulls; they offer scheduled reporting, automated insights, anomaly detection, and even AI-powered recommendations. These features not only save hours of manual work but also help surface actionable opportunities that drive performance.
4. User Experience & Customization
A user-friendly interface that supports drag-and-drop dashboard creation and branded report templates can dramatically reduce onboarding and training time. Consider whether the software allows for custom metrics, flexible visualization options, and tailored client portals, so every report aligns with your business and client needs.
5. Agency vs. In-House Capabilities
Agencies often need multi-client management, white-labeling, and granular access controls, while in-house teams may prioritize deep analytics, budgeting, and integration with business intelligence tools. Make sure the platform you choose aligns with your operational structure and reporting priorities.
Key Questions to Ask Vendors:
- What marketing and advertising integrations are supported out-of-the-box?
- How does your platform handle data normalization across channels?
- Can reports be fully automated and scheduled for clients or internal teams?
- What options exist for branding and customizing dashboards?
- How do you support user roles and permissions for collaboration?
- How quickly can new channels or data sources be added?
For a comprehensive overview of how automation enhances analytics and reporting, check out "How Marketing Dashboard Automation Boosts Analytics & Reporting".
Choosing the right performance marketing reporting software is about more than features—it's about finding a solution that empowers your team to deliver insights at scale, adapt to new channels, and continually optimize for better results. For more details on unified marketing operations and scalable reporting, visit TapClicks.
Next Steps: Getting Started with Automated Campaign Insights
Performance marketing reporting software is no longer a luxury—it's a necessity for agencies and brands that want to optimize ad spend, deliver outstanding client service, and drive measurable results from every campaign. By automating the capture, analysis, and visualization of campaign data, you free your team from manual reporting, reduce costly errors, and gain the real-time insights needed to make smarter marketing decisions.
Ready to take the next step? Here’s a simple action plan to kick off your journey:
-
Assess Your Current Reporting Process:
Map your existing workflows. Where are the bottlenecks? What manual tasks eat up valuable time? Identify the channels and metrics you need unified in your reports. -
Define Must-Have Features:
List out what capabilities matter most: omnichannel integration, customizable dashboards, automated report scheduling, ROAS and conversion tracking, and client-facing customization. -
Evaluate Vendors Against Your Needs:
Compare platforms based on scalability, integration breadth, automation power, and ease of use. Don’t forget to check for advanced analytics and AI-driven insights to future-proof your stack. -
Request Demos and Trials:
See the tools in action. Bring your own campaign data where possible, so you can judge the depth of automation, reporting speed, and visualization quality. -
Plan Your Rollout:
Outline how you’ll migrate data, onboard your team, and introduce clients to new report formats. Set milestones to measure time and resource savings. -
Iterate and Optimize:
Gather feedback from internal users and clients. Refine dashboards, experiment with new automations, and track the impact on efficiency and campaign performance.
If you're looking for a robust, scalable solution to unify your marketing data, automate campaign reporting, and deliver actionable insights, TapClicks is designed to help you streamline every step. With 10,000+ integrations, powerful AI insights, and customizable client reporting, TapClicks empowers agencies and brands to operate at scale—so you can focus on strategy, not spreadsheets.
Ready to unlock automated campaign insights and maximize your marketing impact? Explore how TapClicks can transform your reporting workflow today!
Start Automating Your Marketing Data Today!
No Credit Card Required.

