

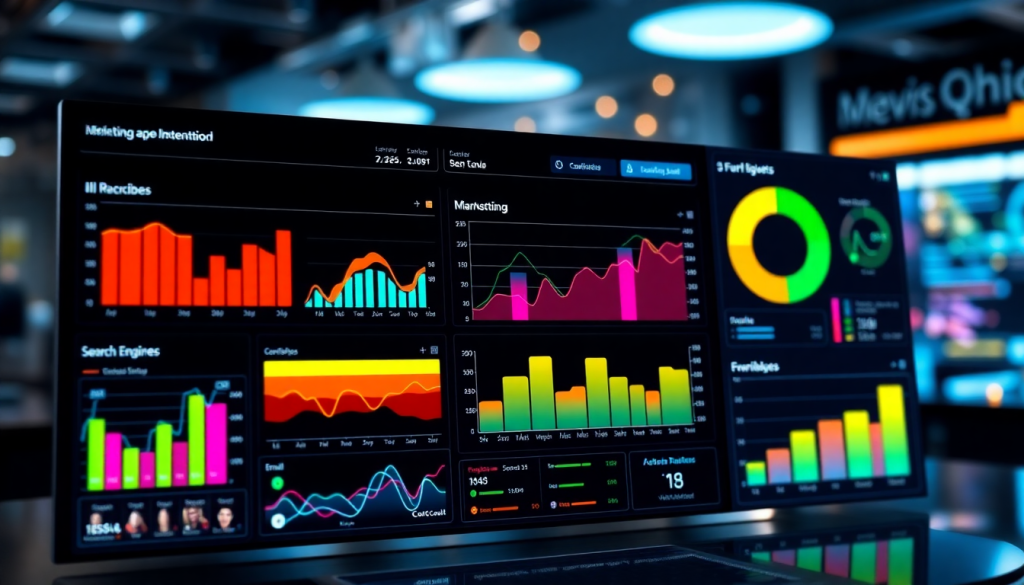
Multi-Channel Analytics Dashboard: Unify Your Marketing Insights
Modern marketing teams juggle campaigns across countless digital channels, platforms, and formats. Without the right analytics framework, it’s easy for performance data to become siloed—making it tough to see what’s working, where budgets are wasted, and how to optimize for better ROI. A multi-channel analytics dashboard acts as the nerve center of your marketing operation, unifying campaign data from every touchpoint into a single, actionable view. Here’s how a unified reporting platform like the TapClicks analytics dashboard empowers you to turn complex, multi-platform data into clear, automated insights and measurable results.
What Is a Multi-Channel Analytics Dashboard?
A multi-channel analytics dashboard brings together all your marketing data—across every channel—into one centralized, visual workspace. Instead of toggling between reports from Google Ads, Facebook, email, and more, you get a unified view that reveals how your campaigns actually work together.
Why Multi-Channel Dashboards Matter
- Break Down Data Silos: Connect the dots between all your digital (and even offline) channels.
- See the Full Picture: Visualize exactly where your marketing is winning, lagging, or overlapping.
- Empower Faster Decisions: Spot trends and outliers instantly, and pivot campaigns in real time.
- Save Time on Reporting: Automate manual data pulls, aggregation, and report delivery.
What Sets a Great Multi-Channel Dashboard Apart?
Look for these core capabilities:
| Feature | What It Means for You |
|---|---|
| Cross-Channel Analytics | Side-by-side channel performance, all in one view |
| Campaign Visualization | Intuitive charts, graphs, and widgets for KPIs |
| Data Aggregation | Combine ad, CRM, web, and offline data seamlessly |
| Unified Reporting | Automated, scheduled, and customizable reports |
Pro Tip: It’s not just about collecting data. The best dashboards transform raw numbers into actionable insights—benchmarking performance and powering smarter decisions.
TapClicks: The Gold Standard for Multi-Channel Analytics
One standout example is the TapClicks analytics dashboard, built for agencies, brands, and enterprise teams. Here’s what makes TapClicks different:
- 10,000+ Connectors: Seamlessly pull data from virtually any platform.
- Drag-and-Drop Customization: Build dashboards and reports in minutes—no coding required.
- Automated Reporting: Schedule and deliver reports to stakeholders, hands-free.
- AI-Powered Insights: Move beyond charts to get campaign scoring and optimization recommendations.
The result? You move from fragmented, channel-specific reports to a “single source of marketing truth”—fueling better strategy, stronger collaboration, and measurable ROI.
The Business Case for Unified Reporting
For today’s agencies, brands, and enterprise marketing teams, unified reporting isn’t just a nice-to-have—it’s mission-critical. The proliferation of digital channels, ad platforms, and data sources has made marketing more measurable than ever, but that very complexity often leads to fragmented reporting, operational headaches, and missed opportunities.
Fragmented Data: A Costly Challenge
When campaign data lives in silos—Google Ads over here, Facebook results over there, web analytics in a separate tab—teams waste countless hours on manual data gathering, spreadsheet wrangling, and reconciling disparate metrics. This inefficiency not only eats up valuable analyst time, but it also introduces the risk of human error and inconsistent measurement across campaigns and clients.
Beyond the operational drain, fragmented data means marketing leaders lack a holistic view of performance. Without unified dashboards, it’s tough to answer foundational questions: Which channels are truly driving conversions? Where are budgets being under- or over-invested? Are campaigns supporting business goals, or just vanity metrics? Disconnected platforms make it easy for critical insights to slip through the cracks.
Unified Dashboards: Turning Complexity into Clarity
A multi-channel analytics dashboard transforms this chaos into actionable intelligence. By consolidating campaign data from every source into a central hub, unified reporting platforms like the TapClicks analytics dashboard enable marketers to see integrated marketing metrics at a glance—across channels, clients, and locations.
With unified reporting, teams can:
- Track true ROI: Compare performance across platforms, channels, and campaigns, not just within silos.
- Drive smarter decisions: Spot cross-channel trends, quickly identify what’s working, and pivot strategies in real time.
- Simplify workflows: Eliminate manual reporting and automate recurring reports, freeing up analysts for higher-value work.
- Deliver consistency: Standardize KPIs and measurement frameworks so that every stakeholder—from CMO to client—sees the same story.
Ultimately, a unified reporting platform is the foundation for data-driven growth. It empowers marketers to move faster, optimize budgets more effectively, and deliver transparent, impactful results—whether they’re managing a hundred client accounts or orchestrating omnichannel campaigns for a global brand.
How Cross-Channel Marketing Analytics Drive Smarter Decisions
The real magic of a multi-channel analytics dashboard lies in its ability to transform disconnected marketing data into powerful, actionable insights. Cross-channel marketing analytics enable teams to see the full customer journey, revealing how different touchpoints—search, social, display, email, and beyond—work together to drive results. This holistic perspective is crucial for making smarter, more strategic decisions.
By aggregating campaign data across all platforms, cross-channel analytics illuminate performance trends that would otherwise go unnoticed in siloed reports. For example, a spike in conversions on your website might correlate with a specific social campaign, even if the final attribution goes to paid search. With advanced campaign performance visualization, marketers can spot these patterns, identify which channels are contributing most to conversions, and optimize spend accordingly.
Omnichannel analytics solutions like the TapClicks dashboard take this a step further by automating key insights and recommendations. Instead of manually sifting through spreadsheets or toggling between platforms, TapClicks’ automated marketing insights surface the metrics that matter most—whether it’s pinpointing underperforming ad sets, highlighting the most cost-effective channels, or revealing budget pacing issues before they impact ROI. This level of actionable intelligence allows agencies and brands alike to reallocate budgets in real time, maximize campaign impact, and improve overall marketing efficiency.
To see how TapClicks automates analytics and delivers actionable insights, check out this in-depth article on boosting analytics and reporting. By leveraging cross-channel marketing analytics, teams can move beyond basic reporting and unlock the strategic value of unified, data-driven decision-making.
What Makes a Great Multi-Channel Dashboard?
Choosing the right multi-channel analytics dashboard can be the difference between scattered data and clear, actionable insight. Here’s what to look for to ensure your dashboard isn’t just a data repository—but a true driver of marketing performance.
Stay Current: Real-Time Data Aggregation
- Unified feeds: Instantly pull in data from all channels (search, social, email, programmatic, etc.)
- No delays: Eliminate manual updates—respond to campaign shifts as they happen
Save Time: Automated Reporting
- Scheduled delivery: Set up recurring, branded reports for teams or clients
- Custom templates: Personalize what’s shared, from high-level summaries to deep-dive analytics
- Consistency: Minimize errors and manual effort
The Right View for Every Role
- Role-based dashboards: Give execs, account managers, and analysts the KPIs that matter to them
- Access controls: Protect sensitive data while empowering each team member
- Personalized experiences: Let users focus on what drives their day-to-day decisions
Tell the Story: Customizable Visualizations
- Drag-and-drop widgets: Easily build and adapt dashboards
- Dynamic charts: Visualize trends across channels, campaigns, or timeframes
- Branded layouts: Ensure professional, client-ready presentations
See the Full Picture: Integrated Marketing Metrics
| Metric Type | Examples | Why It Matters |
|---|---|---|
| Volume | Impressions, Clicks | Gauge reach and engagement |
| Efficiency | CPA, CPC, CPM | Optimize spend and performance |
| Outcomes | Conversions, ROI | Tie efforts to results |
- Cross-channel analysis: View all metrics—side by side—for true attribution and budget planning
Monitor What Matters: Performance & ROI Dashboards
- Centralized performance tracking: Spot underperforming channels or high-flyers instantly
- ROI dashboards: Tie every dollar spent to outcomes for smarter budget conversations
Checklist: Is Your Dashboard Ready for Scale?
- Real-time, multi-channel data aggregation
- Automated, scheduled reporting
- Role-based access and dashboards
- Fully customizable and branded visuals
- Integrated, cross-channel marketing metrics
- Centralized performance and ROI tracking
Looking for a platform that brings it all together? TapClicks is purpose-built for agencies, media companies, and brands who need unified data, automated reporting, and scalable insight—all in one place. Move from disconnected data to actionable strategy, without the headaches.
TapClicks Analytics Dashboard: Unified, Automated, Actionable
Finding clarity in a sea of marketing data can be overwhelming—especially for agencies, media companies, and enterprise teams managing dozens (or thousands) of campaigns and clients. TapClicks stands out by combining massive scale, automation, and actionable insights in one unified platform.
Why TapClicks? It’s Built for Complex, High-Volume Marketing Teams
Here’s what sets the TapClicks analytics dashboard apart:
Effortless Data Integration—At Any Scale
- 10,000+ Native Connectors: Instantly pull in data from Google, Meta, programmatic platforms, offline media, CRMs, and more.
- Automated ETL/ELT Pipeline: No manual updates or exports. TapClicks extracts, transforms, and loads your data automatically—across all your channels, clients, and locations.
- Always Up-to-Date: Your dashboards reflect the latest, normalized data, ready for analysis.
AI That Does More Than Visualize—It Guides
- AI Agents: Proactively surface trends, anomalies, and optimization opportunities.
- SmartEmail: Automatically generates and delivers insight summaries straight to your team or client’s inbox—no manual deep dives needed.
- Real-Time Alerts: Keep stakeholders in the loop and empower fast, data-driven decisions.
Campaign Management Meets Analytics
- TapOrders & TapWorkflow:
- Centralized order management for campaign execution.
- Role-based client access.
- Seamless collaboration between sales, ops, and fulfillment teams.
- End-to-End Alignment: Go from campaign launch to performance review—all within one platform.
Reporting That Scales With You
- Drag-and-Drop Studio: Build interactive dashboards and branded reports—no IT required.
- Custom Visualizations: Tailor analytics to your strategy, clients, and stakeholders.
- Automated Scheduling: Deliver hundreds (or thousands) of reports with zero manual effort.
- Data Hub Flexibility: Use TapClicks as your single source of truth or pipe clean data to BI tools like Tableau or Power BI.
TapClicks in Action: What’s Possible?
| Feature | What It Means for You |
|---|---|
| 10,000+ Connectors | Unified, multi-channel reporting |
| AI Insights & SmartEmail | Automated, actionable recommendations |
| Centralized Workflow | Streamlined campaign management and handoffs |
| Custom, Branded Reporting | Scalable, client-ready analytics |
| BI Tool Integration | Flexible data sharing across your tech stack |
Ready to See More?
- Dive deeper into how TapClicks automates analytics and reporting for agencies and enterprise marketers in this article.
- Or, visit the TapClicks website for a closer look at our analytics solutions.
If your organization needs to unify, automate, and act on marketing data at scale, TapClicks is the all-in-one platform built for modern marketing operations.
Real-World Use Cases: Turning Data Overload Into Actionable Insights
Modern marketing teams face a common enemy: data chaos. Disconnected platforms, fragmented reporting, and endless spreadsheets can grind progress to a halt. Here’s how different organizations use unified analytics dashboards—like TapClicks—to cut through the noise and focus on what matters.
For Agencies: Streamlining Client Reporting
The Challenge:
- 150+ clients, each running campaigns on Google Ads, Facebook, LinkedIn, and programmatic channels
- Account managers logging into multiple platforms, downloading CSVs, and manually creating PowerPoint reports every month
With a Unified Dashboard:
- All campaign data (impressions, clicks, conversions) auto-flows into branded, role-based dashboards
- Reporting time drops from days to hours
- Analysts shift from spreadsheet wrangling to campaign optimization and client strategy
For Multi-Location Brands: Seeing the Whole Picture
The Challenge:
- 60+ retail locations, each with local and global campaigns
- Difficulty tracking performance across search, display, local social, and in-store promotions
With a Centralized Dashboard:
- Instantly compare regional performance
- Spot underperforming or underfunded locations
- Reallocate budget in real time—all within a single, easy-to-read view
For Enterprises: Blending Online and Offline Performance
The Challenge:
- Siloed digital (web, email) and offline (store, call center) data
- No unified way to measure the full customer journey or true marketing ROI
With TapClicks:
- Connect CRM, paid media, and physical store data
- Visualize the complete funnel from first click to final purchase
- Make smarter decisions with a holistic view of marketing impact
TapClicks in Action: A Quick Success Story
| Before TapClicks | After TapClicks Implementation |
|---|---|
| 200+ clients, manual data pulls | 10,000+ connectors, fully automated workflows |
| Analysts buried in reporting | 60% less time spent on manual tasks |
| Insights buried in spreadsheets | AI-powered alerts highlight anomalies and wins |
| Client updates reactive | Account teams proactively optimize and impress |
A leading media agency adopted TapClicks analytics dashboards to unify reporting across search, display, and social. With time saved and insights surfaced, client satisfaction and retention soared—while analysts finally focused on strategy, not data assembly.
The Takeaway: From Chaos to Clarity
Unified dashboards don’t just save time—they empower teams to move from reactive reporting to proactive, insight-driven marketing. With TapClicks, you gain:
- Centralized visibility across every channel and location
- Automated, AI-enhanced insights delivered when (and where) you need them
- More time for strategy, less time lost to data wrangling
That’s how you turn data chaos into marketing clarity—and real results.
Kickstarting Your Multi-Channel Analytics Dashboard Journey
Building a multi-channel analytics dashboard doesn’t have to be overwhelming. With a clear plan, you can turn scattered data into actionable insights that fuel smarter marketing decisions. Here’s how to get started—step by step.
1. Pinpoint What You Need to Measure
- Clarify Your Goals:
Are you tracking brand awareness, conversions, or budget efficiency? - List Your Channels:
Include paid search, social, display, offline, or any other touchpoints. - Identify Key Metrics:
Choose KPIs that matter most for your business or clients (e.g., ROI by channel, budget pacing, engagement). - Engage Stakeholders:
Ask execs, account managers, and analysts about their reporting pain points and must-have data.
2. Choose a Platform Built for Scale and Flexibility
Not all dashboards are created equal. Look for solutions that:
- Unify all your data sources (like TapClicks)
- Automate reporting workflows so you’re not stuck in spreadsheets
- Offer customizable dashboards for different users and clients
- Support role-based access to keep data secure and relevant
- Scale effortlessly as your reporting needs grow
3. Connect and Normalize Your Data
- Use Pre-Built Connectors:
With TapClicks, access 10,000+ ready-to-use integrations. - Leverage Smart Connectors:
Bring in even the most custom or niche data sources. - Standardize & Enrich Data:
Ensure cross-channel consistency with mapping and normalization tools. - Check Data Quality:
Validate connections to prevent reporting gaps or errors.
4. Build Dashboards That Actually Get Used
- Customize Views:
Tailor dashboards for execs, analysts, clients, or sales teams. - Drag-and-Drop Visualization:
Highlight key trends, comparisons, and outliers. - Automate Reporting:
Schedule routine reports and keep everyone in the loop—branded and on time. - Keep Brand Consistency:
Apply your organization’s (or clients’) logos, colors, and styles.
5. Get Your Team Onboard and Make It Stick
- Train for Success:
Offer demos, walkthrough videos, and easy-to-follow guides. - Assign Roles & Permissions:
Encourage collaboration while protecting sensitive info. - Collect Feedback:
Continuously refine dashboards based on real-world user needs.
Keep Your Dashboards Sharp: Ongoing Tips
- Regularly revisit KPIs to ensure alignment with business goals.
- Act on user and stakeholder feedback to boost relevance and usability.
- Tap into AI-powered insights (like those in TapClicks) to flag trends and optimization opportunities automatically.
- Maintain data connectors as your martech stack evolves.
Ready to bring all your marketing data together?
Discover how TapClicks can unify your analytics, speed up reporting, and drive better decisions. For a closer look at multi-channel dashboards, check out our in-depth overview.
Conclusion
A multi-channel analytics dashboard isn’t just a convenience—it’s the cornerstone of effective, modern marketing operations. By unifying fragmented data streams and automating the delivery of actionable insights, these dashboards empower teams to make faster, smarter decisions that drive measurable ROI. Instead of getting bogged down by manual reporting and siloed analytics, marketers can focus on strategy, creative optimization, and campaign innovation.
Platforms like the TapClicks analytics dashboard exemplify what’s possible when advanced data integration, automated reporting, and AI-driven insights come together in a single, scalable solution. Whether you’re an agency juggling hundreds of client campaigns or a brand striving for cross-channel clarity, unified reporting platforms free your team to do what matters most: deliver outstanding marketing results.
Ready to transform your analytics approach and unlock the full potential of your campaigns? Explore how TapClicks can turn your data chaos into clarity, and elevate every aspect of your marketing performance.
Start Automating Your Marketing Data Today!
No Credit Card Required.

