

Multi-Channel Analytics Dashboard: Unify Your Marketing Data
Modern marketing doesn’t happen in silos. Campaigns span paid search, social, email, programmatic, and beyond—making it tough to get a true view of performance without hours of manual reporting. A multi-channel analytics dashboard brings all your marketing data together in one unified platform, turning scattered numbers into clear, actionable insights. With tools like the TapClicks analytics dashboard, teams can visualize their cross-channel marketing analytics, automate reporting, and make smarter decisions that drive ROI.
Why Unified Reporting Matters for Modern Marketing
In today’s digital landscape, marketing teams are juggling an ever-expanding array of channels—Google Ads, Facebook, email newsletters, programmatic display, SEO, and more. Each platform comes with its own analytics, metrics, and reporting tools, leading to a fragmented view of campaign performance. This fragmentation creates major challenges: data is siloed, time is wasted on manual aggregation, and it becomes almost impossible to see the full picture or optimize campaigns holistically.
The result? Marketers often spend hours—sometimes days—chasing down numbers from different sources, copying data into spreadsheets, and reconciling reports. This not only drains productivity but also introduces risks of human error, inconsistent metrics, and delayed insights. For agencies, these inefficiencies can impact client satisfaction and make it harder to deliver timely, value-driven communication. For brands, the inability to unify data hampers ROI tracking and makes budget allocation decisions more guesswork than science.
Unified reporting solves these challenges by bringing all marketing data into a single, centralized dashboard. Teams can instantly visualize what’s working (and what isn’t) across every channel, spot opportunities for optimization, and deliver clear, consistent reports to stakeholders or clients. As highlighted in “how automation boosts agency reporting efficiency”, automation within unified dashboards doesn’t just save time—it frees up analysts and marketers to focus on strategy, creative problem-solving, and delivering real business impact.
Ultimately, unified reporting is the foundation for modern, data-driven marketing. It streamlines operations, improves accuracy, fosters transparency, and empowers teams to make faster, smarter decisions that drive ROI. Solutions like TapClicks are purpose-built to meet these demands, offering robust integrations and automation that transform scattered marketing data into actionable insights at scale.
What Is a Multi-Channel Analytics Dashboard?
A multi-channel analytics dashboard is a centralized platform that aggregates, visualizes, and analyzes data from all your marketing channels in one unified interface. Its core purpose is to give marketers, agencies, and brands a holistic, real-time view of campaign performance—eliminating the need to manually cobble together reports from disparate sources like Google Ads, Facebook, programmatic platforms, email tools, and more.
At its heart, a multi-channel dashboard pulls in marketing data aggregation from every relevant source, blends and normalizes those datasets, and presents them in customizable, role-based dashboards. Essential features typically include:
- Performance Tracking Dashboard: Monitor KPIs, conversions, spend, and engagement across channels side by side.
- Campaign Performance Visualization: Use charts, tables, and graphs to spot trends, compare tactics, and uncover opportunities.
- ROI Tracking Dashboard: Tie marketing investments directly to outcomes by connecting cost data with revenue, leads, or sales.
- Automated Reporting: Schedule data refreshes and custom reports for teams or clients, ensuring your insights are always up to date.
A standout example is the TapClicks analytics dashboard, which unifies cross-channel data, automates reporting, and empowers users to drill into campaign details or high-level performance—all from a single platform. The right multi-channel analytics dashboard doesn’t just collect data; it transforms it into actionable intelligence that drives better marketing decisions.
Key Components of an Effective Dashboard
An effective multi-channel analytics dashboard isn’t just a pretty interface—it’s a powerhouse of functionality designed to make marketing teams smarter, faster, and more strategic. The foundation of this power lies in four critical components: integrated marketing metrics, customizable data sources, cross-channel reporting views, and automated marketing insights.
Integrated Marketing Metrics: At the heart of any great dashboard is the ability to pull in data from every relevant source—paid search, social media, email platforms, programmatic ad networks, and more. By aggregating these marketing metrics into a single view, teams can break down data silos and connect the dots across the customer journey. This integration ensures you’re not just looking at isolated results, but understanding how each channel impacts overall performance.
Customizable Data Sources: No two marketing teams are exactly alike. Top dashboards allow users to connect the platforms and channels that matter most to their business, whether it’s Google Ads, Meta, HubSpot, or niche programmatic solutions. With customizable data connectors, you can ensure your dashboard reflects your unique campaign mix—without the need for complicated workarounds or manual imports.
Cross-Channel Reporting Views: True multi-channel reporting means you can compare, blend, and analyze data across all channels in real time. Effective dashboards offer flexible reporting views—by channel, campaign, region, or even custom segments—giving you the freedom to slice and dice performance data in ways that drive actionable insights. This is especially valuable for agencies and multi-location brands managing diverse marketing portfolios.
Automated Marketing Insights: Data without direction is just noise. The best dashboards don’t stop at visualization—they use AI and automation to surface key trends, anomalies, and optimization opportunities. Tools like TapClicks’ analytics dashboard empower users with automated alerts, predictive models, and smart recommendations that transform raw metrics into clear next steps for boosting ROI.
Real-Time Data and Seamless Blending: Modern marketing moves fast, and so should your analytics. Real-time data feeds and seamless data blending are essential for spotting issues and opportunities as they happen, not weeks later. This agility enables marketers to pivot quickly, optimize spend, and deliver results in today’s always-on landscape.
Visualization Tools for Clarity and Impact: Finally, an effective dashboard should turn complex data into clear, compelling visuals. Intuitive charts, trend lines, performance heatmaps, and customizable widgets help stakeholders instantly grasp what’s working, what isn’t, and where to focus next. Visualization isn’t just about aesthetics—it’s about empowering better, faster decisions at every level.
Bringing these components together, platforms like TapClicks provide the robust foundation needed for unified, insight-driven marketing operations. With the right dashboard setup, teams unlock a single source of truth that accelerates reporting, sharpens strategy, and maximizes campaign ROI.
Cross-Channel Marketing Analytics: Connecting the Dots for Real Optimization
Cross-channel marketing analytics is the secret weapon for teams aiming to truly optimize multi-platform campaigns. Here’s why it matters—and how platforms like TapClicks make it possible.
Why Siloed Data Holds You Back
When marketing data lives in separate silos, you end up with:
- Fragmented Metrics: Search, social, display, and programmatic channels each have their own reporting.
- Missed Insights: It’s tough to see how channels interact, overlap, or cannibalize each other.
- Blind Spots: Optimization happens in a vacuum, leading to less effective campaigns.
What Happens When You Break Down Silos?
Imagine this scenario:
- Paid Search: High clicks, low conversions.
- Social: Strong engagement and brand awareness, but unclear impact on sales.
- Display/Email: Additional touchpoints, but the customer journey is hard to map.
By unifying data from all these channels, you can:
- Overlay performance: See if social engagement leads to paid search conversions.
- Map attribution paths: Identify which touchpoints drive revenue.
- Refine budget allocation: Invest where your spend actually moves the needle.
How TapClicks Powers Cross-Channel Insights
TapClicks serves as your marketing data command center, bringing everything together:
| TapClicks Advantage | What You Get |
|---|---|
| Multi-Channel Dashboards | Google Ads, Facebook, DSPs, and 10,000+ sources in one view |
| Real-Time Analysis | Instantly compare cross-platform performance |
| Custom Dashboards & Reports | Tailored to your KPIs, clients, and business units |
| Automated AI Insights | Actionable trends, optimization tips, and smart visualizations |
| Attribution & Media Mix Modeling | Move beyond last-click—see full customer journeys and optimize spend |
What It Means for Your Team
With unified cross-channel analytics, you can:
- Spot top-performing channels and creatives
- Optimize spend for maximum ROI
- Align teams on a single source of truth
- Unlock advanced strategies like multi-touch attribution and media mix modeling
Bottom line: Cross-channel analytics isn’t just a nice-to-have—it’s essential for data-driven, scalable marketing. With TapClicks, all your data finally works together to fuel smarter decisions, better performance, and a real competitive edge.
Why Manual Data Wrangling Slows You Down
Anyone who’s exported endless spreadsheets knows the pain:
- Copy-pasting numbers from Google Ads, Facebook, and dozens of other platforms
- Cleaning up mismatched columns and formats
- Double-checking to avoid costly errors
- Scrambling to update reports before meetings
This manual process is not only tedious—it’s a major bottleneck for marketing teams juggling high-volume campaigns.
How Automated Data Collection Transforms Marketing Ops
TapClicks and similar platforms flip the script by delivering:
- Direct Connections: Instantly pull data from thousands of marketing sources (social, search, programmatic, CRM, and more)
- Scheduled Data Syncs: Get fresh, up-to-date data loaded on your schedule—no more chasing last-minute exports
- Automated Data Transformation: Normalize, blend, and enrich datasets automatically, so your dashboards always make sense
What Does This Mean for Your Team?
| Manual Approach | Automated with TapClicks |
|---|---|
| Export spreadsheets by hand | Data flows in automatically |
| Manual cleanup and formatting | Data normalized instantly |
| Risk of human error | Consistent, reliable pipelines |
| Reports distributed manually | Scheduled, automated delivery |
Scheduled Reporting: No More Waiting
With automation, reporting becomes a set-and-forget process:
- Automated Delivery: Reports are generated and sent to stakeholders and clients on a schedule you control
- Always Up-to-Date: Leadership and clients see the latest performance data—no waiting for an analyst to pull numbers
- Faster Decisions: Real-time insights make it easier to pivot strategies and seize new opportunities
The Bottom Line: Faster Insights, Fewer Headaches
When you automate data collection and reporting:
- Teams spend less time in spreadsheets
- Human error is dramatically reduced
- Insights are delivered faster and more reliably
Want to see this in action? Explore how brands are unlocking real-time marketing with automated data collection.
Automated pipelines aren’t just a time-saver—they’re a competitive advantage for smarter, more agile decision-making.
Visualizing Campaign Performance and ROI
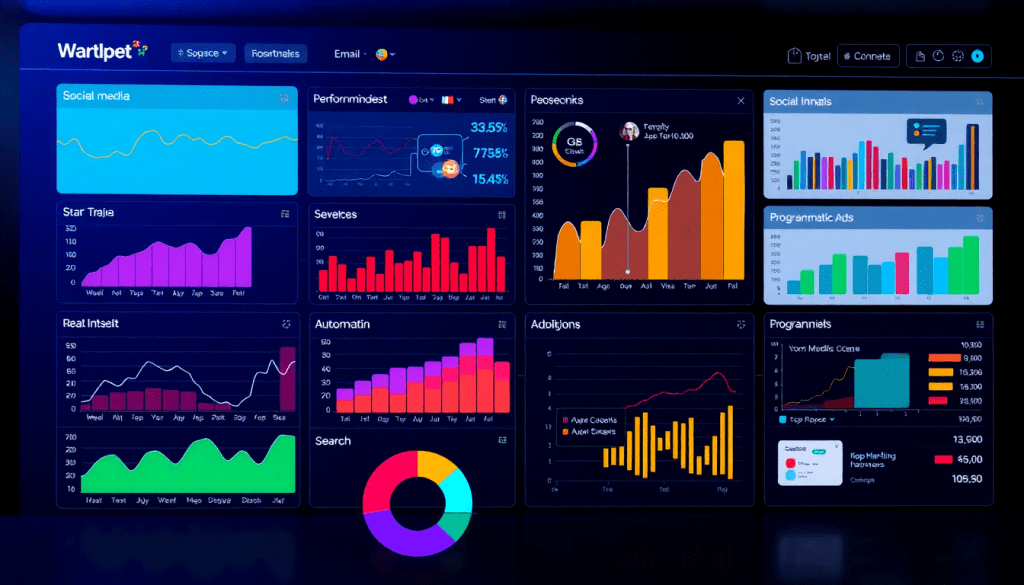
Clear, actionable visualization is at the heart of a great multi-channel analytics dashboard. By transforming raw numbers into intuitive charts, graphs, and scorecards, marketers can quickly spot what’s working, what isn’t, and where to shift their focus. Effective campaign performance visualization begins with showcasing key metrics—such as impressions, clicks, conversions, and spend—in a way that makes cross-channel comparisons effortless.
A unified reporting platform like the TapClicks analytics dashboard excels at surfacing trends and outliers. Instead of sifting through spreadsheets or toggling between siloed tools, marketers get a single view that highlights spikes in engagement, sudden budget fluctuations, or underperforming channels. Customizable dashboards let you slice data by campaign, client, region, or time period, enabling both granular analysis and high-level overviews.
Visual dashboards are also a game-changer for ROI tracking and budget allocation. With all performance and cost metrics in one place, you can instantly see which channels are delivering the best return and optimize budgets accordingly. Interactive visualizations—like heat maps, funnel charts, and time-series graphs—make it easy to identify patterns and justify spend decisions to stakeholders. In short, unified dashboards empower teams to move beyond basic reporting, unlocking the insights needed to drive smarter marketing investments and sustained growth.
To learn more about how TapClicks brings campaign data to life with powerful visualization and ROI tracking, visit TapClicks.com.
How TapClicks Analytics Dashboard Stacks Up Against the Competition
Navigating the crowded landscape of marketing intelligence tools? Here’s a clear look at what makes TapClicks different—and why it’s trusted by agencies, brands, and enterprise teams with high-volume, multi-channel needs.
TapClicks vs. Other Solutions: The Big Picture
| Feature/Benefit | TapClicks | Funnel.io / Supermetrics | Agency Analytics / NinjaCat | Datorama / Adverity |
|---|---|---|---|---|
| Scale (Dashboards/Clients) | Handles thousands at once | Limited | Limited | Enterprise-grade |
| Data Connectors | 10,000+ omnichannel integrations | Moderate | Limited | Extensive |
| AI-Powered Insights | Yes (AI Agents, SmartEmail, Predictive) | No | No | Some (varies) |
| Reporting Automation | Fully automated, branded, scheduled | Partial | Basic | Advanced |
| ETL/ELT Pipeline | Built-in, export to BI tools | Data pipeline only | No | Yes |
| Workflow & Order Management | Yes | No | No | Some |
| User Interface/Deployment | Intuitive, user-friendly | Varies | Simple | Complex, heavy |
What Makes TapClicks a Standout?
-
Built for Scale:
Seamlessly manages thousands of dashboards, reports, and clients—essential for agencies and media companies juggling complex, multi-client operations. -
Omnichannel Power:
10,000+ connectors for unified analytics across paid search, social, display, email, and more. -
AI That Drives Action:
TapClicks’ built-in AI (AI Agents, SmartEmail) doesn’t just visualize data—it surfaces optimization opportunities, campaign scoring, and predictive recommendations for smarter, faster decisions. -
Flexibility at the Core:
- Use TapClicks as your central marketing command center, with drag-and-drop dashboards and branded reports.
- Or, send enriched, normalized data directly into enterprise BI tools like Tableau, Power BI, or Looker.
-
Workflow Automation:
Streamline everything from order management to role-based client access—no more cobbling together multiple point tools.
TapClicks Compared to the Competition
-
Agency Analytics, NinjaCat:
Great for basic reporting—but TapClicks offers deeper data integration, advanced analytics, and scalable workflow automation. -
Funnel.io, Supermetrics:
Excellent pipes for moving data—but TapClicks adds visualization, actionable insights, and campaign management in one unified platform. -
Datorama (Salesforce), Adverity:
Powerful, but often complex and costly. TapClicks delivers enterprise-grade capabilities with a faster, more intuitive user experience.
Who Gets the Most Out of TapClicks?
-
Agencies & Media Companies:
Manage hundreds of clients and campaigns with unified client access, scalable reporting, and streamlined workflows. -
Multi-Location Brands & Enterprise Teams:
Get consolidated analytics, budget control, and AI-driven insights—tailored for large organizations. -
Data-Driven Ops Teams:
Use TapClicks as a central marketing data hub, seamlessly pushing enriched data into your BI, CRM, or finance systems.
Ready to leave fragmented reporting behind?
**Discover TapClicks**—the unified platform for automated, scalable, and insight-driven marketing analytics.
Next Steps: Bringing All Your Marketing Insights Under One Roof
Adopting a unified analytics dashboard isn’t just a technical upgrade—it’s a strategic move that can transform your marketing operations. By centralizing your reporting and analytics, you’re able to:
- See campaign performance across every channel, at a glance
- Replace time-consuming manual reporting with automation
- Empower teams and clients to make faster, smarter, data-driven decisions
Whether you’re managing hundreds of client accounts or coordinating campaigns across multiple locations, the right dashboard means less time wrangling spreadsheets and more time acting on insights.
Where to Begin: Steps Toward a Unified Marketing Dashboard
Ready to take the leap? Here’s how to get started—and what to prioritize for maximum impact:
1. Map Your Data Landscape
- List every marketing and advertising platform in your stack (think Google Ads, Meta, CRMs, offline channels, etc.).
- Identify critical integrations for your business goals—focus where you’ll see the biggest value first.
2. Lock In Your Key Marketing Metrics
- Define the KPIs that matter most: conversions, ROAS, budget pacing, multi-touch attribution, or others.
- Ensure your dashboard is set up to highlight these metrics front and center.
3. Automate Data Flow
- Use robust connectors and automation tools to eliminate manual data entry and reduce errors.
- Consider platforms like TapClicks, which offer 10,000+ integrations and automated ETL/ELT pipelines for seamless data unification.
4. Personalize Reporting for Every Stakeholder
- Customize dashboards for executives, campaign managers, or clients—so everyone gets the right insights, in the right format.
- Leverage role-based access to streamline collaboration and transparency.
5. Put Reporting on Autopilot
- Schedule regular, automated reports to keep everyone in the loop—no more last-minute report scrambles.
- Use insights surfaced automatically to drive ongoing optimization.
Want to Go Deeper?
Explore best practices and tactical guides on dashboard automation and cross-channel analytics:
- TapClicks blog: Marketing Dashboard Automation
- Other resources on real-time marketing and reporting efficiency
Bottom line: Investing in a unified marketing intelligence platform today means your team will be ready to make smarter decisions, achieve stronger results, and stay ahead in an ever-changing marketing landscape.
Start Automating Your Marketing Data Today!
No Credit Card Required.

