

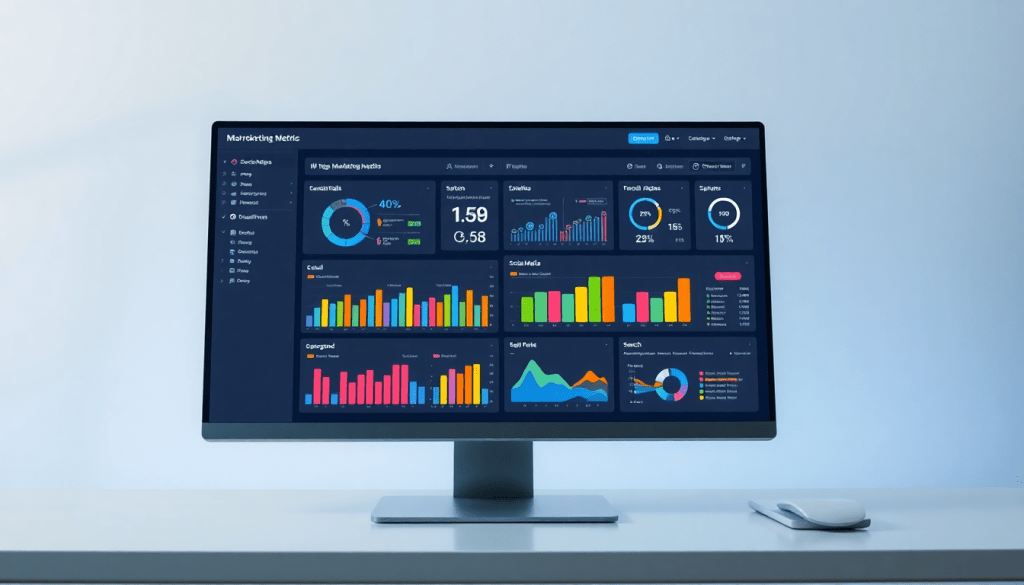
Multi-Channel Analytics Dashboard: Unified Marketing Insights
Managing marketing data from dozens of channels, platforms, and campaigns can quickly become overwhelming. A multi-channel analytics dashboard simplifies this chaos by aggregating data into a unified reporting platform—making it easier to visualize performance, uncover actionable insights, and optimize ROI. Whether you’re running campaigns for a single brand or hundreds of clients, leveraging a dashboard like the TapClicks analytics dashboard streamlines your workflow, automates reporting, and enables smarter, faster decision-making.
What is a Multi-Channel Analytics Dashboard?
A multi-channel analytics dashboard is a centralized digital platform that aggregates, visualizes, and analyzes marketing data from a wide array of sources—such as social media, search engines, display ads, email campaigns, and more. Instead of juggling separate reports from each channel, marketers can access unified, real-time insights in one place, making it far simpler to monitor performance, spot trends, and drive strategic decisions.
Within the broader context of marketing operations, a multi-channel dashboard acts as the command center. It connects disparate data streams, normalizes metrics, and delivers a comprehensive view of every active campaign. This holistic approach eliminates the manual process of stitching together spreadsheets or toggling between platforms, so marketers and agencies can focus on optimizing strategy rather than wrangling data.
For today’s marketers, unified reporting platforms have become indispensable. Campaigns now span dozens of touchpoints and platforms, and clients or stakeholders expect timely, transparent reporting. Without a centralized dashboard, inefficiencies, data silos, and missed insights are virtually guaranteed. By adopting a robust multi-channel analytics dashboard—like the TapClicks analytics dashboard—teams can streamline workflows, automate tedious reporting tasks, and make data-driven decisions faster than ever.
The benefits aren’t just operational: dashboard automation can dramatically boost agency efficiency by saving time, reducing errors, and freeing up resources for higher-value work. Learn more about how dashboard automation boosts agency efficiency.
Core Features and Capabilities
A powerful multi-channel analytics dashboard brings together your entire marketing ecosystem, offering features that drive efficiency, clarity, and growth. Here’s what sets top-tier platforms like the TapClicks analytics dashboard apart:
Comprehensive Campaign Performance Visualization
First and foremost, these dashboards consolidate campaign data from every channel—social, search, display, email, and beyond—into a single, intuitive interface. Teams can visualize KPIs, such as impressions, clicks, conversions, and spend, side-by-side. Customizable widgets, charts, and graphs make it easy to spot trends, compare channels, and drill down into specific campaigns or client accounts.
ROI Tracking and Integrated Marketing Metrics
Unified dashboards go beyond vanity metrics, offering deep ROI tracking capabilities. By blending cost and outcome data across channels, marketers can calculate true return on ad spend (ROAS), cost per acquisition (CPA), and customer lifetime value (LTV) in real-time. This integrated approach ensures you’re not just tracking activity, but measuring impact and profitability across your entire marketing mix.
Automated, Real-Time Reporting and Insights
Manual data pulls and static reports are replaced by automated reporting engines. The TapClicks platform, for example, lets you schedule branded reports, deliver them to stakeholders on autopilot, and set up real-time alerts for performance anomalies. Built-in AI agents analyze your dashboards continuously, surfacing actionable insights and optimization opportunities—so you’re always ahead of the curve.
Scalability for Agencies, Brands, and Enterprises
Whether you’re an agency managing hundreds of clients or an enterprise brand with dozens of locations, scalability is vital. Advanced dashboards are designed to handle thousands of campaigns, users, and reports simultaneously. Role-based access ensures teams and clients see only what’s relevant, while centralized management streamlines collaboration and oversight.
Flexible, Multi-Platform Reporting
Not all organizations use the same tools or need the same views. The best multi-channel analytics dashboards offer flexibility to customize layouts, metrics, and branding for each client or team. With robust data connectors (TapClicks, for instance, offers over 10,000 integrations), you can unify data from virtually any source—then export cleaned, enriched datasets directly to BI tools like Tableau, Power BI, or your CRM.
These core capabilities ensure your dashboard adapts to your unique workflow, automates the heavy lifting, and empowers you to deliver unified, actionable reporting at scale. To learn how TapClicks can elevate your analytics and reporting, visit TapClicks.
Why Marketers Need Cross-Channel Analytics
Today’s marketing isn’t limited to just one channel. Brands and agencies juggle campaigns across search, social, display, email, video, and more—each generating its own set of data, metrics, and reporting headaches. Here’s how a cross-channel analytics solution like TapClicks changes the game.
What Happens When You Bring All Your Data Together?
With cross-channel analytics, you can:
-
Eliminate data silos
No more downloading reports from multiple platforms or comparing apples to oranges. All your data is aggregated and normalized in one place. -
See the full picture
Omnichannel dashboards let you compare results side by side, spot patterns, and understand how tactics interact to drive conversions. -
Unlock true attribution
Reveal which channels and campaigns actually move the needle and identify where your marketing dollars have the biggest impact.
Real-World Impact: Optimization and Budgeting
A unified analytics dashboard empowers you to:
-
Visualize your entire funnel
Instantly spot underperforming channels and double down on what’s working. -
Allocate budgets in real time
Adjust spending dynamically based on live performance, not last month’s spreadsheets. -
Deliver better recommendations
Agencies can give clients transparent, data-driven advice. Brands can stretch every marketing dollar further.
Why Real-Time Really Matters
-
No more waiting for monthly reports
Automated data collection means you’re always acting on the freshest information. -
Agile decision-making
Make quick, confident changes as campaigns unfold, not after the fact. -
Actionable, unified insights
Get immediate answers to questions like “Which channel drove the most leads this week?” or “Where should we boost spend tomorrow?”
For a deeper dive into the impact of real-time data, check out Unlocking Real-Time Marketing: The Power of Automated Data Collection for Brand Marketers.
What Does This Look Like in Practice?
| Without Cross-Channel Analytics | With TapClicks Unified Analytics |
|---|---|
| Manually pulling scattered reports | Automated, real-time dashboards |
| Siloed data and inconsistent formats | Normalized, side-by-side comparisons |
| Guesswork in attribution and budgeting | Clear insights for smarter decisions |
| Reactive, slow optimization | Proactive, agile campaign management |
Ready for True Clarity?
By adopting cross-channel analytics, organizations gain the clarity and confidence to drive measurable growth—no matter how many platforms, campaigns, or clients they manage.
Curious how unified analytics can transform your workflow? Explore what TapClicks can do for you.
Visualizing Campaign Performance and ROI
Dashboards are powerful because they distill dense, multi-channel data into visuals and reports that anyone—from analysts to executives—can instantly understand. With a well-designed multi-channel analytics dashboard, marketing teams can move beyond raw spreadsheets, leveraging customizable widgets, charts, and graphs to illuminate exactly how campaigns are performing across every channel.
Customizable Visual Tools for Clarity and Action
Modern dashboards, like those provided by TapClicks, offer drag-and-drop interfaces that let users build campaign performance visualizations tailored to their unique goals. Whether it’s comparing paid social spend against conversions, tracking organic search trends, or monitoring email engagement rates, these dashboards present each data stream in a format that’s both intuitive and actionable. Users can choose from bar graphs, time series, pie charts, and even geo-maps, ensuring that the most relevant KPIs are always front and center.
Performance Dashboards in Action
Picture an agency managing a dozen clients, each running multi-platform campaigns. With a unified dashboard, the team can quickly spot which creative is outperforming on Instagram, which ad groups are lagging on Google, or where budget reallocations might yield higher ROI. Stakeholders can toggle between high-level summaries and granular breakdowns, drilling down into campaign, ad set, or even keyword-level metrics—without ever leaving the dashboard environment.
ROI Tracking that Speaks to Stakeholders
One of the most critical elements is clear, transparent ROI tracking. A robust dashboard translates campaign results into bottom-line metrics, showing not just clicks or impressions but true business outcomes: cost per acquisition, return on ad spend (ROAS), and incremental revenue. These insights, delivered in easy-to-read visuals, enable marketers and their clients to make faster, evidence-based decisions about budget allocation and campaign strategy.
Ultimately, by transforming complex, multi-source data into accessible visual stories, multi-channel analytics dashboards empower teams to not only report on performance but to continuously optimize for greater impact and efficiency.
Automated Insights and Marketing Intelligence Reporting
Today’s marketers are inundated with data, but turning raw numbers into clear, actionable insights is the real challenge. This is where automated marketing insights and marketing intelligence reporting become game-changers for proactive campaign management.
Automated marketing insights use advanced algorithms and AI agents to continuously scan your dashboards and datasets, surfacing trends, anomalies, and opportunities as soon as they emerge. Instead of manually sifting through spreadsheets or waiting for periodic reviews, teams receive instant, data-driven notifications about what’s working—and what isn’t. For example, if a particular channel’s performance suddenly spikes or dips, the system highlights it automatically, enabling marketers to react in real time rather than after the fact.
Marketing intelligence reporting takes this further by applying automated analysis across all your integrated data sources. These reports don’t just summarize metrics—they connect the dots, revealing underlying patterns in audience behavior, campaign attribution, and budget efficiency. By leveraging platforms like the TapClicks analytics dashboard, organizations can set up scheduled, branded reports that not only deliver the numbers but also interpret them, ensuring every stakeholder—from analysts to executives—gets meaningful insights tailored to their needs.
The real power comes from AI-powered recommendations and predictive analytics. Modern dashboards can now benchmark your campaigns against industry standards, suggest budget reallocations, and even forecast future outcomes based on historical data. This level of automation empowers teams to optimize campaigns proactively, allocate resources more efficiently, and ultimately drive better ROI.
To see how automation is transforming analytics reporting and helping agencies and brands stay ahead of the curve, check out this deeper dive into automation’s impact on analytics reporting. With automated insights and marketing intelligence reporting, marketing teams can move from reactive to proactive, making smarter decisions—faster—than ever before.
Integrating and Scaling Your Marketing Data
A critical challenge for modern marketers is aggregating data from a multitude of platforms—social media, search engines, ad networks, email providers, and more—into a single, cohesive view. A multi-channel analytics dashboard solves this by acting as a central hub for marketing data integration, eliminating the manual headaches of data wrangling and allowing you to focus on strategy rather than spreadsheets.
Seamless Data Aggregation Across Platforms
The first step in successful multi-channel analytics is establishing reliable connections to all your marketing data sources. Solutions like TapClicks excel here, offering access to 10,000+ pre-built connectors and the flexibility to create custom integrations. With automated ETL/ELT pipelines, data from each platform is extracted, transformed, and loaded into the dashboard in near real-time. This not only unifies disparate datasets but also standardizes and enriches them—enabling true cross-channel analysis.
Integration with Business Systems and BI Tools
A robust analytics dashboard doesn’t just centralize marketing data; it also ensures that your insights are accessible across the organization. TapClicks, for example, supports integrations with popular BI tools (Tableau, Power BI, Looker), CRMs, and finance platforms. This enables marketing data to flow seamlessly into business intelligence workflows, sales pipelines, and financial reporting—amplifying the impact of your analytics well beyond the marketing department.
Scalability for Agencies and Enterprises
As your business grows, so do your data needs. Agencies managing hundreds of clients and enterprise brands with multiple locations require a platform that can scale effortlessly. TapClicks is purpose-built for high-volume scenarios, capable of handling thousands of dashboards and custom reports simultaneously. The platform’s role-based access and multi-tenant architecture ensure secure, organized data management—whether you’re onboarding a new brand, expanding to new channels, or consolidating global operations.
Smooth Onboarding and Ongoing Growth
Getting started with a multi-channel analytics dashboard shouldn’t be a roadblock. TapClicks offers guided onboarding, intuitive UI, and extensive support resources to ensure a smooth transition—no matter your current tech stack or data complexity. As your data landscape evolves, TapClicks’ scalable architecture and flexible connectors make it easy to add new data sources, automate additional reporting, and expand into new markets without missing a beat.
Unifying and scaling your marketing data is no longer a luxury—it’s a necessity. With a solution like TapClicks, integration and growth become strengths, not obstacles, empowering your team to unlock the full power of cross-channel analytics.
Choosing the Right Omnichannel Analytics Solution
Selecting the ideal multi-channel reporting platform is a crucial decision that impacts not only your marketing insights but also your team’s efficiency and client satisfaction. To ensure your choice supports both current and future needs, consider these key criteria:
1. Breadth and Depth of Data Connectors
The foundation of a great omnichannel analytics solution is its ability to seamlessly aggregate data from diverse sources. Look for platforms offering a wide range of native connectors—covering social, search, programmatic, email, CRM, and other marketing channels. Solutions like the TapClicks analytics dashboard excel here, with over 10,000 data connectors and the flexibility of custom integrations, ensuring you won’t hit adoption roadblocks as your campaigns expand.
2. Scalability and Performance
Whether you’re a growing agency or an enterprise brand, scalability is non-negotiable. Your analytics dashboard should handle thousands of dashboards and reports without performance bottlenecks. TapClicks is purpose-built for high-volume users, in contrast to lighter competitors like Agency Analytics or NinjaCat, which may suit smaller teams but struggle at scale.
3. Automation and AI Insights
Modern marketing operations demand automation—not just for data pulls, but also for reporting, insights generation, and proactive recommendations. Platforms that provide automated report scheduling, AI-driven insights, and predictive analytics (such as TapClicks’ SmartPilot and SmartEmail) will save your team dozens of hours monthly and help you act on trends in real time. Many alternatives, like Funnel.io or Supermetrics, focus on data extraction but lack built-in AI-powered intelligence.
4. Integrated Workflow and Collaboration Tools
Unified analytics isn’t just about data; it’s about streamlining processes and collaboration. Evaluate whether the platform supports order management, role-based access, and workflow automation to bridge the gap between sales, ops, and fulfillment teams. TapClicks stands out with integrated workflow modules—something not typically offered by pure data pipeline tools.
5. Support and Flexibility
Consider the level of customer support, onboarding resources, and platform flexibility. Can the dashboard serve as your “single source of truth,” or does it easily integrate with existing BI tools like Tableau and Power BI? TapClicks offers both options, ensuring you can centralize analytics or feed data into your broader tech stack as needed.
Comparing TapClicks to Other Solutions
While competitors like Funnel.io, Adverity, and Datorama (Salesforce) provide robust data aggregation, they often require additional tools for workflow, reporting, or AI-driven insights. Agency Analytics and NinjaCat may be more approachable for small agencies but lack enterprise-grade scalability and automation. TapClicks differentiates itself by unifying data aggregation, reporting, workflow, and AI insights—all in one platform—tailored for marketing organizations managing complex, multi-client or multi-location operations.
Evaluating Your Needs
Before choosing a solution, map out your must-have features: Do you require real-time reporting? Is workflow automation critical? How important is predictive analytics or AI-powered recommendations? Assess your current pain points—and consider future growth—to ensure the platform you select will empower your team rather than limit it.
For a deeper look at how TapClicks can unify your marketing data, streamline workflows, and deliver actionable intelligence at scale, explore TapClicks’ platform features or request a personalized demo.
Kick Off Your TapClicks Analytics Dashboard Journey
Getting started with TapClicks is easier than you think. Whether you’re running a fast-growing agency or managing analytics for a multi-location brand, TapClicks streamlines onboarding so you can focus on what matters—your marketing outcomes.
🚀 First Steps: Onboarding & Setup
Here’s how TapClicks helps you get up and running—fast:
-
Easy Sign-Up:
Start with a simple registration process—no technical heavy lifting required. -
Connect Your Data (Over 10,000+ Connectors):
Effortlessly link your marketing channels (social, search, programmatic, email, and more) with pre-built connectors. -
Step-by-Step Guidance:
The intuitive TapClicks interface walks you through every configuration—so you can centralize your reporting without IT bottlenecks.
🎛️ Build the Dashboards You Need
-
Custom Dashboards:
Use the drag-and-drop editor to create dashboards tailored to your business, clients, or campaigns. -
Templates Ready to Go:
Access a library of professional, pre-built dashboard templates for instant insights. -
Full Branding:
Whitelabel and brand every dashboard and report—perfect for impressing clients or stakeholders.
📚 Tap Into Training & Support
Set your team up for success with:
-
Self-Guided Tutorials:
Learn at your own pace with online guides and documentation. -
Live Onboarding Sessions:
Join interactive sessions for hands-on setup help. -
Dedicated Support:
Reach out to the TapClicks support team or your Customer Success Manager for anything from technical troubleshooting to advanced workflow customization.
🔍 Unlock Advanced Features as You Grow
As your needs evolve, TapClicks evolves with you:
-
Expand Integrations:
Connect with your BI, CRM, or finance systems. -
Automate Everything:
Schedule recurring reports and automate delivery to stakeholders. -
Get AI-Powered Insights:
Let TapClicks’ AI surface actionable recommendations and campaign optimizations. -
Control Access:
Use role-based permissions for secure, scalable collaboration.
👀 See TapClicks in Action
Want to explore before you commit?
- Watch an on-demand demo to see features in real time.
- Request a personalized walkthrough tailored to your agency or brand.
Experience firsthand how TapClicks eliminates manual data wrangling, streamlines your reporting, and powers better marketing decisions.
With TapClicks, you’re not just adopting a dashboard—you’re gaining a unified, scalable marketing operations platform that empowers your entire team.
Discover more and get started at www.tapclicks.com.
Start Automating Your Marketing Data Today!
No Credit Card Required.

