

Multi-Channel Analytics Dashboard: Unified Marketing Insights Fast
Marketers today face a tidal wave of data coming from dozens of platforms, each with its own metrics and dashboards. Stitching these insights together manually is time-consuming and can leave blind spots across your campaigns. A multi-channel analytics dashboard solves this by aggregating cross-channel marketing analytics into a single, unified reporting platform—delivering actionable, real-time intelligence for high-impact decision making. This guide explores how a modern performance tracking dashboard, like the TapClicks analytics dashboard, empowers you to visualize campaign performance, track ROI, and unlock automated marketing insights at scale.
What’s a Multi-Channel Analytics Dashboard—And Why Does It Matter?
A multi-channel analytics dashboard is your marketing command center. Instead of toggling between Google Ads, Meta, LinkedIn, and half a dozen other platforms, you get a single, unified view of every campaign, metric, and channel—updated in real time.
What Does a Multi-Channel Dashboard Actually Do?
Think of it as a “mission control” for marketing teams. Here’s what it brings to your workflow:
- Aggregates data automatically from dozens (or thousands) of sources
- Visualizes performance with customizable dashboards, widgets, and charts
- Tracks KPIs in real-time—awareness, spend, conversions, ROI, and more
- Compares and rolls up results across channels, campaigns, or clients
- Delivers scheduled reports directly to stakeholders (no more manual exports)
How Does This Compare to Traditional Methods?
| Traditional Methods | Multi-Channel Dashboard |
|---|---|
| Manual exports/spreadsheets | Automated data integration |
| Channel-by-channel logins | One login, all data |
| Siloed, disconnected reports | Unified, side-by-side analysis |
| High risk of errors/inconsistency | Consistent, up-to-date metrics |
With a multi-channel dashboard, silos disappear, manual busywork shrinks, and you get the full picture—fast.
Key Concepts, De-Mystified
-
Cross-channel marketing analytics:
See which channels work best together, and where your spend delivers the highest impact. -
Unified reporting platform:
Everything you need—consolidated, current, and client-ready. -
Omnichannel analytics solution:
Go beyond digital: connect online and offline touchpoints for a true 360-degree view of your customer journey.
TapClicks: Built for Unified Analytics
Platforms like TapClicks are engineered for this new era of marketing ops:
- Break down data silos—integrate all your sources in one place
- Monitor campaigns in real time—across every channel
- Surface actionable insights—with AI-powered recommendations and performance summaries
Ready to streamline your reporting? A multi-channel analytics dashboard is how modern marketing teams do it.
Why Unified Reporting Matters for Modern Marketing Teams
Today’s marketing teams face an overwhelming array of platforms—each producing its own flood of metrics, exports, and dashboards. It’s easy to get lost in a maze of Google Ads, Meta, programmatic channels, and more. The result? Hours wasted piecing together spreadsheets, resolving conflicting numbers, and trying to make sense of siloed data. This fragmented approach drains productivity and can hide critical performance issues until they become costly.
How Unified Reporting Changes the Game
A unified reporting approach centralizes all your marketing analytics in one dashboard. Whether you’re an agency juggling hundreds of clients or a brand managing multiple locations, the benefits are immediate and game-changing:
What You Gain from Consolidation
-
See Everything in One Place:
Instantly visualize all campaigns and channels side-by-side. Spot trends, compare performance, and find out what’s really driving ROI—no more endless platform toggling. -
Make Decisions Faster (and Smarter):
Unified dashboards mean no more manual data wrangling. Get near real-time insights to optimize campaigns and reallocate budgets on the fly. -
Trust in Consistent Metrics:
One source of truth means everyone—clients, execs, analysts—is using the same numbers. No more confusion or misalignments during reporting reviews. -
Scale with Ease:
Automated aggregation and dashboard automation let you handle more clients and campaigns—without lowering quality or burning out your team.
The Time-Saving Impact
| Manual Reporting | Unified Reporting with TapClicks |
|---|---|
| Merge spreadsheets by hand | Automated data pulls from 10,000+ sources |
| Hours reconciling metrics | 50+ hours saved per analyst/month |
| Delayed insights | Near real-time dashboards and reports |
| Risk of human error | Consistent, reliable metrics |
“Agencies and brands routinely save 50+ hours per analyst each month by automating data pulls and report generation.”
— Read more on analytics reporting automation
Why It Matters
Unified reporting isn’t just convenient—it’s essential for building agile, data-driven teams that consistently deliver results at scale. By automating the grunt work, you free up time for strategy, client service, and campaign innovation.
Curious how you can bring all your marketing data together?
Discover how TapClicks transforms reporting.
Key Features of an Effective Multi-Channel Analytics Dashboard
An effective multi-channel analytics dashboard isn’t just a data aggregator—it’s a strategic command center that empowers marketers to make fast, informed decisions. Here’s what sets the best dashboards apart:
1. Campaign Performance Visualization
A core capability is the ability to visualize campaign performance across channels—search, social, display, and more—in a single, intuitive view. Interactive charts, graphs, and heatmaps make it easy to spot trends, compare channels, and quickly identify what’s working (and what’s not). This holistic perspective eliminates guesswork and highlights both wins and opportunities for optimization.
2. Integrated Marketing Metrics
Instead of toggling between platform-specific dashboards, a multi-channel solution unifies all your relevant KPIs—impressions, clicks, conversions, spend, ROAS, and beyond. This brings clarity to cross-channel marketing analytics, enabling apples-to-apples comparisons and more accurate attribution. With integrated metrics, marketers can track the full customer journey and understand the cumulative impact of each channel.
3. ROI Tracking and Budget Management
The best dashboards feature robust ROI tracking tools that show precise returns on every marketing dollar. Budget pacing widgets and automated alerts help teams stay on track, reallocate resources, and maximize impact. Whether you’re managing a single campaign or dozens across multiple clients, you gain confidence that resources are being used efficiently.
4. Automated Marketing Insights
Modern dashboards go beyond static reporting by surfacing automated insights and recommendations, often powered by AI. These may include performance anomalies, optimization opportunities, and predictive forecasts. For example, with TapClicks’ analytics dashboard, AI-driven features like SmartPilot can proactively highlight underperforming campaigns or suggest budget reallocations—saving analysts hours each week.
5. Customizable Dashboards for Stakeholder Needs
Every team and client has unique reporting requirements. Leading platforms offer drag-and-drop dashboard builders, enabling users to tailor views, select relevant metrics, and apply custom branding. Scheduled reports and dynamic sharing options ensure that everyone—from executives to clients—receives timely, actionable updates without manual effort.
6. Multi-Client and Multi-Location Management
For agencies and enterprises managing numerous brands or locations, the right dashboard streamlines oversight. Features like role-based access, white-labeled portals, and hierarchical reporting let you scale effortlessly while maintaining data security and client confidentiality.
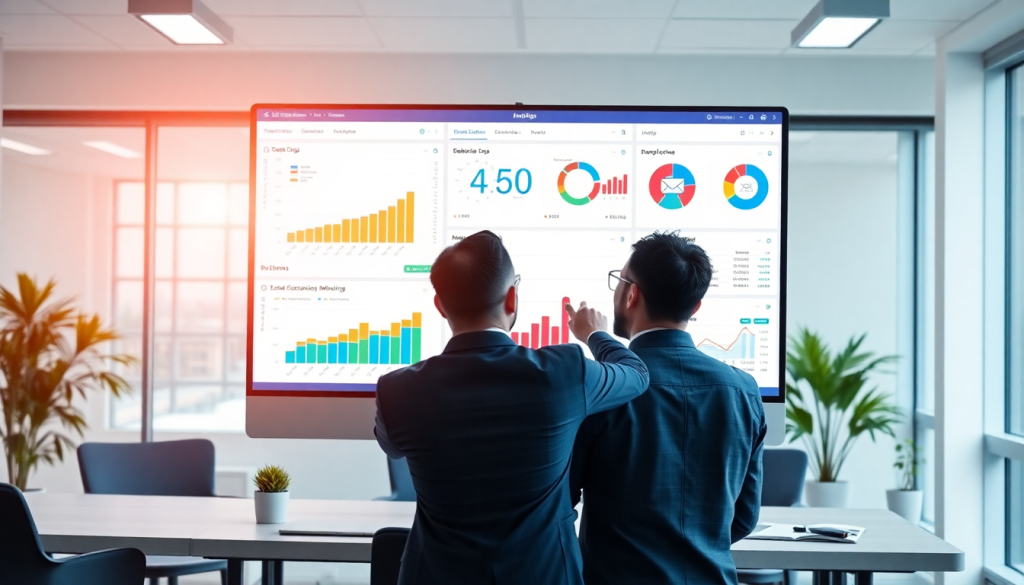
Visual Examples in Action
Performance tracking dashboards often showcase a blend of high-level summary widgets, detailed channel breakdowns, and interactive trend lines. For inspiration, explore TapClicks’ gallery of dashboard templates, which illustrate how unified reporting can turn complex, fragmented data into clear, compelling stories.
Ultimately, these capabilities transform multi-channel analytics dashboards from simple data repositories into engines of marketing intelligence—empowering teams to deliver real results, faster, and at scale.
How TapClicks Analytics Dashboard Delivers Integrated Marketing Intelligence
The TapClicks analytics dashboard stands out as a comprehensive, multi-platform reporting software designed to meet the demands of modern marketers, agencies, and enterprise teams. At its core, TapClicks brings together data from over 10,000 marketing, advertising, and business sources—automating the collection, aggregation, and visualization of all your performance metrics in one unified platform. This eliminates the tedious, error-prone process of manual data stitching, ensuring that your analytics are always up-to-date and actionable.
What truly sets TapClicks apart is its ability to operate at scale. Whether you're managing hundreds of client accounts or monitoring campaigns across dozens of channels, TapClicks delivers consistent, real-time insights with remarkable efficiency. Its flexible infrastructure allows you to customize dashboards by role, client, or channel, making it easy to tailor reports for different stakeholders—executives, clients, or internal teams—without duplicating work.
TapClicks also leads the way in AI-powered marketing intelligence reporting. Its integrated AI agents automatically analyze your dashboards and datasets, surfacing key insights, performance anomalies, and optimization opportunities that might otherwise go unnoticed. With features like SmartEmail, stakeholders receive automated, AI-curated summaries of campaign performance directly in their inbox, saving hours of manual analysis and ensuring everyone stays aligned.
For marketers seeking to unlock the power of "real-time marketing automation", TapClicks is a game-changer. Its always-on data pipelines keep your dashboards current, enabling you to spot trends, adjust budgets, and optimize campaigns on the fly. This combination of robust data integration, scalable reporting, and intelligent automation positions TapClicks as the ultimate platform for marketing teams aiming to drive results through unified analytics.
To learn more about how TapClicks can transform your marketing intelligence, visit TapClicks.
Setting Up Your Multi-Channel Analytics Dashboard: Step-by-Step
Implementing a multi-channel analytics dashboard can seem daunting, but with the right approach, you’ll quickly move from fragmented data to unified, actionable insights. Here’s how to set up a comprehensive dashboard—such as the TapClicks analytics dashboard—that brings together all your marketing data for streamlined reporting and visualization.
1. Integrate Multiple Data Sources
Start by connecting all your key marketing and advertising platforms. Modern dashboards like TapClicks offer over 10,000 marketing, advertising, and business data connectors, supporting sources such as Google Ads, Meta (Facebook and Instagram), LinkedIn, programmatic DSPs, email platforms, and more. Simply select your data sources, authenticate accounts, and let the platform’s automated ETL/ELT pipelines extract, transform, and load data into your dashboard. For custom or niche sources, use built-in Smart Connectors to bring in spreadsheets, databases, or third-party APIs.
2. Configure Metrics and Visualizations
Next, define the metrics and KPIs most relevant to your business goals—think impressions, clicks, conversions, ROAS, or channel-specific actions. TapClicks’ drag-and-drop dashboard builder allows you to create custom widgets, charts, and tables, blending data across channels for omnichannel performance views. You can also normalize metrics for apples-to-apples comparisons, and segment data by campaign, location, or client for deeper analysis.
3. Set Up Automated and Scheduled Reporting
One of the major advantages of a unified dashboard is automating your reporting workflows. Configure scheduled reports to go out daily, weekly, or monthly to internal teams or clients. TapClicks supports branded reporting, customizable templates, and role-based access, ensuring each stakeholder receives the right data in the right format—whether a high-level executive summary or a detailed campaign breakdown.
4. Tailor Dashboards to Your Stakeholders
Different stakeholders need different views. Executives may prefer high-level KPIs and trends, while campaign managers need granular, channel-by-channel breakdowns. With TapClicks, you can create and assign role-based dashboards, ensuring each user only sees the data that matters to them. For agencies, this means building separate dashboards for each client, while brands can set up views by region, product line, or business unit.
5. Leverage Smart Features for Ongoing Optimization
Finally, turn on AI-powered features—such as TapClicks’ SmartPilot or SmartEmail—to automatically surface insights, flag anomalies, and deliver recommendations for optimization. Real-time alerts and automated summaries keep everyone informed and agile, reducing manual analysis and accelerating decision-making.
By following these steps, you’ll transform scattered marketing data into a unified analytics platform, paving the way for faster, smarter, and more impactful marketing decisions. For a deeper dive into what’s possible, check out the TapClicks analytics dashboard and see how easy it is to set up integrated marketing intelligence at scale.
Actionable Insights: Turning Unified Data Into Marketing Results
The true value of a multi-channel analytics dashboard lies not just in data collection, but in its ability to transform unified marketing data into actionable insights that directly impact performance. By leveraging automated marketing insights and smart visualizations, marketers move beyond static reports to dynamic, data-driven decision making.
Automated Insights for Smarter Decisions
Modern dashboards like TapClicks harness AI-powered analytics to automatically surface trends, anomalies, and optimization opportunities. Instead of manually sifting through endless spreadsheets, teams receive clear, prioritized recommendations—such as which campaigns are underperforming, where budget reallocations could yield higher ROI, or which audiences are most engaged. These automated insights drastically reduce the time lag between data collection and action, enabling marketers to pivot strategies in real time.
Optimizing Campaigns and Budget Pacing
With a consolidated view of performance across all channels, marketers can spot inefficiencies and double down on what works. For example, TapClicks’ dashboards let you monitor budget pacing and campaign health at-a-glance. If a paid search campaign is exceeding its cost-per-acquisition target, the dashboard flags this for immediate attention. Conversely, a social channel outperforming expectations can be scaled up with just-in-time budget adjustments. This level of continuous optimization is only possible when insights are unified, automated, and instantly accessible.
ROI Tracking and Predictive Analytics
A robust multi-channel dashboard does more than report on the past—it forecasts the future. TapClicks’ AI-driven features deliver predictive analytics, benchmarking current campaigns against historical data and industry standards. For instance, the system might recommend increasing spend on a campaign projected to outperform benchmarks, or alert you when results are likely to fall short, so you can intervene early. These predictive insights empower marketing teams to confidently allocate resources and maximize returns.
Real-World Example: From Data to Results
Imagine an agency managing dozens of client campaigns across search, social, display, and email. With TapClicks, all these data streams feed into a single, customizable dashboard. Automated alerts identify underperforming channels, while AI-generated summaries provide clear action steps—such as shifting budget, adjusting creative, or refining targeting. According to real-time marketing automation research, this kind of real-time, unified intelligence can reduce manual reporting workload and improve campaign ROI significantly.
By turning unified data into actionable marketing results, a solution like TapClicks empowers teams to operate proactively, not reactively—ensuring every marketing dollar is working harder and smarter.
How Different Teams Use Unified Marketing Dashboards
A multi-channel analytics dashboard isn’t just a “nice-to-have”—for agencies, brands, and enterprise marketing teams, it’s mission-critical. Here’s how each group puts unified reporting to work, driving better results, streamlining operations, and uncovering new opportunities.
Agencies: Reporting for Hundreds of Clients, Zero Headaches
Managing dozens (or even hundreds) of campaigns across platforms is a daily reality for agencies. Without a unified dashboard, reporting can be overwhelming and time-consuming.
How Agencies Benefit:
- Automated Data Collection: Pulls in data from thousands of marketing sources, eliminating manual exports.
- Branded Dashboards: Delivers custom, client-branded views for every account.
- Scheduled, Recurring Reports: Sends updates automatically—no more last-minute PowerPoint builds.
- Real-Time Performance Tracking: Monitors campaign results and KPIs instantly.
- Time Savings: Analysts often reclaim 50+ hours per month.
Result: Agencies increase client satisfaction with faster insights, while freeing up time to focus on strategy and growth.
Brands: One View for All Omnichannel Campaigns
Brands juggling multiple locations, products, or markets need a consolidated view of their marketing performance. Siloed tools create blind spots—unified dashboards erase them.
What Brands Can Do:
- Aggregate All Channels: Combine digital, social, search, offline, and programmatic data into one place.
- Track Cross-Channel KPIs: Instantly measure what’s working (and what’s not) across every touchpoint.
- Optimize Budgets: See spend and ROI by region, campaign, or product line.
- Benchmark Performance: Compare results across locations and time periods.
- Adapt Strategies Fast: Use real-time intelligence to pivot quickly.
Result: Brands maximize marketing impact and ensure every channel is pulling its weight.
Enterprise Teams: Connecting Marketing to the Business
For enterprise teams, the challenge is integrating marketing data with the broader business ecosystem—think BI, CRM, and finance systems. Unified reporting platforms like TapClicks make this seamless.
How Enterprises Win:
- Centralized Data Hub: Feeds enriched, normalized marketing data into BI tools and other platforms.
- Cross-Department Collaboration: Gives marketing, sales, and exec teams a single source of truth.
- Advanced Analytics: Supports media mix modeling, predictive analytics, and performance benchmarking.
- Faster Decision-Making: Empowers leaders to act on unified insights, not fragmented spreadsheets.
Result: Enterprise organizations get full transparency and agility—aligning marketing performance with business outcomes.
Bringing It All Together
Whether you’re managing hundreds of client dashboards, running national campaigns, or integrating marketing with business intelligence, a solution like TapClicks adapts to your scale and workflow. The outcome? Every stakeholder gets actionable insights, more time, and the confidence to drive measurable results.
Choosing the Right Multi-Channel Analytics Solution
Selecting the best multi-channel analytics dashboard is a strategic decision that can redefine your marketing operations and reporting efficiency. When evaluating solutions, consider these essential criteria:
1. Breadth of Data Integrations:
A robust dashboard platform should support a wide range of connectors—think Google, Meta, programmatic ad platforms, CRMs, and beyond. Greater integration breadth means you can truly unify all your marketing data, not just a subset.
2. Automation Capabilities:
Look for solutions that go beyond manual data pulls. Automated ETL (extract, transform, load) pipelines, scheduled reporting, and AI-powered insights save teams countless hours. TapClicks, for example, often reduces reporting workloads by over 50 hours per analyst per month—a major efficiency boost supported by its advanced dashboard automation features.
3. Customization & Scalability:
Your dashboard should allow flexible customization—drag-and-drop widgets, branded templates, and role-based access for different users. Scalability is vital for agencies with hundreds of clients or brands with multiple locations.
4. Intelligence & Insights:
Modern platforms should offer more than static charts. AI-driven insights, predictive analytics, and actionable recommendations elevate reporting from retrospective to proactive. TapClicks’ SmartPilot and SmartEmail are strong examples, automatically surfacing trends and optimization suggestions.
5. Reporting & Collaboration:
Automated, scheduled reporting and multi-client management support both internal teams and client transparency. Collaboration features—such as order management and workflow tools—streamline campaign execution.
How do leading platforms compare?
- Funnel.io and Supermetrics excel at data pipeline functionality but lack robust built-in dashboards and actionable insights.
- Adverity is strong on enterprise integrations but may require more technical setup and doesn’t offer built-in workflow or client reporting features.
- Agency Analytics and NinjaCat focus on lightweight agency reporting but may struggle with scaling to enterprise or multi-brand needs.
Why TapClicks Stands Out:
TapClicks uniquely combines unified data aggregation, customizable and scalable dashboarding, and advanced AI-powered insights—all within a single platform. Unlike pure data pipes or basic reporting tools, TapClicks is a true marketing operations hub: it not only centralizes cross-channel data but also automates reporting, surfaces actionable intelligence, and supports multi-team collaboration at scale. For organizations seeking to move beyond fragmented metrics and manual reporting, TapClicks delivers a comprehensive, future-ready solution for unified marketing intelligence.
Start Automating Your Marketing Data Today!
No Credit Card Required.

