

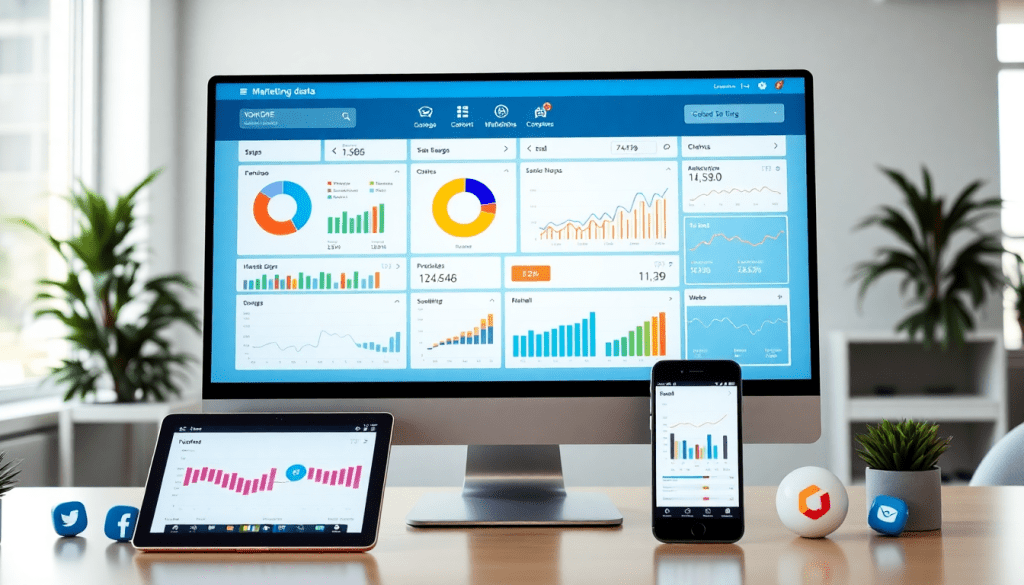
Multi-Channel Analytics Dashboard: Unified Marketing Insights
Marketing teams are managing more channels and data sources than ever before, making it harder to see the full picture of campaign performance. A multi-channel analytics dashboard brings everything together—delivering clear, actionable insights across every touchpoint and platform. This guide explores how unified reporting platforms like the TapClicks analytics dashboard drive smarter decisions, save time, and elevate ROI by aggregating, visualizing, and automating your marketing data.
What is a Multi-Channel Analytics Dashboard?
A multi-channel analytics dashboard is a centralized, visual platform that aggregates marketing performance data from multiple channels—such as social media, search, email, display, and more—into a single, unified interface. Its core purpose is to give marketers a comprehensive, real-time view of their campaigns, audiences, and outcomes across every digital touchpoint.
Traditionally, marketing teams have been forced to juggle siloed reports from each channel: Facebook Ads, Google Analytics, email platforms, programmatic display, and others. This fragmented approach leads to time-consuming manual data pulls, inconsistent metrics, and limited visibility into how channels interact. A multi-channel analytics dashboard solves this by automatically collecting, standardizing, and visualizing data from all these sources in one place.
Centralizing data offers several powerful benefits:
- Efficiency: Marketers save hours every week by eliminating manual exports and spreadsheet wrangling, focusing instead on strategy and optimization.
- Real-Time Visibility: Live dashboards allow instant tracking of performance shifts, enabling faster reactions to both opportunities and issues.
- Unified Marketing Intelligence: By connecting the dots between channels, teams gain holistic insights into customer journeys, campaign attribution, and ROI—fueling smarter, more coordinated decision-making.
For agencies and marketing teams managing complex, multi-client portfolios, the impact is even greater. Automation and centralization drive reporting consistency and client transparency at scale. To learn more about these benefits in the agency context, explore how marketing dashboard automation boosts reporting efficiency.
In essence, a multi-channel analytics dashboard is the marketer’s command center—bringing clarity, speed, and actionable intelligence to today’s cross-channel landscape.
What Makes a Reporting Platform Truly Unified?
A reporting platform shouldn’t just show campaign data—it should help you integrate, visualize, and take action across every marketing channel. Here’s what separates a best-in-class unified analytics dashboard from the rest:
Effortless Data Integration
- Thousands of Connectors: Instantly pull in data from social, search, email, display, and more—no more manual spreadsheets.
- Automated ETL: Data is extracted, transformed, and loaded automatically, so dashboards always reflect up-to-date, apples-to-apples metrics.
- Normalization & Enrichment: Blend disparate sources and ensure consistency for reliable cross-channel reporting.
Flexible, Custom Dashboards
- Drag-and-Drop Interface: Easily build and tweak dashboards for specific campaigns, clients, or KPIs.
- Custom Branding: White-label your reports—vital for agencies managing multiple clients.
- Automated Delivery: Schedule reports to send directly to stakeholders, saving analyst time and ensuring everyone gets the latest insights.
Visual Insights at a Glance
- Integrated Visualization Tools: Instantly compare performance across platforms, channels, or locations.
- Budget & Pacing Tracking: Monitor spend and ROI in real time.
- Trend Spotting: Quickly identify what’s working and where to optimize using color-coded, intuitive visuals.
Omnichannel, Multi-Platform Reporting
- Unified View of the Customer Journey: See every touchpoint—no more siloed metrics.
- Cross-Platform Optimization: Make informed decisions about spend and creative, grounded in comprehensive, real-time analytics.
Built for Automation & Efficiency
- Automated Analytics: Streamline everything from data gathering to report generation with built-in automation.
- Workflow Integration: Eliminate repetitive tasks, reduce errors, and free up your team to focus on strategy, not data wrangling.
- Time Savings: Analysts can reclaim 50+ hours a month on reporting alone.
Why It Matters
A unified reporting platform should do more than just “show the numbers.” It should:
- Connect all your marketing data in one place
- Contextualize performance with smart visualizations
- Clarify next steps by surfacing actionable insights
Want to see these features in action? Discover how TapClicks brings it all together for agencies, brands, and enterprises.
How Cross-Channel Marketing Analytics Powers Smarter Decisions
Siloed marketing analytics—where data lives in separate platforms for social, search, email, and display—creates blind spots that hinder optimization. Cross-channel analytics, by contrast, brings all your data streams together in one unified dashboard, empowering teams to see the complete picture of campaign performance and customer journeys.
With a multi-channel analytics dashboard, marketers can track performance holistically across touchpoints. For example, you might notice that a spike in branded search conversions actually correlates with a recent surge in paid social impressions—insights that would be missed if those channels were analyzed in isolation. By aggregating data from every channel, these dashboards help you identify trends, attribution paths, and bottlenecks, making it easier to allocate budget where it delivers the greatest impact.
Unified analytics also streamline decision-making. Instead of manually exporting reports and wrangling spreadsheets from different platforms, teams get real-time, normalized data within a single interface. This automation not only saves hours of tedious work, but also reduces errors and ensures everyone—from analysts to executives—works from the same source of truth.
The difference is clear: siloed analytics deliver fragmented, lagging insights, while unified, cross-channel workflows enable agile optimization. With a platform like the TapClicks analytics dashboard, marketers can quickly surface which channels drive the best ROI, spot underperforming campaigns, and pivot strategy in real time—fueling smarter, more confident marketing decisions.
Automated Marketing Insights: Going Beyond the Usual Reports
Static, backward-looking reports just can’t keep up with the speed and complexity of modern marketing. Automated marketing insights, on the other hand, are transforming how teams work—turning raw data into real-time, actionable guidance.
Why Static Reports Fall Short
- Manual, time-consuming: Often require hours just to compile.
- Lag in action: By the time you see an issue, it may be too late to fix.
- Siloed visibility: Hard to spot cross-channel trends or anomalies.
How Automation Changes the Game
Automated insight platforms—like TapClicks—bring new capabilities to the table:
1. Real-Time Trend Detection
- Instantly surface sudden spikes or dips in KPIs (e.g., click-through rates, conversions).
- Highlight underperforming channels before they drain your budget.
- Flag pacing issues so you can adjust spend before the month ends.
2. AI-Powered Recommendations
- TapClicks predictive analytics look ahead, not just backwards.
- Get suggestions for optimal budget allocation and channel mix.
- Benchmark your campaigns against industry averages—see where you’re leading or lagging.
3. Actionable Alerts and Summaries
- Automated alerts notify you the moment something important happens.
- With SmartEmail, stakeholders get scheduled, AI-curated insight summaries—no need to dig through dashboards.
- Each summary highlights wins, risks, and next best actions, keeping everyone aligned.
What This Means for Your Team
Here’s how automated insights impact daily marketing operations:
| Challenge | How Automation Helps |
|---|---|
| Missed anomalies | Instant alerts catch issues early |
| Slow reporting cycles | Scheduled summaries save hours each week |
| Siloed decision-making | Unified insights keep teams and clients aligned |
| Reactive campaign tweaks | Proactive, data-backed optimization |
From Reporting to Optimization
With TapClicks automated insights:
- Analysts spend more time optimizing, less time compiling.
- No more scrambling to explain last month’s results—be ready to act today.
- Teams move from simply reporting outcomes to actively improving them, channel by channel.
Bottom line: Automation lets marketers and agencies focus on strategy, not spreadsheets—driving better results, faster.
See Your Marketing ROI Clearly—In Real Time
A dashboard is more than just a collection of metrics—it’s your window into what’s working, what’s not, and where your marketing dollars are truly making an impact. In today’s landscape, instant clarity is essential for both brands and agencies.
Why Unified ROI Tracking Matters
- Single Source of Truth: Automatically combines data from all sources—paid search, social, display, email, and more—into one view.
- Outcome-Focused: Connects investments directly to outcomes like leads, conversions, and sales.
- Custom KPIs: Lets you track the metrics that matter most to your business, so your dashboard evolves with your strategy.
What You Get with Campaign Performance Visualization
No more wrestling with spreadsheets or static PDF reports. Powerful visualization tools help you:
- Instantly spot top-performing channels and creative,
- Uncover underperforming tactics before they drain budget,
- Detect meaningful trends with heat maps, geo charts, time-series graphs, and more,
- Benchmark against past campaigns or industry standards for smarter planning.
| Visualization Type | What It Shows | Example Use Case |
|---|---|---|
| Heat Map | Regional engagement/activity | Optimize spend by location |
| Time-Series Graph | Conversions, revenue, or spend over time | See campaign momentum and pacing |
| Multi-Channel Comparison | Performance side by side | Identify which channels drive the most ROI |
Real-Time Analytics: No More Waiting
Move from periodic, manual reporting to always-on, real-time insights:
- Automated Data Collection: All your channels sync continuously—no more lag time.
- Immediate Optimization: Identify what’s working and adjust campaigns on the fly.
- Stakeholder Alignment: Everyone from CMO to account manager sees the same up-to-date numbers.
Curious how automated data collection powers this? Learn more about real-time marketing data collection →
The Real Impact: Faster, Smarter Decisions
A high-clarity dashboard means:
- Total transparency across campaigns and clients,
- Rapid, data-driven decisions at every level,
- Maximum performance and profitability—even as complexity rises.
When ROI tracking and campaign visualization are baked into your analytics workflow, every marketing dollar works harder—and every team member has the confidence to act.
TapClicks Analytics Dashboard: Unified Intelligence at Scale
What distinguishes the TapClicks analytics dashboard in a crowded landscape of reporting tools is its singular focus on unified intelligence at scale. Built as an all-in-one marketing operations platform, TapClicks goes far beyond traditional dashboards by seamlessly integrating data from over 10,000 marketing, advertising, and business sources. This robust connectivity empowers agencies, brands, and enterprise teams to create a true single source of truth—no more toggling between siloed platforms or wrangling disparate spreadsheets.
Integrated Data Connectors and Smart Automation
TapClicks’ proprietary connectors and Smart Connectors automate the entire ETL/ELT process, extracting, transforming, and loading campaign data from any channel—social, search, display, email, and beyond. This means marketers can blend and normalize data across vendors, locations, or clients, ensuring apples-to-apples comparisons and holistic performance tracking. Workflows that once took hours or days are now handled in minutes, dramatically reducing the reporting burden.
Scalable Reporting and Customization at Every Level
Unlike lightweight point solutions, TapClicks is engineered for scale. Whether you’re managing reporting for hundreds of clients or dozens of business units, TapClicks supports thousands of dashboards and automated, fully branded reports—delivered on-demand or scheduled to stakeholders. Customizable dashboard templates and drag-and-drop widgets let teams visualize KPIs, budget pacing, and campaign performance in the format that fits their unique needs.
Advanced Workflow Tools for Team Collaboration
TapClicks doesn’t stop at analytics. Its integrated workflow and order management tools streamline the full campaign lifecycle, from sales and ops to fulfillment. Role-based access and centralized order routing make it easy to collaborate across teams, ensuring everyone is working from the latest data. For agencies, this means faster client onboarding and more efficient handoffs between sales and account management. For brands and enterprises, it means marketing, finance, and BI teams can all rely on unified, up-to-date intelligence.
Empowering Smarter Decisions Across the Organization
With AI-powered insights, predictive models, and automated alerts, TapClicks surfaces not just data, but the “why” behind performance trends—helping teams move quickly from information to action. Whether you’re benchmarking ROI across channels or optimizing spend in real time, TapClicks delivers the unified analytics backbone today’s high-performing marketing teams need.
In short, the TapClicks analytics dashboard is more than a reporting tool—it’s a marketing OS built for the complexity and scale of modern, multi-channel environments. By connecting, visualizing, and automating the entire analytics workflow, TapClicks empowers organizations to unlock smarter, faster, and more impactful marketing decisions.
Implementing a Multi-Channel Dashboard: Best Practices
A multi-channel analytics dashboard is only as powerful as the strategy and structure behind it. Successful implementation requires thoughtful planning, stakeholder alignment, and a focus on continuous optimization. Here’s how to set up your dashboard for maximum impact:
1. Start with a Clear Data Strategy
Begin by mapping out your marketing data ecosystem. Identify all relevant channels—social, search, email, programmatic, and more—and clarify which metrics matter most to your business goals. Outline how each data source (Google Ads, Facebook, CRM, web analytics, etc.) will flow into your dashboard. Prioritize trusted, automated connectors to minimize manual data entry and maximize accuracy.
2. Select the Right Data Connectors
Choose a platform with robust, pre-built connectors that can handle the scale and complexity of your marketing stack. For example, the TapClicks analytics dashboard offers over 10,000 integrations, ensuring seamless ingestion from virtually any advertising, social, or business platform. Use custom connectors where needed to capture niche or proprietary data sources, and plan for ongoing data hygiene.
3. Design Insightful Visualizations
Effective dashboards balance high-level overviews with the ability to drill down into details. Use customizable widgets, charts, and tables to highlight KPIs by channel, campaign, or location. Incorporate benchmarking and pacing visuals to track performance against goals. Lean into best practices: keep layouts clean, use color strategically, and make comparisons easy for users at every level.
4. Streamline Onboarding and Roles
Early and thorough onboarding sets the stage for adoption. Define user roles—analysts, marketers, executives, clients—and tailor dashboard views and access accordingly. Offer training sessions and self-serve guides to help your team get comfortable with new reporting workflows. TapClicks, for example, supports role-based access for agencies, brands, and enterprise teams, making it simple to deliver the right insights to the right stakeholders.
5. Foster Collaboration and Feedback
Encourage open communication between marketing, analytics, and ops teams. Use your dashboard as a central hub for campaign updates, performance reviews, and optimization discussions. Regularly solicit feedback to ensure the dashboard evolves with your organization’s needs.
6. Optimize and Scale Over Time
Don’t set and forget. Schedule periodic reviews to refine data sources, add new metrics, and update visualizations as strategies shift. Leverage automation—like scheduled reports and AI-generated insights—to scale your analytics efforts without the manual lift. As your organization grows, ensure your dashboard infrastructure can accommodate more users, data, and increasingly sophisticated analysis.
By following these best practices, organizations can ensure their multi-channel analytics dashboard not only delivers unified marketing insights but also drives greater adoption, collaboration, and business impact across teams.
Choosing the Right Platform for Omnichannel Analytics
Selecting the best platform for omnichannel analytics is a pivotal decision for marketing teams aiming to unify their data and maximize the value of their efforts. The ideal solution must meet your organization’s current needs and grow with you as marketing channels, data sources, and business objectives evolve. Here are the key criteria and considerations for making the right choice:
1. Scalability for Growth
Your analytics platform should seamlessly accommodate increasing data volumes, user counts, and reporting demands. Solutions like TapClicks excel here, managing thousands of dashboards and clients without performance tradeoffs—a necessity for agencies, multi-location brands, and enterprise teams.
2. Customization and Flexibility
No two marketing organizations are exactly alike. Look for platforms that offer fully customizable dashboards, reporting templates, and visualization options. This flexibility ensures you can tailor analytics to specific client needs, business goals, or campaign objectives, rather than being locked into rigid, one-size-fits-all reports.
3. Automation and Workflow Integration
Manual reporting is not only time-consuming but also prone to error. Prioritize solutions with robust automation capabilities: scheduled data refreshes, automated report generation, and alerting. Integrated workflow tools further streamline processes, making it easy for teams to collaborate, track orders, and action insights quickly.
4. Broad Integration Ecosystem
A true omnichannel analytics platform should connect effortlessly with the wide range of data sources you rely on—social, search, display, CRM, e-commerce, and more. Platforms with pre-built and custom connectors help eliminate data silos and reduce the complexity of onboarding new sources, ensuring all marketing data is available in one place.
5. Expert Support and Training
The transition to unified analytics can be daunting. Choose a provider that offers comprehensive onboarding, responsive support, and resources for ongoing education. This ensures your team can unlock the full power of the platform and adapt as your reporting needs change.
Overcoming Common Challenges
Many marketing teams struggle with siloed data, fragmented reporting, and the complexity of managing multiple tools. A unified platform directly addresses these pain points by:
- Eliminating data silos: Centralizing all channels for a single source of truth.
- Reducing manual work: Automating repetitive tasks, freeing analysts for higher-value insights.
- Simplifying complexity: Intuitive dashboards and workflows make advanced analytics accessible to all stakeholders.
Future-Proofing Your Marketing Intelligence
The marketing landscape will only grow more complex. Choosing a platform that offers scalability, customization, and continuous innovation (such as AI-driven insights and predictive analytics) ensures your analytics foundation is built to last. By investing in the right omnichannel analytics solution now, you empower your team to adapt, optimize, and outperform—no matter how the channels or data sources evolve.
Start Automating Your Marketing Data Today!
No Credit Card Required.

