

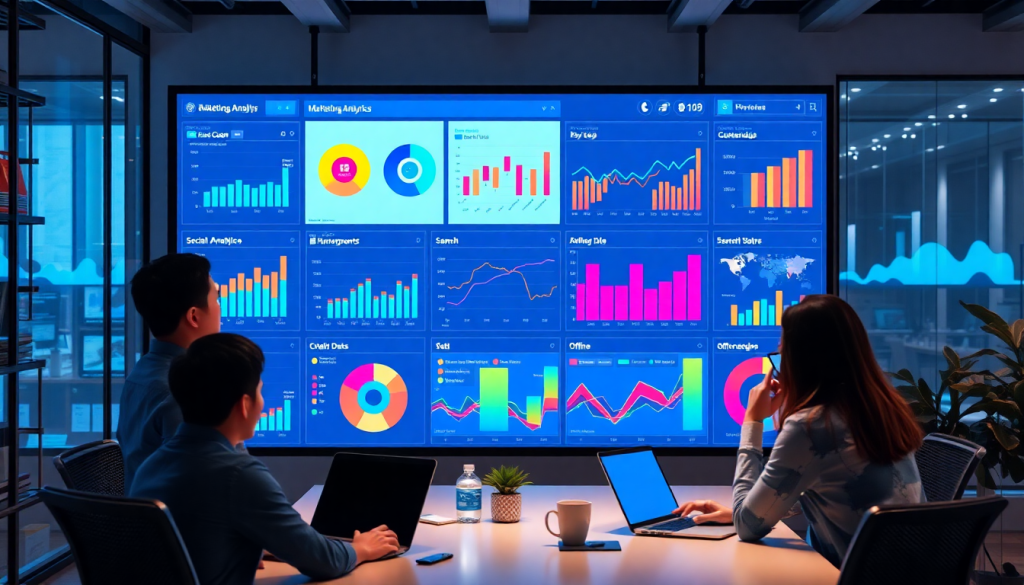
Multi-Channel Analytics Dashboard: Unified Marketing Insights
Marketing teams today are expected to track performance across a growing number of channels, platforms, and touchpoints. But managing siloed data and disparate reports can quickly become overwhelming—and makes it hard to see the full story. A multi-channel analytics dashboard solves this by aggregating your marketing data, delivering real-time, actionable insights, and visualizing campaign performance in a single unified hub. This guide explores how unified reporting platforms like the TapClicks analytics dashboard empower organizations to make smarter, faster decisions and maximize marketing ROI.
What Is a Multi-Channel Analytics Dashboard?
A multi-channel analytics dashboard is a centralized platform that aggregates and visualizes marketing performance data from a wide array of sources—think social media, search ads, email campaigns, programmatic display, and even offline channels like direct mail or events. In today’s complex marketing landscape, where customer journeys cross multiple platforms and touchpoints, the essential role of such a dashboard is to break down data silos and provide a unified view of all your campaigns in one place.
Instead of toggling between multiple analytics tools—each with its own interface, metrics, and reporting quirks—a multi-channel analytics dashboard brings all your data together. This unified reporting approach is invaluable for both agencies managing hundreds of client campaigns and brands running integrated, cross-channel strategies. For agencies, it simplifies client communication and scales effortlessly as their book of business grows. For brands, especially those with multiple locations or product lines, it offers a consolidated pulse on performance and budget allocation.
Typical data types tracked include impressions, clicks, conversions, spend, cost-per-acquisition (CPA), social engagement metrics, email open and click rates, and offline conversion data. By unifying these metrics, marketers gain holistic insights into campaign effectiveness, channel attribution, and return on investment (ROI). This empowers marketing teams to move beyond surface-level reporting and start making data-driven decisions that optimize spend and maximize impact.
With platforms like the TapClicks analytics dashboard, organizations can seamlessly integrate data from over 10,000 sources, visualize results in real time, and unlock actionable insights—all within a single, customizable interface. This not only streamlines workflow, but also transforms the way marketing teams analyze, optimize, and communicate results to stakeholders.
Benefits of Unified Marketing Data Aggregation
Managing marketing data across dozens of channels—think Google Ads, Facebook, programmatic display, email, local directories, and more—can consume hours each week. Manually logging into each platform, exporting spreadsheets, and merging reports not only drains resources but also delays decision-making. Unified marketing data aggregation transforms this process by automatically pulling, normalizing, and integrating all your marketing metrics into a single dashboard.
Save Time, Reduce Errors, and Streamline Workflows
By automating data collection, marketing teams reclaim valuable hours previously spent on repetitive tasks. No more toggling between platforms or risking copy-paste mistakes. Instead, marketers can rely on a centralized hub where fresh data from all sources is always up to date. According to TapClicks customers, this automation can save each analyst 50+ hours per month—time that can be reinvested in campaign strategy and optimization.
Cross-Channel Clarity for Smarter Analysis
When data lives in silos, it’s nearly impossible to understand how campaigns are working together or competing for budget. Unified dashboards enable side-by-side comparison of metrics from search, social, display, email, and even offline channels. This cross-channel visibility lets marketers identify which touchpoints drive conversions, where to adjust spend, and how to coordinate messaging for maximum impact.
Faster, More Informed Decision-Making
With all your marketing data aggregated and visualized in one place, insights and optimization opportunities surface faster. Teams can spot underperforming channels, shifting trends, and areas for reallocation—often before competitors even notice. Unified data also supports more strategic reporting, making it easier to demonstrate ROI to stakeholders and clients.
TapClicks: Data Aggregation at Scale
TapClicks stands out as a leader in marketing data aggregation, offering over 10,000 pre-built connectors and automated ETL/ELT pipelines that blend, normalize, and enrich data from virtually any source. This unified approach doesn’t just eliminate data silos—it powers advanced workflow automation, so teams can focus on what matters most: driving results.
To explore how automated data collection can unlock real-time marketing and accelerate performance, check out "Unlocking Real-Time Marketing: The Power of Automated Data Collection".
Unified data aggregation is the foundation for faster insights, greater efficiency, and smarter strategy—enabling marketers to do more with less and maximize every dollar invested. Learn more about TapClicks’ unified analytics solutions at tapclicks.com.
Key Features of a Performance Tracking Dashboard
A modern performance tracking dashboard is more than just a collection of charts—it’s the nerve center of your marketing analytics, designed to deliver insights that drive impact. The most effective dashboards combine flexibility, automation, and intelligence to empower teams to act quickly and confidently. Here are the essential features that set a best-in-class multi-channel analytics dashboard apart:
Drag-and-Drop Dashboarding: Intuitive, no-code interfaces let users build custom dashboards tailored to specific campaigns, clients, or business units. With flexible widgets, marketers can visualize KPIs, compare cross-channel performance, and surface trends—all without needing IT support.
Custom Visualizations: From interactive graphs and heatmaps to funnel views and attribution models, robust dashboards offer a wide variety of visualization options. This flexibility ensures that every stakeholder—whether executive, analyst, or client—can easily interpret complex marketing data.
Scheduled and Automated Reporting: Automated report generation and delivery eliminate the manual burden of pulling data and building slide decks. With a platform like TapClicks, you can set up recurring, branded reports that are emailed directly to stakeholders, keeping everyone informed and aligned in real time.
Role-Based Access Control: Data security and relevance are critical, especially for agencies and multi-brand organizations. Role-based access ensures users see only what matters to them—clients view only their campaigns, while internal teams have a holistic view across all channels and accounts.
Campaign Performance Visualization & ROI Tracking: Advanced dashboards tie spend, impressions, conversions, and revenue together, enabling marketers to monitor ROI across all channels from a single pane of glass. Budget pacing tools, goal tracking, and anomaly detection help teams proactively manage performance.
Automated Marketing Insights & AI-Powered Recommendations: The most powerful dashboards don’t just display data—they interpret it. Built-in AI analyzes campaign performance, highlights trends, and generates actionable recommendations for optimization. This allows teams to move from data to decision faster, with confidence in their next steps.
To explore more ways automation and dashboard design can supercharge your analytics, see "Boost Analytics Reporting".
These features are at the core of platforms like TapClicks, enabling marketers to unify data, streamline reporting, and unlock insights that fuel growth.
How TapClicks Unifies Multi-Channel Reporting
TapClicks sets itself apart as a leader in multi-channel analytics by offering an exceptionally robust and unified approach to marketing data integration. Through its expansive library of over 10,000 data connectors, TapClicks seamlessly aggregates metrics from virtually any marketing platform—social media, search engines, email marketing tools, display advertising, offline sources, and more. This means agencies and brands no longer need to juggle multiple exports, spreadsheets, or logins to piece together their performance picture.
With the TapClicks analytics dashboard, all your marketing data flows into a single, intuitive interface. Whether you’re running campaigns across Google Ads, Facebook, programmatic display, TikTok, or even offline events, TapClicks collects, normalizes, and harmonizes these metrics for you. This eliminates silos and ensures your team is always working with the latest, most accurate numbers.
For agencies, this unified platform is invaluable: it supports high-volume, multi-client reporting at scale, with role-based access so you can control what each client or team member sees. Brands—especially those with multiple store locations or product lines—benefit from consolidated views that allow for granular, location-by-location or campaign-by-campaign analysis. Enterprise marketing teams, meanwhile, use TapClicks as a centralized data hub, piping cleaned and enriched data into BI tools or CRMs as needed.
Real-world use cases highlight TapClicks’ flexibility and scalability. Agencies managing hundreds of clients can automate reporting and drastically reduce manual workload, while brands gain a holistic view of cross-channel performance to optimize spend and strategy. The power of the TapClicks analytics dashboard lies in its ability to make complex, multi-platform reporting software simple, actionable, and truly scalable.
To learn more about how TapClicks can unify your marketing reporting and support smarter decision-making, visit TapClicks.
Visualizing Campaign Performance Across Channels
A multi-channel analytics dashboard isn’t just about collecting data—it’s about turning that data into clear, actionable visualizations that tell the full story of campaign performance. By consolidating all your marketing channels into a single, unified dashboard, teams can effortlessly detect trends, pinpoint outliers, and benchmark performance across campaigns and platforms.
With platforms like the TapClicks analytics dashboard, users can create custom views tailored to their unique needs. Want to see high-level results by marketing channel? Drill down into specific campaigns for a particular client? Compare performance by region or location? TapClicks enables you to pivot your data in real time, ensuring every stakeholder—from the CMO to the campaign manager—gets the insights most relevant to their goals.
Integrated marketing metrics—such as impressions, clicks, conversions, and spend—are displayed side-by-side, making it easy to assess ROI and budget effectiveness across channels like paid search, social, display, email, and even offline media. This omnichannel perspective is essential for understanding not only what’s working, but why, and where optimization opportunities exist.
By surfacing cross-channel benchmarks and isolating anomalies, unified dashboards empower marketers to act quickly. If one ad set is underperforming compared to others, or if a specific channel is driving outsized results, these insights are immediately visible. The result is a smarter, faster path to campaign optimization and, ultimately, greater marketing ROI.
Automated Insights & Marketing Intelligence Reporting
The sheer volume of marketing data generated across multiple channels can overwhelm even the most seasoned analysts. That’s where automation and AI-driven intelligence in unified dashboards become game-changers. Rather than spending hours sifting through raw numbers, teams can rely on platforms like TapClicks to surface key insights, uncover trends, and deliver actionable recommendations automatically.
TapClicks leverages advanced AI agents and automation to power smart reporting. With features like scheduled reports, stakeholders receive up-to-date performance summaries without lifting a finger—ensuring that clients and internal teams are always in sync. Even more impactful is the platform’s AI-generated insight summaries (via SmartEmail), which distill complex multi-channel campaign results into simple, digestible takeaways. These automated insights don’t just highlight what happened—they pinpoint why, and what to do next, all within the analytics dashboard.
Predictive analytics and benchmarking models further extend TapClicks’ value by proactively flagging anomalies, pacing issues, or budget optimization opportunities. Instead of reacting to problems after the fact, marketers can take decisive action in real time. This level of automation drastically reduces manual workload, minimizes reporting errors, and empowers teams to focus on higher-value strategy and creative execution.
By harnessing automated intelligence, agencies and brands alike can move from reactive reporting to proactive optimization—giving them a true competitive edge. For a deeper dive into how automation is transforming reporting efficiency, see "Marketing Dashboard Automation: Boost Agency Reporting Efficiency".
Choosing the Right Unified Reporting Platform
Selecting the best multi-channel analytics dashboard for your organization is a strategic decision with long-term impact on your marketing effectiveness. With a growing landscape of reporting solutions, it’s essential to weigh several key factors before committing to a platform.
Scalability: As your marketing operations grow—whether through additional clients, channels, or campaigns—your analytics dashboard must scale seamlessly. Look for solutions like TapClicks that are purpose-built to handle thousands of dashboards, reports, and users without sacrificing speed or reliability. This is especially critical for agencies and enterprise teams managing complex, high-volume reporting environments.
Breadth of Data Connectors: The value of unified analytics depends on how much of your marketing ecosystem you can bring together. A robust platform should offer extensive integrations—not just with major networks like Google Ads, Meta, and LinkedIn, but also with email providers, offline channels, and niche platforms. For example, TapClicks stands out by connecting to over 10,000 marketing, advertising, and business data sources, ensuring comprehensive visibility across your entire marketing stack.
Ease of Use and Customization: An effective unified reporting platform should empower users of all technical backgrounds. Prioritize features like drag-and-drop dashboarding, intuitive report editors, and customizable visualizations. TapClicks, for instance, offers a branded reporting studio and tailored dashboards for different clients, teams, or campaigns, making it easy to adapt insights to specific business needs.
Automation and AI-Driven Insights: Efficiency gains and smarter decisions come from automated reporting, scheduled insights delivery, and AI-powered recommendations. Platforms that reduce manual effort—such as TapClicks’ SmartEmail for automated insight summaries—help marketing teams focus on strategy rather than data wrangling.
Support and Onboarding: Strong customer support, onboarding resources, and ongoing training are vital for long-term success. Make sure your chosen platform offers responsive assistance and clear documentation as you grow with the tool.
How TapClicks Compares: When benchmarked against other multi-platform reporting software—such as Funnel.io, Adverity, Datorama, or Agency Analytics—TapClicks excels in unified scale, depth of data integration, workflow automation, and actionable AI insights. Many alternatives either specialize in lightweight reporting or function as pure data pipelines, lacking the all-in-one operational capabilities that TapClicks delivers. For a closer look at TapClicks’ offerings and how they stack up, visit the TapClicks website.
Evaluation Guidance: When choosing your unified analytics solution, consider:
- The number and type of marketing channels you need to support.
- The complexity of your reporting—do you need multi-location, multi-client, or cross-channel analytics?
- Internal resources available for setup, maintenance, and analysis.
- The importance of brandable dashboards and report automation for your stakeholders.
By thoughtfully assessing these criteria, you’ll be well-positioned to select a unified reporting platform that accelerates marketing performance and delivers real business value.
Getting Started with TapClicks Analytics Dashboard
Adopting a unified analytics and reporting platform like TapClicks can transform the way your marketing team measures, optimizes, and communicates performance. Here’s how to get started with TapClicks and set your organization up for actionable insights from day one:
1. Connect Your Data Sources
Begin by leveraging TapClicks’ library of over 10,000 marketing, advertising, and business data connectors. Whether you’re tracking social, search, display, email, or offline channels, TapClicks’ intuitive onboarding lets you securely connect all your platforms in just a few clicks. For specialized or proprietary data, Smart Connectors make it easy to ingest custom datasets without IT bottlenecks.
2. Build Your First Dashboard
With data flowing in, use TapClicks’ drag-and-drop dashboard builder to create tailored views for campaigns, channels, clients, or locations. Choose from a robust set of visualization options—charts, tables, maps, and more—to surface the KPIs that matter most. TapClicks’ white-labeling and customization ensure your dashboards reflect your brand and reporting style.
3. Automate Reports and Insights
TapClicks empowers you to schedule recurring reports that are automatically delivered to internal teams or clients—eliminating manual effort and ensuring timely updates. Activate SmartEmail to receive AI-generated summaries of campaign performance directly in your inbox. For deeper insights, leverage predictive analytics and custom alerts to stay ahead of trends and optimize spend in real time.
4. Onboard Your Team and Clients
Ensure a smooth rollout by assigning role-based access, so every stakeholder sees only the data relevant to them. TapClicks’ collaborative environment makes it easy to share dashboards, annotate results, and streamline communication between marketing, sales, and fulfillment teams.
5. Explore, Learn, and Optimize
TapClicks offers extensive support, training resources, and a responsive customer success team to help you get the most from your analytics investment. Encourage your team to experiment with custom dashboards and advanced features—like campaign scoring and budget pacing—to unlock new levels of efficiency and performance.
Experience the TapClicks Advantage
Ready to transform your marketing analytics? Explore a TapClicks demo or start your free trial to see how unified reporting can accelerate your business impact. Organizations that embrace integrated analytics and automated reporting consistently realize faster decision-making, improved ROI visibility, and significant time savings across the board.
By following these steps, you’ll empower your team with a single source of marketing truth—turning complex, multi-channel data into clear, actionable insights for growth.
Start Automating Your Marketing Data Today!
No Credit Card Required.

