

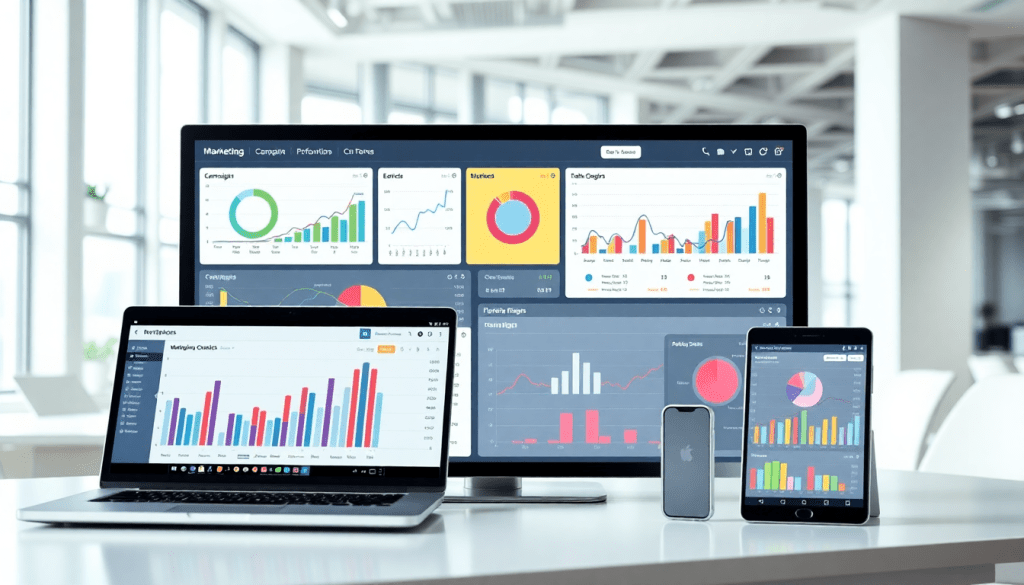
Multi-Channel Analytics Dashboard: Unified Marketing Insights
For marketing teams and agencies handling campaigns across multiple platforms, keeping data unified and actionable can feel impossible. A multi-channel analytics dashboard transforms that chaos into clarity by aggregating data, automating insights, and revealing the true performance of every channel—side by side, in real time. With TapClicks, you get more than just a dashboard; you unlock a powerful, unified reporting platform that empowers you to visualize campaign performance, track ROI, and optimize strategy at scale. Here’s what to consider for building, using, and getting the most from a multi-channel analytics dashboard.
What Is a Multi-Channel Analytics Dashboard?
A multi-channel analytics dashboard is a centralized digital interface that aggregates, visualizes, and analyzes marketing data from multiple platforms—such as Google Ads, Facebook, LinkedIn, programmatic display, and offline channels—into a single, unified view. Its core purpose is to help marketers and agencies see the full picture of campaign performance across all channels, eliminating the need to toggle between siloed tools or manually stitch together spreadsheets.
Unlike single-channel analytics, which only report on one platform at a time, or basic cross-channel analytics that summarize performance from a handful of sources, a true multi-channel (or omnichannel) analytics solution offers side-by-side, apples-to-apples comparisons across any number of platforms. This enables marketers to track the customer journey, understand attribution, and identify which channels are driving results at every stage of the funnel.
The shift toward unified reporting platforms is now essential for modern marketers. As campaigns span more channels and data sources—from search to social, email to web, and beyond—the complexity and volume of marketing data have exploded. Without centralized reporting, it’s nearly impossible to measure ROI, optimize quickly, or communicate clear results to stakeholders and clients.
By consolidating data into a single dashboard, marketing teams unlock major benefits:
- Data aggregation: All your performance metrics, KPIs, and custom calculations are pulled into one place automatically, reducing manual effort and risk of error.
- Real-time insights: Dashboards update as new data flows in, allowing teams to spot trends, outliers, and opportunities as soon as they happen.
- Centralized reporting: Teams and clients access the same source of truth, making collaboration and decision-making far more efficient.
With platforms like TapClicks, multi-channel analytics dashboards become more than just a reporting tool—they serve as the operational core for marketing teams, empowering smarter strategy and faster results at scale.
Key Features and Capabilities of Multi-Channel Dashboards
A robust multi-channel analytics dashboard is more than just a collection of charts—it’s a dynamic command center that unlocks deeper marketing intelligence and performance optimization. Here’s what sets the best platforms apart:
1. Comprehensive Data Connectors:
The foundation of any true multi-channel dashboard is seamless data integration. Top solutions like TapClicks offer thousands of pre-built data connectors, enabling you to pull metrics from advertising networks, social channels, CRMs, email platforms, and more. These connectors automate the ETL/ELT process, blending disparate datasets into a unified view without manual wrangling.
2. Campaign Performance Visualization:
Visualizing campaign performance across channels is essential for rapid analysis and agile decision-making. Multi-channel dashboards provide intuitive, drag-and-drop interfaces to build tailored views of KPIs, trends, and benchmarks. You can quickly compare Google Ads, Facebook campaigns, programmatic, and offline channels—all side by side—to pinpoint what’s working and where to adjust.
3. ROI Tracking Dashboards:
A central benefit is the ability to track return on investment (ROI) at every level, from high-level portfolio views to granular campaign or creative analysis. With real-time data refreshes and customizable widgets, marketers and agencies can monitor spend, conversions, and revenue impact—empowering smarter budget allocation.
4. Automated Marketing Insights:
Modern dashboards don’t just display data—they interpret it. AI-driven features like TapClicks’ SmartPilot and SmartEmail agents automatically analyze trends, surface anomalies, and deliver actionable recommendations directly to your inbox or dashboard. This transforms reporting from a backward-looking task into a forward-looking optimization engine.
5. Integrated Marketing Metrics and Intelligence Reporting:
Combining data from multiple platforms isn’t enough; you also need unified metrics and cross-channel intelligence. Advanced dashboards normalize and enrich data, allowing you to create holistic attribution models, unified cost-per-action calculations, and standardized performance reports—critical for organizations managing multi-location or multi-client campaigns.
6. Scalable, Actionable Analytics:
Whether you’re an agency with hundreds of clients or a brand with dozens of locations, scalability is key. Platforms like TapClicks are engineered to handle thousands of dashboards and users without sacrificing speed or customization. Role-based access, templated reporting, and automated workflows streamline collaboration and ensure everyone—from analysts to executives—has the insights they need.
For agencies, especially, dashboard automation translates directly into efficiency gains. By automating routine reporting and insights delivery, teams can spend less time on manual data pulls and more time on strategy. To see how this works in practice, explore how TapClicks dashboard automation boosts agency reporting efficiency.
In short, the right multi-channel analytics dashboard brings together data connectors, campaign visualization, ROI tracking, and automated intelligence to create a single, powerful source of truth for your marketing operations.
Aggregating Marketing Data Across Channels
One of the biggest challenges in modern marketing is the sheer volume, variety, and fragmentation of data. Each platform—Google Ads, Facebook, LinkedIn, programmatic display, email, and more—generates its own performance metrics, often in different formats and with unique naming conventions. This creates data “silos” that make it difficult to see the full picture, compare results across channels, or generate insights quickly. Manual data collection and integration is not only time-consuming but also prone to human error, leading to inconsistent or outdated reporting.
A unified reporting platform like TapClicks simplifies the entire process of data aggregation through automated ETL/ELT pipelines (Extract, Transform, Load/Extract, Load, Transform). TapClicks connects with over 10,000 marketing, advertising, and business data sources, instantly pulling in campaign data from disparate channels. Once ingested, TapClicks normalizes and enriches the data—standardizing metrics, aligning date ranges, and mapping nomenclature—so you can analyze performance across platforms side by side.
For example, a multi-location retail brand managing paid search, social, and OTT campaigns can use TapClicks to blend impressions, clicks, conversions, and cost data from Google, Meta, TikTok, and DSPs—without any manual exports or spreadsheet wrangling. The platform’s enrichment tools make it possible to group metrics by campaign, region, or business unit, delivering a truly unified, actionable dataset.
Real-time data aggregation also unlocks new possibilities for proactive marketing. By automating data collection and integration, marketers can access up-to-the-minute performance metrics, enabling faster optimizations and better budget allocation. To learn more about the transformative impact of automated data collection, see Unlocking Real-Time Marketing: The Power of Automated Data Collection for Brand Marketers.
With TapClicks, marketing teams and agencies no longer need to stitch together point solutions or juggle endless spreadsheets. Instead, they gain a unified marketing intelligence engine that streamlines cross-channel data aggregation—laying the foundation for accurate, timely, and scalable analytics. Discover more about how TapClicks empowers unified data and reporting at TapClicks.com.
Visualizing Campaign Performance and ROI
A multi-channel analytics dashboard is only as powerful as its ability to translate complex data into clear, actionable visualizations. With TapClicks, campaign performance visualization is at the core—transforming raw numbers into intuitive dashboards that track KPIs, reveal trends, and benchmark results across every channel.
KPI and Trend Visualization: Dashboards built with TapClicks allow marketers to monitor essential performance indicators—such as impressions, clicks, conversions, and cost per acquisition—across all advertising platforms in one unified view. Customizable charts, graphs, and tables make it easy to compare Facebook Ads to Google campaigns, or analyze how your email marketing stacks up against programmatic display, all in real time. With trend lines and historical comparisons, teams can instantly spot surges, dips, and seasonality that would otherwise be lost in siloed reports.
ROI Tracking Dashboard: One of the most valuable features of a multi-channel dashboard is the ability to track ROI at every level—by channel, campaign, or even creative asset. TapClicks’ ROI tracking dashboard aggregates spend and outcome data, calculating return on investment automatically so you can see which efforts are driving the most value. This empowers marketers to reallocate budget with confidence, optimize underperforming channels, and justify spending decisions to stakeholders with concrete data.
Automated Marketing Insights: Beyond visualizations, TapClicks leverages AI-powered insights to surface optimization opportunities directly within your dashboard. Forget about hunting through spreadsheets for anomalies or trends—instead, the platform highlights significant changes, flags potential issues, and recommends next steps, all without manual analysis. This means you can spend more time optimizing campaigns and less time crunching numbers.
Example Metrics Dashboard:
While every business’s needs are unique, a typical TapClicks dashboard might feature:
- Channel-by-channel performance breakdown (impressions, clicks, conversions)
- Budget pacing and spend efficiency visualizations
- Conversion funnels and attribution models
- Custom benchmarks for industry comparison
- Real-time alerts for KPI deviations
With these capabilities, marketing teams gain a holistic, actionable view of campaign performance and ROI—fueling smarter, faster decisions at any scale. To see how automation further enhances these visualizations, explore TapClicks dashboard automation for agency reporting efficiency, or learn more about the platform’s capabilities at TapClicks.
Automated Insights and Actionable Recommendations
In today’s fast-paced marketing landscape, waiting days—or even hours—for manual analysis simply isn’t enough. Automated, AI-driven marketing insights are transforming how teams spot opportunities, diagnose issues, and optimize campaigns in real time. With a multi-channel analytics dashboard powered by intelligent automation, marketers gain instant access to the “why” behind the numbers, not just the “what.”
TapClicks takes this a step further with its AI Agents and SmartPilot technology. These features continuously scan your dashboards and datasets to surface trends, anomalies, and actionable recommendations—without any manual digging. For example, if your paid search conversion rate suddenly dips or your social campaigns start outperforming benchmarks, TapClicks’ AI highlights these shifts immediately, often with suggestions on how to respond. This proactive approach empowers marketers to pivot strategies, reallocate budgets, or double down on what’s working, all before competitors can react.
Contrast this with traditional, manual reporting workflows: analysts must pull data from multiple sources, normalize formats, build charts, and then hunt for meaningful insights—a process that can take hours or days. Automated insights not only eliminate these repetitive tasks, but also reduce the risk of human error and ensure that nothing slips through the cracks.
To see how dashboard automation can supercharge your analytics reporting and enable real-time, data-driven action, explore TapClicks’ detailed guide on boosting analytics reporting with dashboard automation. By leveraging AI-driven insights within your multi-channel analytics dashboard, your team will spend less time wrangling data—and more time driving results.
Benefits of a Unified Reporting Platform for Marketing Teams
Adopting a unified reporting platform delivers significant strategic advantages for marketing teams, agencies, and multi-location brands alike. Chief among these benefits is substantial time savings—by automating data collection, normalization, and report generation, teams can reclaim 50+ hours per analyst each month that would otherwise be lost to manual data wrangling. This efficiency not only accelerates campaign analysis but also frees up valuable resources for higher-impact strategic work.
Improved accuracy is another major win. When all your marketing data flows into a single source of truth, you eliminate the risk of manual entry errors, duplicate data, and inconsistent metrics across disparate spreadsheets. With TapClicks, robust data connectors and enrichment tools ensure that every KPI, from impressions to conversions to spend, is up-to-date, blended, and ready for analysis—no matter how many platforms or channels you manage.
A unified dashboard also empowers better collaboration across teams. Sales, strategy, and fulfillment departments can access the same real-time insights, assign tasks, and track progress within a shared environment. For agencies and media companies serving hundreds of clients, TapClicks’ role-based access controls make it easy to deliver customized, branded dashboards to each client—enhancing transparency and communication without sacrificing data security.
Scalability is baked in. Unlike lightweight tools or homegrown reporting stacks, TapClicks is purpose-built to handle thousands of dashboards, clients, and data feeds simultaneously. Whether you’re a boutique agency growing your portfolio or an enterprise brand with dozens of business units, the platform grows with you—no more bottlenecks or fragmented reporting as your operations expand.
What sets TapClicks apart as an omnichannel analytics solution is its blend of unified scale, automated AI-driven insights, and integrated workflow tools. Features like dashboard automation for agency reporting efficiency and SmartEmail insight delivery help teams respond to performance changes instantly, while predictive models and AI agents surface opportunities for optimization that would be missed in manual reviews.
Ultimately, unified dashboards are more than just a reporting convenience—they’re a foundation for stronger stakeholder and client relationships. With clear, consistent reporting and actionable insights accessible in real time, your team can communicate results, justify budgets, and pivot strategies with confidence. To see how a unified reporting platform can transform your marketing operations, visit TapClicks.
How to Choose the Right Multi-Channel Analytics Dashboard
Selecting the best multi-channel analytics dashboard is a pivotal decision for marketing teams, agencies, and brands aiming to drive growth through data-driven strategy. With so many options available, it’s crucial to focus on your organization’s unique needs and choose a solution that stands out for scalability, integration, flexibility, and support.
Key Criteria for Evaluation
- Scalability: As your campaigns and client base grow, your dashboard should effortlessly handle increasing data volumes and user counts. Solutions like TapClicks are engineered for high-volume use, supporting thousands of dashboards and reports without sacrificing performance.
- Integration Options: Look for a platform with robust data connectors—such as TapClicks’ library of 10,000+ marketing, advertising, and business integrations—that can unify all your channels, tools, and platforms (Google Ads, Facebook, programmatic, CRM, offline, and more) in one place.
- Customization: The ability to tailor dashboards, visualizations, and reports to specific teams, clients, or locations is essential. TapClicks offers drag-and-drop dashboard builders and branded reporting studios, so every stakeholder gets the insights most relevant to them.
- User Roles and Permissions: Enterprise-grade solutions should support multi-level access for agencies, brands, and clients. Role-based controls ensure the right people see the right data while maintaining privacy and compliance.
- Automation and AI Insights: Prioritize dashboards with advanced automation—scheduled reporting, anomaly detection, and AI-driven recommendations—that free your team from manual data wrangling.
- Support and Onboarding: Responsive customer support, detailed documentation, and a seamless onboarding process are vital for maximizing the value of your dashboard investment.
TapClicks vs. Other Reporting Platforms
While many dashboards offer integrations and visualization, few combine true end-to-end marketing operations in one unified system. TapClicks differentiates itself with:
- Unmatched scale for agencies and enterprises.
- Deep data enrichment and cross-channel blending for accurate, actionable insights.
- Automated, AI-powered analytics and smart recommendations—not just static dashboards.
- The flexibility to operate as your “single source of truth” or feed data into other BI tools (like Tableau or Power BI).
In contrast, tools such as Funnel.io and Supermetrics excel at data pipelining, but lack advanced workflow and insight automation. Agency Analytics and NinjaCat serve smaller shops, but may struggle with complex, multi-brand, or multi-location use cases.
Quick Checklist for Choosing Your Dashboard Solution
- Does it support all your current (and future) data sources?
- Can it scale seamlessly as your business grows?
- Are dashboards and reports fully customizable for your needs?
- Does it offer AI insights and automation to save time?
- Are user roles, permissions, and collaboration tools robust?
- Is onboarding straightforward, and is responsive support available?
By prioritizing these factors—and evaluating how platforms like TapClicks deliver on them—you can confidently select a multi-channel analytics dashboard that drives smarter decisions, streamlined operations, and measurable results.
Getting Started with TapClicks Analytics Dashboard
Onboarding your marketing team or agency onto a multi-channel analytics dashboard shouldn’t be a daunting task—especially with TapClicks. Whether you’re consolidating hundreds of client accounts or unifying brand campaigns across Facebook, Google, programmatic, and offline channels, TapClicks is designed to get you up and running quickly, while giving you the flexibility to tailor every report and workflow to your needs. Here’s how to get started and realize value right away:
1. Streamlined Onboarding and Setup
TapClicks makes onboarding intuitive. Once you sign up, you’ll access the TapClicks platform and receive guided tutorials. Start by connecting your data sources: TapClicks supports 10,000+ marketing, advertising, and business connectors, so whether it’s Google Ads, Facebook, email platforms, or CRM systems, you can bring your data together with just a few clicks. The platform’s automated ETL/ELT pipeline handles extraction, transformation, and loading—no manual wrangling required.
2. Customizing Dashboards and Reports
After connecting your channels, easily build custom dashboards using TapClicks’ drag-and-drop interface. Tailor visualizations to display the metrics that matter—CPMs, conversions, budget pacing, or multi-location rollups. You can design granular, client-specific views or high-level executive summaries. Add your branding, set user permissions, and configure role-based access for clients, sales, or fulfillment teams.
3. Automating Reports and Alerts
Once your dashboards are in place, automate your reporting workflow. Schedule recurring reports for internal teams, clients, or stakeholders—delivered via email or direct platform access. Set up real-time alerts for KPIs, anomalies, or campaign milestones, so your team is always in the loop and can act quickly on new insights.
4. Inviting and Collaborating with Team Members
TapClicks supports seamless collaboration. Invite team members directly from the dashboard, assign roles, and manage permissions to control data visibility. Use workflow tools to streamline campaign orders, fulfillment, and approvals, keeping everyone aligned and accountable.
5. Unlocking Unified Marketing Intelligence
With your data unified and reports automated, you’re ready to unlock actionable insights. Leverage TapClicks’ AI-powered features for automated recommendations and trend detection. Use dashboard automation to boost efficiency and free your team from manual, repetitive work—so you can focus on optimizing campaigns and growing your business.
Ready to get started? Visit TapClicks for a demo or free trial, and take the first step toward unified, scalable, and intelligent marketing analytics.
Start Automating Your Marketing Data Today!
No Credit Card Required.

