

Multi-Channel Analytics Dashboard: Unified Marketing Insights
Marketing teams and agencies are often faced with fragmented data, siloed performance metrics, and the challenge of making sense of results across multiple platforms. A multi-channel analytics dashboard brings all your marketing data together, providing a clear and actionable view of what’s working and where to optimize. With TapClicks, you can automate reporting, visualize cross-channel campaign performance, and uncover insights that drive smarter decisions—all from a single, unified reporting platform.
What Is a Multi-Channel Analytics Dashboard?
A multi-channel analytics dashboard is more than just another reporting tool—it's the command center for modern marketing teams. Here’s how it works and why it matters:
The Big Picture: What Does It Do?
- Centralizes Your Data
Gathers performance metrics from all your marketing channels—social, search, email, display, and more—into one digital hub. - Breaks Down Silos
No more toggling between platforms or cobbling together spreadsheets. Everything you need is unified and easy to analyze. - Reveals True Performance
Makes it simple to compare and contrast how each channel contributes to your goals, helping you see the bigger story behind your campaigns.
How Is It Different from Single-Channel Dashboards?
| Single-Channel Dashboard | Multi-Channel Analytics Dashboard |
|---|---|
| Only shows data from one platform | Aggregates data from many marketing sources |
| Metrics are isolated | Metrics are harmonized and aligned across all |
| Limited visibility | Enables cross-channel insights and comparisons |
Why Marketers Rely on Multi-Channel Dashboards
- See Hidden Connections
Discover, for example, if a spike in social activity leads to a bump in email conversions, or how paid search and display ads work better together. - Strategic, Not Just Tactical
Move beyond “multi-touch” reporting. Connect the dots between every channel to inform smarter decisions. - Real-Time Optimization
React quickly to what’s working (and what’s not) with up-to-date, side-by-side channel performance. - Better Budget Allocation
Invest where it counts, based on a holistic view—not just channel-by-channel performance.
Who Needs a Multi-Channel Dashboard?
- Agencies juggling dozens or hundreds of client campaigns.
- In-house teams managing complex, multi-platform strategies.
- Enterprises needing consistent, transparent reporting across departments or locations.
Built for Modern Marketing Complexity
As campaigns get more sophisticated and the number of platforms multiplies, having a unified dashboard is no longer a luxury—it’s a necessity. With solutions like TapClicks:
- You move seamlessly from fragmented data to actionable insights.
- Your team sees the full impact of every marketing dollar.
- You empower smarter strategy, faster optimization, and crystal-clear reporting.
Bottom line: A multi-channel analytics dashboard is your lens into the complete marketing landscape—helping you make better decisions, faster.
Key Features of a Unified Reporting Platform
A unified reporting platform is more than just a collection of charts and graphs—it’s the operational backbone that powers modern marketing intelligence. The best platforms seamlessly blend diverse data streams, automate complex reporting tasks, and deliver insights that are both actionable and scalable. Here’s what sets leading solutions like TapClicks apart:
1. Comprehensive Data Aggregation
At the heart of a unified reporting platform is robust data integration. With TapClicks, you can connect to over 10,000 marketing, advertising, and business data sources—including social, search, email, display, CRM, and offline channels. TapClicks’ Smart Connectors ensure that no data is left siloed, allowing marketers and agencies to blend and normalize information across campaigns, clients, and locations. This end-to-end aggregation eliminates manual data wrangling and forms the foundation for accurate, cross-channel analytics.
2. Real-Time Dashboard Updates
Modern marketing moves fast, so your dashboard must keep up. TapClicks supports near real-time data synchronization, ensuring your dashboards always reflect the latest performance metrics. This enables teams to monitor campaign results as they unfold, spot anomalies quickly, and make informed decisions without waiting for end-of-month reports.
3. Customizable Visualization Tools
Every marketing team has unique needs, and a one-size-fits-all dashboard won’t cut it. TapClicks provides drag-and-drop dashboard builders, branded reporting studios, and a wide variety of visualization options—charts, graphs, scorecards, heatmaps, and more. This flexibility allows users to tailor dashboards for specific stakeholders, whether it’s high-level executive overviews or granular, channel-by-channel deep dives.
4. Automated Reporting and Scheduling
Manual report generation is a notorious time sink. TapClicks automates the entire reporting lifecycle, from data pulls to scheduled email delivery. Teams can set up recurring reports for clients or internal stakeholders, ensuring everyone stays informed with minimal effort. Automated workflows not only boost efficiency but also reduce the risk of human error in data handling and presentation.
5. Scalability and Multi-Client Management
For agencies and enterprise marketing teams, scale is crucial. TapClicks is built to handle thousands of dashboards and reports simultaneously, supporting role-based access and white-labeling for multi-client environments. This means agencies can deliver branded, customized analytics to hundreds of clients from a single platform—without sacrificing speed or data integrity.
TapClicks stands out as a unified reporting platform because it goes beyond basic visualization. Its combination of high-scale data integration, real-time updates, customizable dashboards, automated reporting, and enterprise-grade scalability makes it the ideal choice for organizations seeking to centralize their marketing analytics and unlock the full value of their data. For more information, explore the full capabilities of TapClicks at tapclicks.com.
Benefits of Cross-Channel Marketing Analytics
A unified, multi-channel analytics dashboard delivers transformative benefits to marketing teams and agencies striving to maximize impact and efficiency. By bringing disparate data streams—social media, search, display, email, and more—into a single interface, teams gain an unprecedented level of campaign performance visibility. Instead of toggling between siloed platforms, marketers can instantly compare results across channels, revealing which messaging, creatives, and tactics are truly driving engagement and conversions.
One of the most significant advantages is enhanced ROI tracking and smarter budget allocation. With a holistic view of spend and performance, marketers can quickly identify high-performing channels to double down on, while reallocating resources from underperforming campaigns. This unified approach simplifies marketing intelligence reporting, making it easier to demonstrate value to stakeholders and justify investment decisions.
Cross-channel dashboards also foster better collaboration between teams. When everyone—from creative to analytics to client services—works from the same up-to-date data set, it eliminates confusion and supports faster, more informed decision-making. Shared dashboards ensure alignment on goals, KPIs, and outcomes, whether you’re an agency managing dozens of clients or a brand overseeing multiple locations.
Moreover, automation is a game-changer in streamlining analytics reporting. By leveraging automated data pulls, scheduled reports, and AI-powered insights, marketing teams can focus on strategy and optimization instead of manual data wrangling. As detailed in this guide on automating analytics reporting, TapClicks customers often reduce reporting workload by 50+ hours per month, freeing up resources for higher-value work.
Ultimately, the ability to visualize, measure, and optimize across the entire marketing ecosystem leads to more agile, data-driven organizations—and puts marketing leaders in the best position to deliver measurable results.
How Automated Marketing Insights Save Time
One of the most powerful advantages of a multi-channel analytics dashboard is the ability to automate the entire insights process—from data collection to actionable recommendations. With TapClicks, marketing teams and agencies no longer have to spend countless hours manually pulling data from disparate sources, wrangling spreadsheets, or building repetitive reports. Instead, the platform’s automated data pulls ensure that all campaign metrics are updated in real time and consolidated in one place, eliminating data silos and reducing the risk of manual errors.
Report scheduling is another cornerstone of efficiency. TapClicks enables users to set up recurring, fully branded reports that are automatically delivered to stakeholders on a schedule. Whether it’s a daily performance recap for a client or a monthly executive summary, these automated workflows free up 50+ hours per analyst per month—time that can be reinvested in strategy, creative work, or deeper analysis.
But automation goes beyond data aggregation and reporting. TapClicks’ AI-driven SmartEmail and AI Agents proactively surface key insights and optimization opportunities. For example, if a paid search campaign is underperforming compared to social channels, TapClicks can automatically detect the anomaly, generate an insight summary, and send it directly to the relevant team member or client. This instant notification system ensures that marketing teams are always aware of what’s working and what needs attention, without having to pore over endless dashboards or reports.
By streamlining the analytics workflow, TapClicks not only accelerates decision-making but also boosts overall marketing productivity. To see how these time-saving automations can transform your analytics process, explore our article on boosting analytics reporting efficiency.
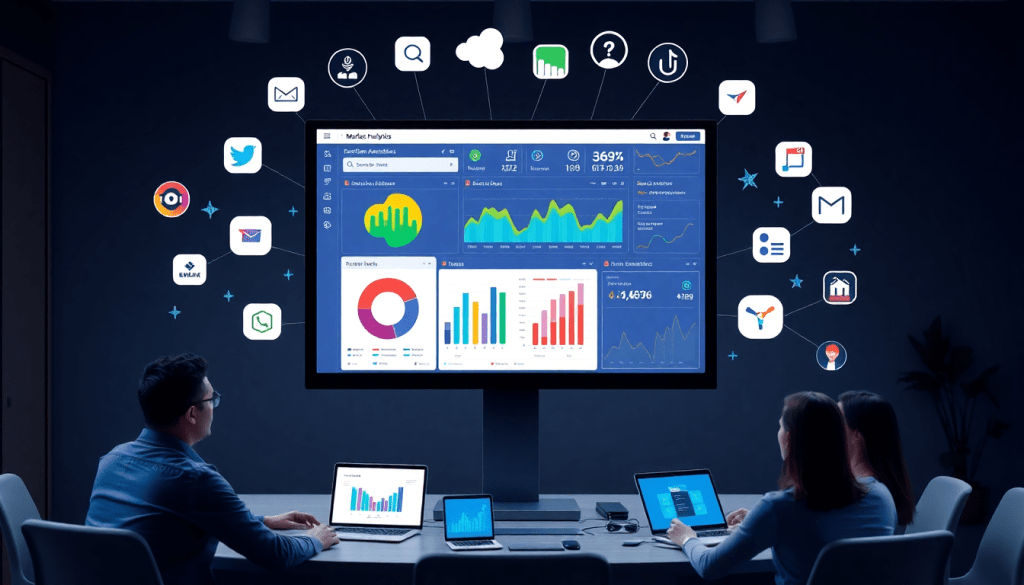
Visualizing Campaign Performance Across Channels
One of the most powerful aspects of a multi-channel analytics dashboard is its ability to make complex marketing data instantly understandable through intuitive visualizations. TapClicks offers a robust toolkit of dashboard visualization options—ranging from interactive graphs and time-series charts to heatmaps, scorecards, and customizable widgets—that transform raw data into clear, actionable insights.
A well-designed visualization doesn’t just look good; it enables marketers to see how campaigns are performing across Google, Facebook, LinkedIn, and other platforms side by side. For example, you can use heatmaps to quickly spot top-performing regions for your social campaigns, or deploy scorecards to compare conversion rates from different paid search channels—all from the same dashboard. Custom widgets allow you to highlight KPIs most relevant to your team or clients, whether that’s click-through rates, cost per acquisition, or ROI.
Integrated marketing metrics are vital for multi-platform reporting software, ensuring you’re not just looking at isolated data points but understanding the broader impact of your campaigns. By unifying these metrics, TapClicks makes it easy to answer critical questions: Which channel is driving the highest engagement? Where is your budget performing best? How do trends shift over time across platforms?
This holistic view empowers marketing teams and agencies to make smarter, faster optimization decisions, supported by real-time data and visually compelling reporting. Learn more about how TapClicks’ unified visualization tools can elevate your campaign analysis and streamline cross-channel performance monitoring at TapClicks.
Unified Analytics: From Data Aggregation to ROI Tracking
A truly unified marketing analytics workflow begins with seamless data integration. Modern marketing operations depend on bringing in data from a multitude of sources—think paid search, social ads, programmatic display, email campaigns, and more. This is where platforms like TapClicks excel, offering over 10,000 connectors that automatically extract, transform, and load marketing data into a central system. No more manual data wrangling or “spreadsheet gymnastics”—all your campaign data flows into a single hub, ready for analysis.
Once data is aggregated, the unified dashboard becomes the nerve center of your omnichannel analytics strategy. Instead of toggling between siloed platforms, teams can visualize performance metrics side by side: compare Facebook and Google campaign results, track conversions across LinkedIn and email, and monitor budget pacing from a single screen. TapClicks’ customizable dashboards and automated reporting tools empower users to blend and normalize datasets, delivering a holistic view of marketing impact.
But unification doesn’t stop at visualization. With actionable reporting, marketers can drill down into cross-channel performance, identify trends, and make data-driven decisions quickly. TapClicks’ advanced analytics surface insights like which channels drive the highest ROI, which campaigns need budget reallocation, and where optimization opportunities exist. Automated notifications and AI-powered insights mean teams are alerted to performance changes in real time—no need to wait for manual reports.
Ultimately, a TapClicks analytics dashboard transforms unified data into real marketing intelligence. From automated data ingestion to actionable ROI tracking, it supports agencies, brands, and enterprise teams in making smarter decisions, faster—unlocking the full power of omnichannel analytics for measurable business growth.
How to Choose the Best Multi-Channel Analytics Dashboard
Picking an analytics dashboard for your marketing operations isn’t just a checkbox—it’s a decision that shapes your team’s efficiency, the reliability of your data, and your ability to act on insights. The right platform should not only pull data from everywhere you need, but also scale with your business and make actionable insights easy to find. Here’s how to make a decision you’ll feel confident about:
What to Look For in a Multi-Channel Dashboard
Integration Depth:
Look for a solution that connects to all your key marketing, advertising, and business data sources—social, search, email, programmatic, and more.
- Must-have: Large library of pre-built connectors
- Bonus: Flexible custom integration options
- TapClicks Example: 10,000+ marketing, advertising, and business data connectors, so you can unify all your channels without manual headaches.
Scalability for Growth:
Is your dashboard built for high volume?
- Supports multi-client management and role-based access
- Handles thousands of dashboards, reports, and users
- TapClicks Advantage: Engineered for agencies and enterprises that manage massive reporting workloads.
Intuitive UX and Customization:
Your team shouldn’t need a degree in data science to use your dashboard.
- Drag-and-drop dashboard building
- Branded, customizable visualizations
- Easy sharing for different stakeholders (CMOs, clients, etc.)
- TapClicks: Allows deep customization without technical bottlenecks.
AI and Automation Built In:
You need more than just raw data—look for platforms that deliver:
- AI-powered insights surfaced automatically
- Scheduled reports and smart notifications
- Proactive recommendations, not just historical data
- TapClicks: AI Agents and SmartEmail deliver automated, insight-rich reports straight to your team or clients.
Comparing TapClicks to Other Players
Let’s break down how TapClicks stacks up against other options:
| Platform | Data Integration | In-Platform Analytics | Automation & Workflow | Enterprise Scale |
|---|---|---|---|---|
| TapClicks | 10,000+ sources | Yes | Yes | Yes |
| Funnel.io | Yes | No | No | Moderate |
| Supermetrics | Yes | No | No | Moderate |
| Agency Analytics | Limited | Basic | Basic | Limited |
| NinjaCat | Limited | Basic | Basic | Limited |
| Datorama (Salesforce) | Yes | Yes | Yes | Yes (complex) |
| Adverity | Yes | Yes | Yes | Yes (complex) |
What Sets TapClicks Apart?
- Blends massive scale, automation, and actionable AI insights
- Moves agencies and brands beyond dashboards to a full marketing operations platform
- Easier to deploy and manage than heavy enterprise solutions
Questions to Ask Before You Decide
Before you make your final choice, run through this practical checklist:
- Does it integrate with every channel and tool I need—today and as we grow?
- Can we easily automate reporting and receive proactive, AI-driven insights?
- Will it scale with our client base and campaign volume?
- Is the user interface friendly for all team members, technical or not?
- Does it fit with our BI, CRM, and marketing ecosystem?
The Bottom Line
A platform that checks all these boxes—like TapClicks—lets your team focus less on wrangling data and more on driving marketing results that matter.
Make your dashboard work for you, not the other way around.
Getting Started with TapClicks
Embarking on your journey with TapClicks is straightforward and designed to deliver value from day one. Here’s a brief roadmap to help new users hit the ground running and get the most out of TapClicks’ unified reporting platform:
1. Streamlined Onboarding and Data Integration
Begin by connecting your marketing channels through TapClicks’ extensive library of over 10,000 data connectors. Whether you’re pulling data from Google, Facebook, email platforms, or specialized ad networks, TapClicks’ automated ETL/ELT pipeline makes the process seamless. The onboarding wizard guides you step-by-step, ensuring your data is imported, cleansed, and normalized for immediate use.
2. Tailor Your Dashboards for Maximum Insight
Leverage TapClicks’ drag-and-drop interface to build customizable dashboards that reflect your most critical KPIs. Set up branded reporting templates tailored for different stakeholders—executives, clients, or channel managers. Take advantage of smart widgets, scorecards, and visualization tools to present performance across all channels in one cohesive view.
3. Automate Reporting and Insights Delivery
Schedule automated reports and enable SmartEmail to deliver AI-curated insights directly to your inbox or your clients’ stakeholders. TapClicks makes it easy to set up recurring reports, so you’re always on top of campaign performance without manual effort. Use the platform’s AI agents to surface actionable recommendations and predictive analytics for ongoing optimization.
4. Collaborate and Scale with Confidence
Assign role-based access for your team or clients, enabling secure collaboration and transparency at scale. TapClicks is built to support multi-client agencies and enterprise teams managing hundreds—or thousands—of dashboards simultaneously.
5. Optimize Continuously with Support and Resources
Regularly review TapClicks’ resource center for best practice guides, webinars, and community forums. Stay informed about new features and workflow enhancements. To maximize impact, schedule periodic strategy reviews with your TapClicks customer success representative to identify further optimization opportunities.
Ready to experience unified marketing analytics that saves time and drives smarter decisions? Request a TapClicks demo today and see how easy it is to revolutionize your marketing operations.
Start Automating Your Marketing Data Today!
No Credit Card Required.

