

Multi-Channel Analytics Dashboard: Unified Marketing Insights
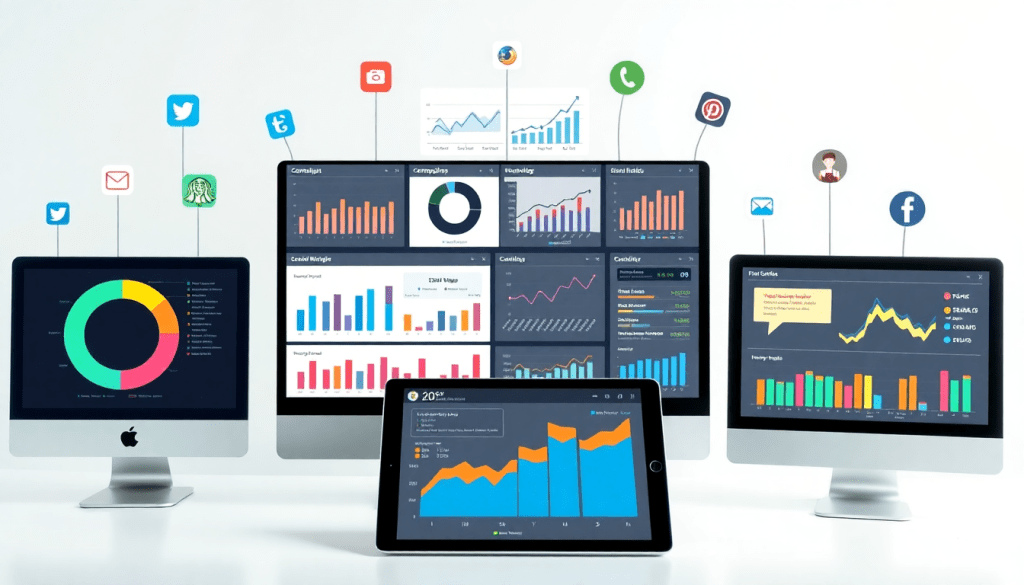
Today’s marketing landscape demands a clear, unified view of campaign performance across every channel—digital, social, search, and beyond. Multi-channel analytics dashboards enable marketers, agencies, and brands to bring all their data into one place for smarter, faster decision-making. This guide breaks down how a unified reporting platform like TapClicks turns fragmented metrics into actionable insights: from automated marketing analytics to campaign performance visualization and ROI tracking. Learn how to unlock the true power of marketing data aggregation and elevate your reporting workflow with an integrated, omnichannel analytics solution.
The Value of a Multi-Channel Analytics Dashboard
In today’s fragmented marketing ecosystem, organizations face a persistent challenge: campaign data is scattered across countless platforms—Google Ads, Facebook, programmatic display, email, and more. Each tool speaks its own language and has unique metrics, making it nearly impossible to gain a holistic, real-time view of performance. This siloed approach leads to time-consuming manual reporting, inconsistent data, and missed opportunities for optimization.
Multi-channel analytics dashboards are designed to solve precisely these problems. By centralizing campaign data from every marketing channel into a single, unified interface, these dashboards empower marketers, agencies, and brands to break down data silos and connect the dots across their entire funnel. Instead of juggling spreadsheets or logging into multiple platforms, users see key metrics, trends, and KPIs at a glance—no matter how many sources feed into the dashboard.
The impact of this data centralization is transformative. Efficiency skyrockets as teams spend less time on manual data pulls and more time on strategy. Accuracy improves thanks to automated data aggregation, reducing the risk of human error and ensuring that everyone—from analysts to executives—is working from the same source of truth. Most importantly, marketing intelligence reporting becomes proactive rather than reactive: teams can spot trends, surface actionable insights, and respond to campaign changes in real time.
For agencies managing multiple clients, these benefits are even more pronounced. Automated dashboards allow for seamless reporting at scale, saving analysts dozens of hours each month and enabling agencies to deliver more value with less overhead. For a deeper dive on how dashboard automation boosts agency efficiency, check out "Boosting Agency Reporting Efficiency with Dashboard Automation".
Ultimately, a multi-channel analytics dashboard isn’t just a reporting tool—it’s the foundation for smarter, faster, and more integrated marketing decisions. By transforming fragmented data into unified intelligence, organizations can unlock the full potential of their marketing investments.
Core Features Every Unified Reporting Platform Should Offer
A truly unified reporting platform is more than just a place to view numbers—it’s the backbone of modern marketing intelligence. To empower smarter decision-making and streamline operations, your analytics dashboard should deliver these essential features:
1. Robust Data Aggregation
At its core, a unified dashboard must seamlessly aggregate data from all your marketing, advertising, and business platforms. The ability to automatically pull, normalize, and blend disparate datasets (think Google Ads, Facebook, programmatic, CRM, and offline sources) is foundational. This ensures you always have a single source of truth, eliminating manual exports and spreadsheet chaos.
2. Cross-Channel Analytics
True value comes from connecting the dots: analyzing performance across every channel, not in isolation. Look for cross-channel analytics capabilities that allow you to compare metrics side-by-side, correlate trends, and understand the full customer journey—from first touch to conversion—across paid, owned, and earned media.
3. Campaign Performance Visualization
Data only drives impact when it’s easy to interpret. Modern dashboards should offer intuitive visualization tools: drag-and-drop widgets, customizable charts, and interactive graphs that make it simple to monitor KPIs like CTR, conversion rate, spend, and ROI. This visual clarity helps teams quickly spot opportunities and areas for optimization.
4. Automated Marketing Insights
With marketing data growing exponentially, manual analysis isn’t scalable. Leading platforms now leverage AI and automation to surface actionable insights—flagging anomalies, predicting outcomes, and recommending optimizations. This lets marketers focus on strategy, not sifting through spreadsheets.
5. ROI Tracking and Attribution
An effective dashboard must go beyond vanity metrics and answer the big question: what’s the ROI? Built-in attribution tools, budget pacing, and spend optimization features help you track value generation by campaign, channel, or client—powering data-driven decisions and transparent reporting.
6. Customizable, Scalable Dashboards
Every organization is unique. Whether you’re an agency managing hundreds of clients, or a brand with dozens of locations, your platform should support customizable dashboards and role-based access. Scalable architecture is crucial to keep performance high as your reporting needs grow.
7. Integrated Marketing Metrics
When all metrics—from impressions and clicks to leads, pipeline, and revenue—are unified and mapped across channels, you gain a holistic view of marketing effectiveness. Integrated metrics enable smarter budgeting, faster optimizations, and clearer communication with stakeholders.
For agencies, the impact of these features is even greater: unified dashboards can slash reporting hours, reduce errors, and deliver real-time value to clients. Explore how dashboard automation is transforming agency operations in "Boosting Agency Reporting Efficiency with Dashboard Automation".
By choosing a platform that brings these core capabilities together, marketers can finally move beyond fragmented tools and unlock the full power of their data. To see how TapClicks delivers on every one of these essentials, visit TapClicks.
How TapClicks Powers Integrated Marketing Metrics
TapClicks is transforming how agencies, brands, and enterprise marketers unify, analyze, and act on their data. Instead of juggling fragmented tools and manual spreadsheets, TapClicks brings everything together—automatically, at scale.
Why Marketers Choose TapClicks for Unified Metrics
-
10,000+ Data Connectors:
Instantly integrate marketing, advertising, and business data from virtually any platform—digital ads, social, PPC, search, traditional media, CRM, and more. -
Automated Data Pipeline:
No more manual data pulls. TapClicks extracts, transforms, and loads (ETL/ELT) data from every channel, centralizing metrics with minimal IT intervention. -
Advanced Data Enrichment:
Blend and normalize datasets across:- Multiple channels (search, social, display, OOH, etc.)
- Multi-location and multi-client scenarios
- Cross-campaign comparisons
From Static Reports to Dynamic, AI-Driven Dashboards
TapClicks dashboards aren't just pretty charts—they’re interactive, branded workspaces built for real-time decision-making:
- Drag-and-drop customization for campaign, budget, and performance tracking
- Automated, white-labeled reporting for internal teams or clients
- Interactive visuals that update as your data flows in
AI-Powered Insights and Automation
-
TapInsights & SmartPilot:
AI agents analyze your data for you—surfacing trends, outliers, and optimization opportunities (no data scientist required). -
SmartEmail:
Get plain-English, AI-generated insight summaries delivered right to your inbox or your client’s—keeping everyone informed without the reporting grind. -
Predictive Models:
Move beyond “what happened” to “what’s next”—with campaign scoring, budget pacing, and optimization recommendations.
Flexible Data Architecture—Your Way
| Use TapClicks as… | Or Pipe Data Into… |
|---|---|
| Your “single source of marketing truth” | Tableau, Power BI, Looker, or your existing BI stack |
- Serve as your unified hub: Centralize all marketing data and analytics in one place.
- Or, power your existing tools: Export enriched, clean data wherever you need it.
How TapClicks Stacks Up
TapClicks isn’t just another dashboard tool. Compared to point solutions like Funnel.io, it delivers:
- Scale: Handles thousands of dashboards, reports, and clients—perfect for agencies and multi-location brands.
- Actionable AI: Not just data, but recommendations, insights, and automation that drive decisions.
- Workflow Integration: Order management, role-based access, and campaign ops—baked in.
For a detailed look at how TapClicks compares, check out:
"TapClicks vs. Funnel.io: Platform Comparison".
Ready to see unified marketing analytics in action?
Explore the full range of TapClicks capabilities at TapClicks.
Streamlining Campaign Performance Visualization
In the age of omnichannel marketing, visualizing campaign performance across multiple platforms shouldn’t require hours of manual data wrangling. A multi-channel analytics dashboard streamlines this process by pulling in metrics like click-through rates (CTR), conversion rates, ad spend, and ROI from every channel—display, search, social, video, and more—into a single, easily digestible view.
With modern solutions like TapClicks, marketers can leverage intuitive drag-and-drop dashboards to build highly customized reports that reflect their unique KPIs and priorities. These dashboards support customizable widgets for tracking everything from total impressions to granular channel-level conversions, allowing agencies and brands to tailor the visualization experience for each client or business unit.
Automated report generation eliminates the repetitive, error-prone tasks of manual spreadsheet updates. Instead, real-time dashboards update instantly as new data flows in—empowering teams to spot trends, compare channels side by side, and pivot quickly when performance shifts. For example, a campaign manager might use TapClicks’ centralized view to monitor Facebook ad spend, Google Ads ROI, and programmatic display conversions, all in one place, without toggling between platforms.
This real-time, consolidated perspective not only saves time, but enables truly cross-channel marketing analytics. Marketers gain the ability to quickly identify which channels are driving the best results, spot underperforming campaigns, and optimize budget allocations on the fly. By transforming raw data into actionable visual dashboards, platforms like TapClicks empower organizations to make smarter, faster decisions—and elevate their entire marketing operation.
Automated Marketing Insights for Smarter Decisions
In the era of data-driven marketing, it’s no longer enough to simply collect and display metrics—what sets leading teams apart is their ability to transform raw data into actionable insights, quickly and at scale. This is where automation and artificial intelligence (AI) come into play. Modern multi-channel analytics dashboards, like those offered by TapClicks, leverage AI-powered automation to sift through vast, complex datasets and surface the insights that matter most.
AI agents embedded within TapClicks analyze campaign performance across every channel, identifying trends, uncovering anomalies, and highlighting opportunities for optimization—often before your team even notices them. For instance, if a sudden drop in conversion rate or spike in ad spend occurs, the platform’s automated anomaly detection can flag the issue instantly, enabling rapid response and minimizing wasted budget.
Scheduled, automated reports further streamline the analytics workflow by delivering curated, up-to-date insights directly to your team’s inbox or even to clients, eliminating manual data pulls and spreadsheet wrangling. Features like TapClicks’ SmartEmail go a step further, automatically generating and distributing tailored summaries that translate complex analytics into clear, actionable recommendations.
Predictive analytics add another layer of intelligence, using historical data and machine learning models to forecast performance, benchmark results, and recommend budget adjustments. Marketers gain a proactive edge, moving from reactive reporting to forward-looking strategy with confidence.
With automation handling the heavy lifting, marketing teams can focus on strategic decision-making and creative execution, rather than data wrangling. For a deeper dive into how automation supercharges analytics reporting, check out "Boost Analytics Reporting with Dashboard Automation".
By harnessing AI and automation, a unified multi-channel analytics dashboard empowers organizations to make smarter, faster decisions—unlocking the full value of their marketing data.
ROI Tracking Dashboard: From Data to Value
In today’s complex marketing environment, understanding true return on investment (ROI) is both critical and challenging. Multi-channel campaigns often span dozens of platforms, creating a maze of touchpoints and costs that can be difficult to untangle. A unified ROI tracking dashboard brings order to this chaos—giving marketers, agencies, and brands a clear, comprehensive view of performance and value across every channel.
Simplifying ROI Tracking Across Channels
With a unified dashboard, all campaign data—from paid search and social to email and programmatic—flows into a single interface. This centralization eliminates manual data stitching and ensures that every impression, click, conversion, and dollar spent is accounted for. Marketers can quickly see which channels drive the most value, identify underperforming initiatives, and reallocate budgets with confidence.
For example, TapClicks’ multi-channel analytics dashboard aggregates spend, revenue, and engagement data from over 10,000 sources, automatically matching costs to outcomes. This makes it easy to compare ROI across campaigns, clients, or locations—without the need for complex spreadsheets or endless exports.
Integrated Attribution, Budget Pacing, and Spend Optimization
Accurate ROI measurement depends on more than just raw numbers. Advanced dashboards like TapClicks go further by integrating attribution models that map customer journeys across channels, ensuring credit is assigned where it’s truly due. Budget pacing tools help teams monitor spend in real time, alerting users to pacing issues before they become costly overruns.
Automated recommendations and predictive analytics take the guesswork out of spend optimization. If a campaign is outperforming projections, the system can suggest increasing investment—or flag inefficiencies if ROI falls below target. This closed-loop feedback empowers marketers to act quickly and maximize every dollar.
Transparent Reporting for Every Stakeholder
Perhaps most importantly, unified dashboards foster transparency and trust. With role-based access and automated reporting, stakeholders at every level—from account managers to C-suite executives—can access up-to-date, accurate ROI metrics tailored to their needs. Visualizations and insight summaries make it easy to communicate results, justify budgets, and demonstrate the impact of marketing efforts.
By turning fragmented data into clear, actionable value metrics, an ROI tracking dashboard is no longer a nice-to-have—it’s an essential tool for modern marketing leadership. To see how integrated platforms like TapClicks can transform your ROI reporting and campaign optimization, visit TapClicks.
Choosing the Right Omnichannel Analytics Solution
Selecting the right multi-channel analytics dashboard is a critical decision—one that directly impacts your team’s efficiency, data accuracy, and the clarity of your marketing intelligence. Whether you’re an agency juggling hundreds of clients, a multi-location brand, or an enterprise with complex reporting needs, consider these essential factors:
1. Scalability and Performance:
Your chosen platform should easily handle increasing data volumes, users, and dashboards as your business grows. Look for solutions built for high-volume use cases, supporting thousands of dashboards and clients without lag or performance issues.
2. Connector Library and Data Integration:
A robust connector library is vital for true omnichannel visibility. Evaluate platforms based on their ability to unify data from a wide range of sources—social, search, programmatic, CRM, and more. For instance, TapClicks offers over 10,000 connectors, ensuring you can centralize virtually any campaign, channel, or location.
3. Ease of Use and Customization:
A drag-and-drop interface, customizable widgets, and branded reporting should be standard. The best platforms empower users of all skill levels to create, modify, and share dashboards without IT bottlenecks.
4. Workflow Integration:
Beyond just reporting, the ideal solution streamlines your marketing operations. Features like automated report scheduling, centralized order management, and role-based access can dramatically boost productivity—especially for agencies and multi-brand organizations.
5. Support and Training:
Responsive support, onboarding resources, and ongoing training are crucial for long-term success. Consider vendors that offer dedicated account management and a knowledge-rich support ecosystem.
TapClicks vs. the Competition
While competitors like Funnel.io, Supermetrics, and Datorama provide capable data aggregation tools, TapClicks stands out by combining unified scale, advanced AI-driven insights, and workflow management in a single platform. Many alternatives focus solely on data integration or basic dashboarding, while TapClicks delivers end-to-end marketing operations—removing the need for multiple point tools and manual processes.
Tips for Evaluating Platforms
- Assess your current and future data sources. Ensure the platform’s connector library aligns with your channels.
- Test scalability. Ask for case studies or demos that showcase performance at your expected scale.
- Explore workflow features. Determine if the platform streamlines approvals, fulfillment, and client communications.
- Compare automation capabilities. Evaluate how each solution leverages AI, predictive analytics, and scheduled insights.
- Seek feedback from similar users. Agencies, brands, and enterprises all have unique needs—find out how peers have implemented and benefited from different platforms.
Ultimately, selecting the right omnichannel analytics solution is about more than just aggregating data—it’s about transforming your entire marketing operations workflow. To see how TapClicks can unify your data, reporting, and intelligence at scale, visit TapClicks and explore what a truly integrated platform can do for your business.
Getting Started with TapClicks Analytics Dashboard
Implementing a multi-channel analytics dashboard may seem daunting, but with TapClicks, the process is streamlined and scalable—whether you’re a nimble agency or a global brand. Here’s a step-by-step roadmap to get you up and running with unified, automated marketing reporting:
1. Define Your Data Sources and Goals
Begin by identifying the marketing platforms, ad networks, and business systems critical to your reporting needs. TapClicks supports over 10,000 connectors, making it easy to pull in data from Google Ads, Facebook, programmatic platforms, CRMs, and more. Clarify your key metrics and reporting objectives—such as ROI, cross-channel attribution, or budget pacing—to shape your dashboard structure.
2. Connect and Aggregate Your Data
Use TapClicks’ intuitive Smart Connectors to link each data source. The platform’s automated ETL/ELT pipelines handle data extraction, transformation, and normalization, ensuring that campaign metrics from every channel are cleanly aggregated. This centralization lays the foundation for accurate, cross-platform insights.
3. Customize Dashboards and Reports
Leverage TapClicks’ drag-and-drop dashboard builder to tailor views for your team, clients, or stakeholders. Add widgets to visualize KPIs like conversion rate, spend, and impressions. TapClicks enables you to design branded, multi-client dashboards and set up role-based access so every user sees the data most relevant to them.
4. Automate Reporting and Insights
Set up scheduled reports and SmartEmail notifications to deliver insights automatically—no manual data pulls required. TapClicks’ AI-powered agents can surface anomalies, trends, and optimization recommendations directly within your dashboards, transforming raw data into actionable guidance for smarter decision-making.
5. Optimize and Iterate
Monitor campaign performance in real time and use predictive analytics to inform budget allocation and strategy shifts. Continuously refine your dashboards as business requirements evolve, ensuring your reporting keeps pace with new channels, clients, or objectives.
Best Practices for Success
- Start simple: Focus on core metrics and expand dashboard complexity as your team grows comfortable.
- Train your teams: TapClicks offers onboarding resources and client support to maximize adoption and efficiency.
- Review regularly: Schedule periodic reviews to refine data sources, metrics, and report automation for ongoing optimization.
Ready to centralize your marketing analytics and unlock the power of automated reporting? Explore how TapClicks can unify your data, reporting, and workflow—delivering the insights you need to drive results at scale.
Start Automating Your Marketing Data Today!
No Credit Card Required.

