

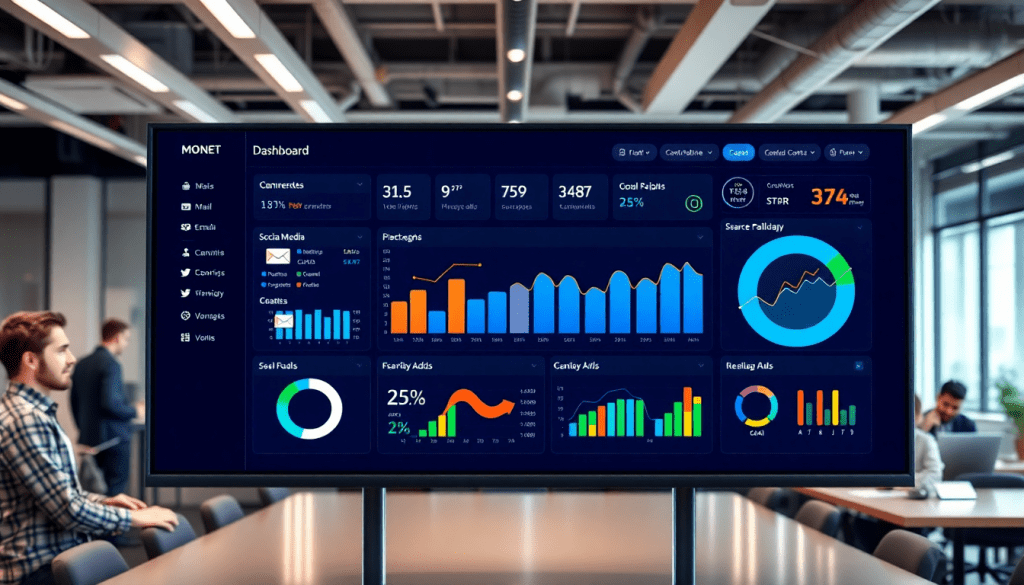
Multi-Channel Analytics Dashboard: Unified Marketing Insights
Understanding marketing performance across multiple channels can quickly become overwhelming without the right tools. A multi-channel analytics dashboard streamlines data aggregation, visualization, and reporting, enabling marketers to see the full picture and make smarter, data-driven decisions. This guide explores how TapClicks delivers a unified platform for cross-channel marketing analytics, automated insights, and campaign optimization—helping agencies and brands unlock greater ROI and marketing intelligence.
What is a Multi-Channel Analytics Dashboard?
A multi-channel analytics dashboard is your marketing team’s command center—a single, intuitive interface that brings together data from all your campaigns and platforms. No more toggling between spreadsheets or logging into each ad platform separately. Instead, you get a real-time, unified view of everything that matters.
Why Marketers Need a Multi-Channel Dashboard
Managing campaigns across multiple platforms can get messy fast. Each channel—social media, search, email, display, and more—produces its own siloed analytics. Pulling all that data together manually? It’s time-consuming, error-prone, and makes it tough to answer even basic performance questions.
A multi-channel dashboard solves this by:
- Aggregating data automatically from all your marketing sources
- Standardizing metrics so you can compare apples-to-apples across channels
- Visualizing trends and performance in real time
- Enabling quick, data-driven decisions for optimization and reporting
What Does a Good Multi-Channel Dashboard Provide?
Here’s what you should expect from a robust solution like TapClicks:
| Feature | What It Means for You |
|---|---|
| Unified Data View | See every channel—social, search, display, email—side by side |
| Automated Reporting | Save hours each week with scheduled, branded reports |
| Customizable Visualizations | Tailor dashboards for your team or each client |
| Real-Time Updates | Spot issues or opportunities as they happen |
| Cross-Channel Insights | Instantly compare campaign performance and ROI |
How TapClicks Makes a Difference
TapClicks is a leader in multi-channel analytics for agencies, brands, and enterprise teams. Here’s why:
- Connects to 10,000+ data sources: Social, search, programmatic, CRM, and more
- Automates dashboard creation: No more manual wrangling—just plug and play
- Streamlines client reporting: Schedule, brand, and share reports with a click
- Delivers actionable insights: AI surfaces trends and recommendations automatically
Want to see how TapClicks can turbocharge your analytics? See this quick overview on dashboard automation and agency reporting efficiency.
Bottom line:
A multi-channel analytics dashboard—especially one powered by TapClicks—empowers marketing teams to monitor everything in one place, optimize campaigns on the fly, and clearly prove the value of your efforts to stakeholders.
Key Benefits of Cross-Channel Marketing Analytics
For agencies and brands striving to maximize their marketing impact, the move to unified, cross-channel analytics is transformative. Instead of toggling between disconnected spreadsheets and dashboards, a unified reporting platform like TapClicks brings all your campaign data—social, search, email, display, and beyond—into a single, streamlined view. This delivers several powerful advantages.
Time Savings: Automated data aggregation and dashboard reporting dramatically reduce the hours spent manually pulling, cleaning, and consolidating information from disparate sources. Many TapClicks users reclaim 50+ hours per analyst each month by automating these processes. This enables teams to shift their focus from tedious data prep to strategic analysis and campaign optimization. Learn more about analytics reporting efficiency with automation.
Improved Accuracy: With all marketing data unified and normalized in one platform, there’s less risk of errors or inconsistencies that come from manual entry or merging reports from multiple vendors. TapClicks’ automated ETL/ELT pipelines and Smart Connectors ensure data accuracy and integrity, providing a reliable foundation for performance analysis and decision-making.
Holistic Campaign Insights: Cross-channel analytics allow marketers to see the full customer journey and how different channels interact. This holistic perspective uncovers trends, attribution paths, and optimization opportunities that are impossible to spot when data is siloed. TapClicks makes it easy to blend and visualize data across platforms, locations, and even clients, revealing which campaigns and channels truly drive results.
Enhanced ROI Tracking and Budget Allocation: Unified analytics provide a clear, real-time picture of marketing spend and performance across all channels. Marketers can quickly identify underperforming campaigns, optimize budget allocation, and justify spend with concrete ROI metrics. This empowers teams to demonstrate value to stakeholders and make proactive, data-driven adjustments.
In summary, cross-channel marketing analytics platforms like TapClicks don’t just simplify reporting—they unlock deeper insights, increase operational efficiency, and fuel better marketing outcomes. By centralizing data, automating workflows, and enabling comprehensive analysis, organizations gain the intelligence they need to drive growth and outpace the competition.
Get to Know the TapClicks Analytics Dashboard
The TapClicks analytics dashboard isn’t just another reporting tool—it’s your command center for unified, actionable marketing insights. Here’s how TapClicks empowers marketers, agencies, and brands to work smarter and faster.
Why Marketers Choose TapClicks
-
Unified Data, One View:
Aggregate campaign data from thousands of sources—social, search, display, email, and more—into a single, intuitive dashboard. -
Real-Time, Cross-Channel Visibility:
Compare and optimize performance across every client, channel, and location without juggling spreadsheets or jumping between platforms.
What Makes TapClicks Different?
Effortless Multi-Platform Reporting
- 10,000+ built-in marketing, advertising, and business connectors
- Smart Connectors for custom integrations
- Instantly visualize integrated metrics across all your clients or business units
Customization Without Limits
- Drag-and-drop dashboard builder for tailored visualizations
- Choose and highlight the KPIs that matter most
- Brand your reports with white-label features—perfect for agencies wanting client-ready, professional dashboards
Automated Reporting & Delivery
- Set up scheduled reports to keep clients and teams in the loop
- Eliminate repetitive manual work—save hours every week
- Ensure stakeholders always have the latest insights (without lifting a finger)
Built for Scale
| Designed For… | TapClicks Delivers… |
|---|---|
| Boutique Agencies | Easy onboarding, quick wins |
| Multi-Location Brands | Seamless roll-up across locations |
| Large Enterprises | High-volume data, clients, and reports |
| Media Companies | Role-based access and permissions |
No matter your size, TapClicks handles high-volume reporting and complex operations with ease.
See It in Action
-
Want more on dashboard automation and efficiency?
👉 Read our overview on the TapClicks blog -
Ready to transform your marketing operations?
👉 Visit the TapClicks website
With TapClicks, you’re not just reporting—you’re driving results.
How to Tame Marketing Data Chaos—Automatically
Juggling data from dozens of marketing platforms? You’re not alone—most teams struggle to keep up with the flood of metrics from search, social, display, CRM, and offline sources. Manual aggregation eats up hours and leaves room for error.
Why Automated Aggregation Matters
Here’s what manual data wrangling often leads to:
- Siloed spreadsheets—difficult to reconcile
- Inconsistent metrics—different naming conventions, timeframes, and formats
- Slower insights—by the time you prep your data, the moment has passed
How TapClicks Makes Data Unification Effortless
With TapClicks, you can:
- Connect to over 10,000 marketing, advertising, and business data sources (including niche or custom platforms via Smart Connectors)
- Automate ETL/ELT: Extract, transform, and load data seamlessly—no more manual uploads
- Normalize and enrich: Harmonize naming conventions, blend datasets across channels, locations, and clients
- Unify reporting: Bring all your metrics into a single dashboard for real-time, cross-channel insights
| TapClicks Data Workflow | What It Means for You |
|---|---|
| 10,000+ data connectors | Plug in nearly any platform instantly |
| Automated ETL/ELT pipelines | No more copy-pasting or CSV imports |
| Smart Connectors | Custom integrations for unique needs |
| Data enrichment tools | True apples-to-apples comparisons |
| Real-time dashboards | Immediate access to unified insights |
The Big Wins
- Accuracy: Automated aggregation reduces human error.
- Speed: Data is always up-to-date, so you can act fast.
- Focus: Less time prepping, more time strategizing and serving clients.
Want to see how automated reporting accelerates your analytics? Check out the TapClicks blog on dashboard automation.
One Source of Truth, Limitless Possibilities
With TapClicks, you get a consolidated, always-on view of every campaign, channel, and client. No duplication. No guesswork. Just clean, actionable data—ready whenever you need it.
Making Your Campaign Results Instantly Clear
TapClicks turns overwhelming marketing data into clear, actionable visuals—helping marketers and agencies quickly answer, “What’s working, and where should we optimize?”
What Can You See with TapClicks?
With TapClicks dashboards, you can track every critical metric across all your channels in one place:
- Impressions
- Clicks
- Conversions
- Spend
- CPC, CPA, CTR, and more
All data streams in from sources like search, social, display, email, and video—so you never have to juggle a dozen logins or spreadsheets.
Drill Down or Zoom Out—You’re in Control
Custom views let you focus on what matters most to your team or stakeholders:
- High-level performance summaries for executives
- Granular breakdowns by campaign, client, or location for analysts
- Multi-location or multi-client rollups for agencies and brands
- Funnel visualizations to spot bottlenecks and opportunities
Drag-and-drop widgets and a deep library of data visualizations (charts, tables, maps, and more) make it easy to build dashboards that match your objectives.
Real-Time Insights—No More Waiting
- Live data feeds: See the latest performance, not last week’s numbers.
- Automated reports: Schedule delivery to clients or internal teams, so everyone stays in the loop.
- Instant alerts: Get notified when KPIs spike or dip, so you can act fast.
ROI and Budget Pacing, Simplified
TapClicks helps you connect spend and results—across every channel:
| Feature | What It Does |
|---|---|
| ROI Calculation | Unifies spend + performance data to reveal true ROI by channel, campaign, or tactic |
| Cost-per-Acquisition | Breaks out CPA for each tactic or channel, helping you double down on what works |
| Budget Pacing | Monitors spend in real time vs. goals, alerting you before over- or under-spending |
For agencies and enterprises managing multiple clients or locations, TapClicks scales effortlessly—delivering both the big picture and detailed views as needed.
Why Visuals Matter
When you can transform raw data into intuitive dashboards, you:
- Tell a clear story about marketing impact
- Demonstrate value to clients and stakeholders
- Make smarter, faster optimization decisions
Ready to see dashboard automation in action?
Check out this deep dive on TapClicks dashboard automation, or learn more at TapClicks.
Automated Marketing Insights and Intelligence
Today’s marketing leaders need more than dashboards—they need instant, actionable intelligence. TapClicks makes this possible by embedding powerful AI-driven analytics into your everyday marketing workflow.
How TapClicks Transforms Data into Action
With TapClicks, you don’t just see your data—you get clear direction on what to do next.
Key Ways TapClicks’ AI Drives Smarter Marketing
-
SmartPilot: Your Always-On Analytics Assistant
- Continuously scans every connected dashboard and campaign dataset.
- Surfaces hidden trends, performance anomalies, and optimization opportunities in real time.
- Prioritizes insights so you know which campaigns need attention, which channels are overperforming, and where budget shifts could unlock greater ROI.
-
SmartEmail: Insights Delivered to Your Inbox
- Automated, plain-language summaries of campaign performance and key insights.
- Sent directly to internal teams or agency clients—no logging in or digging through dashboards required.
- Makes regular reporting cycles faster, clearer, and more transparent.
-
Campaign Scoring: Performance at a Glance
- Rates campaign effectiveness using both historical and real-time data.
- Instantly spot what's working, what's lagging, and where to focus next.
- Streamlines client reporting and helps teams prioritize optimization efforts.
What Does This Mean for Your Team?
By automating the process of insight generation, TapClicks:
- Cuts out hours (or days) of manual data analysis.
- Frees up your team to focus on creative and strategic work.
- Ensures you’re always operating with the latest, most relevant intelligence.
Result:
- Faster, more effective reporting cycles
- Sharper campaign decisions
- A truly data-driven marketing culture
Want to see how TapClicks can supercharge your analytics and reporting?
Check out our in-depth blog post on dashboard automation and smarter analytics.
How Does TapClicks Stack Up Against Other Multi-Channel Analytics Solutions?
Choosing the right marketing analytics platform can feel overwhelming. There are plenty of options—each promising seamless data integration and effortless reporting. But dig a little deeper, and you’ll find key differences in how these platforms actually support agencies, brands, and enterprise teams. Here’s a quick, side-by-side look at how TapClicks compares with Funnel.io, Agency Analytics, and Supermetrics.
What Sets TapClicks Apart?
TapClicks isn’t just a data pipe—it’s a unified marketing operations platform built for scale, automation, and actionable insight.
Let’s break it down:
TapClicks vs. Funnel.io
| Feature | TapClicks | Funnel.io |
|---|---|---|
| Core Function | Unified platform: data, dashboards, workflow, AI insights | Data pipeline—feeds data to external BI tools |
| Visualization | Built-in drag-and-drop dashboards | Requires external tools (Tableau, Data Studio, etc.) |
| Reporting | Automated, branded, and scheduled reports | Manual or external reporting |
| Workflow Management | Integrated order and campaign management | Not included |
| AI Insights | Proactive insights, recommendations | Not native |
| Best For | Agencies/brands needing end-to-end solution | Teams with strong external BI/analytics stack |
TapClicks vs. Agency Analytics
- Agency Analytics:
- Simple dashboards and automated reports
- Designed for small agencies or those with basic needs
- TapClicks:
- Built for high-volume, multi-location agencies
- Advanced role-based access and multi-client support
- Deep white-labeling and data enrichment
- Integrated order and workflow management
- Scales to handle enterprise complexity
TapClicks vs. Supermetrics
| Feature | TapClicks | Supermetrics |
|---|---|---|
| Data Integration | 10,000+ connectors, ETL/ELT, real-time pipelines | 100+ connectors, scheduled or manual transfers |
| Workflow Automation | Built-in campaign/order management | Not available |
| Reporting | Native dashboards & reporting | Requires Google Sheets, Data Studio, or Excel |
| AI & Insights | SmartPilot, SmartEmail, predictive analytics | Not offered |
| Team Collaboration | Centralized, role-based access | Limited |
Why Agencies and Brands Choose TapClicks
TapClicks combines:
- Scalability: Manage thousands of dashboards, clients, and locations from one place.
- Automation: Cut reporting and data prep time by 50+ hours per month, per analyst.
- AI-Powered Insights: Go beyond dashboards—get proactive recommendations and campaign scoring.
- Workflow Integration: Unify sales, ops, fulfillment, and analytics in a single platform.
- Flexibility: Use TapClicks as your source of truth or feed cleaned data to your BI stack.
The Bottom Line
If you’re looking for more than just a data aggregation tool—if you want automation, insight, and operational efficiency at scale—TapClicks is built for you.
Want a detailed feature-by-feature comparison?
Explore the full TapClicks vs. Funnel.io analysis.
How to Pick the Best Analytics Dashboard for Your Marketing Team
Choosing a multi-channel analytics dashboard isn’t just about today’s needs—it’s an investment in your team’s efficiency, scalability, and long-term success. With a crowded marketplace of reporting tools, here’s how to make the smartest choice for your agency, brand, or enterprise team.
What Should You Look for First?
1. Integration That Covers All Your Channels
- Does your team manage campaigns across search, social, display, email, OTT, and more?
- Seek platforms offering robust data connectors—no more manual exports or patchwork spreadsheets.
- Example: TapClicks unifies data from over 10,000 marketing, advertising, and business sources, so nothing is missed.
2. Built to Scale as You Grow
- Can the dashboard handle hundreds of clients, multiple locations, or rapid campaign expansion?
- Look for features such as:
- Automated creation of dashboards and scheduled reports
- Bulk management capabilities
- Support for high-volume users
- TapClicks Strength: Designed for agencies and brands needing thousands of dashboards and reports at once.
3. Smart Automation and Powerful Workflow Tools
- Does the dashboard:
- Automate routine reporting tasks?
- Enrich and normalize data automatically?
- Surface actionable insights proactively?
- Are there tools for collaboration and role-based access across sales, ops, and fulfillment teams?
- TapClicks Advantage: Combines analytics, workflow, and order management, letting you optimize campaigns—not just report on them.
4. Visualization and Customization That Work for Everyone
- Drag-and-drop widgets for building dashboards
- Custom branding and white-label options for agencies
- KPI tailoring for unique client or business goals
- Intuitive design for both marketing pros and executive stakeholders
| Feature | Why It Matters | TapClicks Example |
|---|---|---|
| Drag-and-drop dashboards | Fast, flexible report building | ✔️ Included |
| White-label branding | Agency/client presentation | ✔️ Included |
| KPI customization | Aligns with client objectives | ✔️ Included |
5. Support for Every Team, No Matter the Size
- Boutique agencies: Need fast-turn, client-ready dashboards
- Enterprise brands: Require consolidated analytics and strategic budget visibility
- Multi-location businesses: Want to roll up data across all regions
TapClicks is purpose-built for both ends of the spectrum—with white-label dashboards for agencies and advanced analytics for large, distributed brands.
Key Questions to Ask Before You Decide
- Will this platform unify all my data sources without extra tools?
- Can it scale as my client base or campaign portfolio grows?
- Does it automate the reporting and workflow processes I need?
- How flexible are the visualization and customization tools?
- Will it support both my current and future operational goals?
The Takeaway
By focusing on integration, scalability, automation, flexibility, and broad team support, you’ll set your marketing team up for cross-channel analytics success. TapClicks stands out by supporting the entire marketing reporting lifecycle—turning complex data into clear, actionable insights for any size team.
Conclusion
In today’s complex marketing landscape, the ability to unify, analyze, and act on data from every channel is not just a competitive edge—it’s a necessity. A multi-channel analytics dashboard transforms scattered data into comprehensive, actionable intelligence, empowering marketers to optimize spend, boost performance, and confidently demonstrate ROI. TapClicks stands at the forefront of this transformation, delivering a powerful, scalable platform that brings together automated data integration, AI-driven insights, and streamlined reporting—all in one place.
Whether you’re an agency juggling hundreds of client campaigns or an enterprise brand seeking a single source of truth, TapClicks provides the unified analytics foundation needed for smarter, faster marketing decisions. Ready to see how TapClicks can elevate your cross-channel marketing analytics? Explore the platform or request a personalized demo to experience the future of marketing operations firsthand.
Start Automating Your Marketing Data Today!
No Credit Card Required.

