

Multi-Channel Analytics Dashboard: Unified Marketing Insights
A multi-channel analytics dashboard streamlines the chaos of marketing data across platforms, turning scattered metrics into clear, actionable intelligence. Marketers today face an overwhelming number of channels, each with its own data silos and reporting quirks. With the right unified reporting platform, teams can connect data sources, visualize campaign performance, and uncover deep insights—without endless manual effort. In this guide, learn how a TapClicks analytics dashboard delivers seamless marketing data aggregation, automated insights, and true omnichannel analytics for agencies, brands, and enterprises.
What is a Multi-Channel Analytics Dashboard?
A multi-channel analytics dashboard is a centralized platform that consolidates marketing data from diverse channels—such as paid search, social media, display, email, and more—into a single, unified view. Instead of marketers jumping between scattered tools and spreadsheets, these dashboards aggregate key performance metrics in real time, making it easy to track, compare, and optimize campaigns across every channel.
At its core, a multi-channel dashboard automates the collection, normalization, and visualization of data. This means marketers can monitor everything from impressions and clicks to conversions and ROI, all in one place. The core functions typically include:
- Data aggregation: Seamlessly pulling metrics from various sources (ad platforms, CRMs, analytics tools, etc.).
- Cross-channel visualization: Presenting unified dashboards that show performance side-by-side, enabling apples-to-apples comparisons.
- ROI tracking: Connecting spend and results to quickly assess what’s working—and what’s not—across the full marketing mix.
Centralized reporting is critical for modern marketing teams. Without it, data silos and manual reporting create blind spots, slow down decision-making, and increase the risk of errors. A unified dashboard not only saves time but also empowers teams to make informed, data-driven decisions at scale.
TapClicks exemplifies this integrated approach. As a leading marketing operations platform, TapClicks brings together 10,000+ connectors, automated ETL pipelines, and a flexible dashboard studio. Marketers can blend data across channels, visualize performance through customizable widgets, and track ROI for every campaign—all within a single, user-friendly interface. By turning complex, multi-platform marketing data into clear, actionable intelligence, TapClicks helps agencies, brands, and enterprises unlock the full potential of their marketing investment.
Key Benefits of Unified Reporting Platforms
Unified reporting platforms fundamentally transform how marketers manage, analyze, and act on their data. Instead of wrangling spreadsheets and toggling between multiple dashboards, teams gain a single source of truth that delivers real-time clarity across every channel. Here’s how a unified dashboard solution—like TapClicks—creates tangible value for agencies, brands, and enterprises:
1. Major Time Savings Through Automation
One of the biggest pain points for marketing teams is the sheer volume of manual work involved in gathering and formatting data from disparate sources. Unified platforms automate data pulls from paid, social, search, display, and offline channels, eliminating hours spent on repetitive, error-prone tasks. According to TapClicks clients, this automation can cut reporting workload by more than 50 hours per analyst each month, freeing up time for higher-impact work. For a deeper dive, check out "How marketing dashboard automation boosts agency efficiency".
2. Consolidated Cross-Channel Performance Tracking
With data from every channel centralized in one dashboard, marketers can track campaign performance holistically. This cross-channel visibility makes it easier to compare results, spot trends, and measure the true impact of omnichannel strategies. Instead of siloed PPC, social, or email metrics, teams get a unified view of spend, conversions, and ROI across all touchpoints—empowering faster, more confident decisions.
3. Improved Decision-Making and Actionable Insights
Unified dashboards don’t just aggregate data—they deliver the context and clarity needed to act on it. With customizable visualizations and automated insights, teams can quickly identify what’s working, what’s not, and where to optimize. This level of visibility supports proactive decision-making, more agile budget allocation, and ultimately, better campaign outcomes.
4. Enhanced Client Transparency and Collaboration
For agencies and multi-location brands, unified reporting is a cornerstone of client trust. With real-time, role-based dashboards, clients and stakeholders can access up-to-date performance results whenever they need—without waiting for manual updates. This transparency not only strengthens relationships but also streamlines collaboration, ensuring everyone is aligned on goals and outcomes.
By consolidating and automating reporting, unified platforms like TapClicks empower marketers to focus less on wrangling data and more on driving results.
What Makes a Performance Tracking Dashboard Truly Effective?
Not all marketing dashboards are created equal. To turn your data into actionable insights (and real business results), it’s crucial to choose a platform that combines automation, flexibility, and intelligence. Here’s what you should be looking for:
Effortless Data Integration—No More Manual Work
A great dashboard should:
- Connect automatically to your marketing, advertising, and business platforms
- Support 10,000+ native connectors so you never need to export or import spreadsheets
- Unify all your data (paid search, social, email, offline channels) into a single source of truth
Why it matters: Every hour you save on manual data wrangling is an hour you can spend on strategy.
Dashboards That Fit Your Business Like a Glove
Look for:
- Drag-and-drop customization—build views for unique KPIs, campaigns, or clients
- Branded, scheduled reports delivered automatically to stakeholders
- Role-based access so each user sees what matters to them
Pro tip: Automated reporting can save analysts 50+ hours per month.
Visualize Everything, Compare Anything
Your dashboard should provide:
- Rich visualizations—track impressions, clicks, conversions, spend, and ROI at a glance
- Side-by-side channel comparisons (think: search vs. social vs. display)
- Integrated metrics—blend campaign data for trend spotting and quick outlier detection
Built-In AI Insights (So You’re Always One Step Ahead)
Expect:
- AI-generated summaries and recommendations (like TapClicks SmartPilot and SmartEmail)
- Automated anomaly detection—spot issues before they impact performance
- Predictive analytics for proactive budget pacing and optimization
Bottom line: AI turns reporting into real-time action.
Take Your Data Anywhere
Make sure your dashboard:
- Exports data easily for further analysis
- Integrates with BI tools like Tableau, Power BI, or Looker
- Plays nicely with your existing stack (so your marketing intelligence supports the wider business)
Quick Reference: Features Checklist
| Must-Have Feature | Why It Matters |
|---|---|
| Automated Data Integration | Saves time, reduces errors |
| Customizable Dashboards & Scheduled Reports | Fits unique client/campaign needs |
| Advanced Visualization & Integrated Metrics | Faster, better decision-making |
| AI-Driven Insights & Predictive Analytics | Proactive optimization, not just reporting |
| Data Export & BI Integration Flexibility | Supports collaboration and deeper analysis |
Ready to see these features in action? Explore how TapClicks brings them all together—so your team can spend less time building reports, and more time driving results.
TapClicks Makes Cross-Channel Marketing Analytics Effortless
TapClicks isn’t just a dashboard—it's your all-in-one command center for marketing analytics. Here’s how it transforms scattered data into unified, actionable insights:
Unified Data from 10,000+ Sources
With TapClicks, say goodbye to manual exports and disconnected spreadsheets. The platform offers:
- 10,000+ Native Connectors: Instantly pull in data from Google Ads, Facebook, TikTok, programmatic platforms, CRMs, and more.
- No-Code Setup: Onboard new channels without custom coding or IT bottlenecks.
- Automatic Data Flow: Set it and forget it—TapClicks keeps your data current and consolidated.
Drag-and-Drop Dashboards—No More Spreadsheet Wrangling
TapClicks makes reporting fast, visual, and client-ready:
- Flexible Visualization: Build custom dashboards with interactive charts, tables, and widgets.
- Branded Reporting: Create personalized views for each client or stakeholder.
- Deep Dives or High-Level Overviews: Slice data any way you need, from cross-channel trends to granular campaign details.
Automated Reporting That Saves Hours Every Week
Let TapClicks handle the repetitive work:
- Scheduled Delivery: Set reports to auto-send to teams or clients—daily, weekly, or monthly.
- Consistent Single Source of Truth: Everyone references the same up-to-date numbers, no matter the channel or campaign.
- Eliminate Manual Effort: No more late-night data pulls or slide deck edits.
True Omnichannel and Multi-Platform Analytics
TapClicks stands out for its ability to blend and normalize data across any marketing mix:
| Capability | What It Means for You |
|---|---|
| Cross-Channel Data Blending | Merge paid, organic, social, display, and offline data |
| Holistic ROI Tracking | Connect spend to outcomes and benchmark across campaigns |
| Multi-Location Rollups | Compare performance across brands or regions |
Real-Time Insights for Agile Decision-Making
With TapClicks, you’re never working with stale data:
- Always Up-to-Date: Automated data collection ensures reports reflect the latest results.
- Faster Optimization: Spot trends and pivot campaigns in real time.
- Stay Ahead: As discussed in this article, speed is a competitive edge.
Why TapClicks?
Whether you’re:
- Managing hundreds of client accounts,
- Orchestrating multi-channel campaigns,
- Overseeing enterprise-wide analytics,
TapClicks delivers the scale, flexibility, and intelligence you need to turn complex marketing data into a clear, actionable strategy.
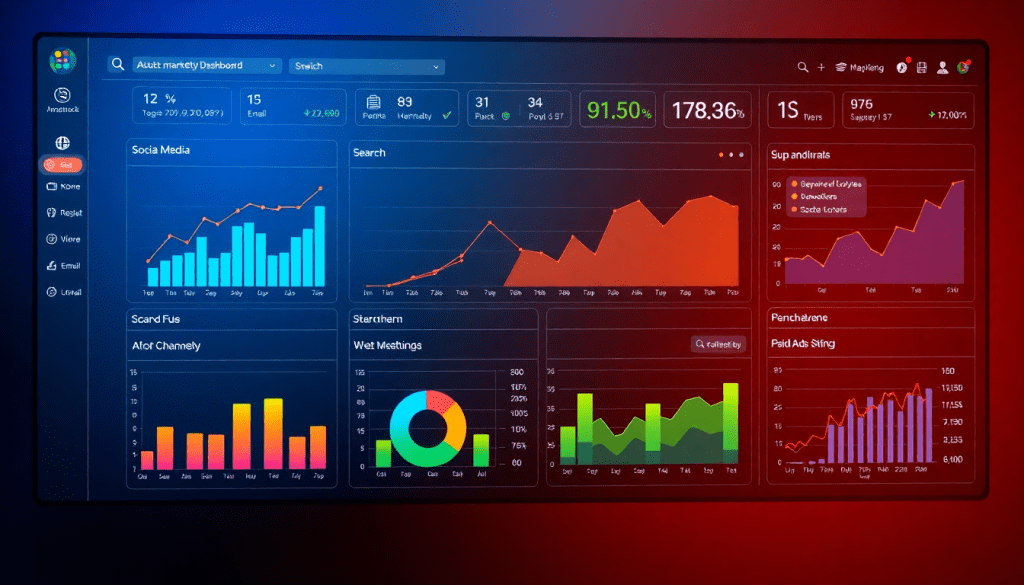
Visualizing Campaign Performance and ROI
Turning raw marketing data into actionable visual insights is at the heart of a multi-channel analytics dashboard. With platforms like TapClicks, marketers can transform complex datasets into intuitive, interactive dashboards—making it easy to track campaign performance and measure ROI in real time.
Dashboards offer a visual snapshot of key performance metrics across all your channels. For example, you can monitor ad spend, conversions, impressions, revenue, cost per lead (CPL), cost per acquisition (CPA), and return on ad spend (ROAS) across paid search, social, display, and more. By unifying these metrics in a single view, TapClicks enables you to quickly compare performance, identify which campaigns are driving the most value, and spot underperforming tactics that need attention.
Visualization tools like drag-and-drop charts, graphs, and scorecards let you benchmark results, track progress toward goals, and uncover trends. For instance, if your ROAS dips below target on a specific channel, it’s immediately visible—prompting quick optimization decisions. Similarly, visualizing spend and conversion data side-by-side helps you allocate budgets more effectively, ensuring resources are directed to the highest-impact campaigns.
Advanced dashboards also make it easy to share results with stakeholders, whether through dynamic live links or automated, branded reports. This transparency not only builds client trust but also fosters more strategic conversations around campaign performance and budget planning.
To see how automated data visualization can unlock new levels of insight, check out "Unlocking real-time marketing with automated data collection". By adopting a unified analytics dashboard, your team can move beyond spreadsheets and static reports—gaining the clarity needed to drive smarter, faster marketing decisions.
Learn more about how TapClicks empowers agencies and brands with powerful campaign visualization and ROI analytics at TapClicks.com.
Automated Marketing Insights for Smarter Decisions
Manual data analysis can consume countless hours, yet still leave marketers wondering what actions will actually move the needle. This is where automated marketing insights step in, transforming the way agencies, brands, and enterprise teams navigate campaign optimization. By leveraging AI-driven features, a multi-channel analytics dashboard can not only surface what’s happening across channels, but also recommend exactly what to do next—saving time and amplifying impact.
TapClicks leads the way with intelligent automation tools purpose-built for marketing operations. Features like SmartPilot use AI agents to continuously scan dashboards and datasets, flagging anomalies, highlighting trends, and surfacing actionable recommendations—whether it’s reallocating budget to high-performing channels or identifying underperforming campaigns before they drain resources. SmartEmail takes it a step further by automatically generating and delivering curated insight summaries to stakeholders, ensuring teams and clients are always in the loop, without the need to log in or sift through spreadsheets.
This automated approach to insights isn’t just about speed; it’s about smarter, more proactive decision-making. For agencies, automated recommendations can streamline client reporting, reduce manual analysis, and enable faster pivots when campaign conditions change. Brands benefit from real-time alerts and predictive modeling that help them optimize spend and maximize ROI across all their marketing channels. Enterprise teams, meanwhile, can empower every department with instant, role-based insights—no more waiting on the analytics queue.
To see how marketing dashboard automation can revolutionize analytics reporting and free up valuable team resources, check out "Marketing dashboard automation for analytics reporting". By integrating AI-powered insights directly into your unified dashboard, you move beyond passive data collection and enable a continuous cycle of measurement, learning, and optimization—at scale.
Explore how TapClicks can unlock automated marketing intelligence for your organization at tapclicks.com.
Integrating and Scaling Your Marketing Intelligence Reporting
Connecting disparate marketing data sources is one of the biggest challenges for modern marketing teams, especially as campaigns span multiple platforms, clients, and locations. A truly effective multi-channel analytics dashboard must not only bring all your marketing data under one roof, but also scale seamlessly as your organization grows.
Effortless Data Integration for Unified Metrics
TapClicks makes it simple to integrate data from thousands of marketing, advertising, and business platforms—whether you’re pulling in metrics from paid search, social media, programmatic, email, or offline channels. With over 10,000 pre-built data connectors and the flexibility of Smart Connectors, TapClicks enables you to automate ETL/ELT processes, blend datasets, and create a single source of truth for your marketing intelligence reporting. This eliminates manual data wrangling and allows you to focus on uncovering actionable insights.
Multi-Client, Multi-Location, and Enterprise-Scale Reporting
Whether you’re an agency managing hundreds of client accounts or a brand with dozens of locations, TapClicks is built to scale. The platform supports multi-tenant architecture, allowing you to manage separate dashboards, reports, and permissions for each client or business unit. Consolidated views make it easy to roll up performance metrics across locations or campaigns, while granular segmentation lets you drill down to the details that matter most.
Role-Based Access, Workflow Automation, and Collaboration
Security and collaboration are central to effective reporting at scale. TapClicks provides robust role-based access controls, so each team member—from sales to analysts to clients—sees only the data relevant to their role. TapWorkflow automates repetitive processes, streamlines order management, and enables cross-team collaboration, ensuring that everyone stays aligned and operational bottlenecks are minimized.
By integrating and scaling your marketing intelligence with a platform like TapClicks, you can unify data, automate reporting, and empower teams to make faster, smarter decisions—no matter how complex your marketing ecosystem becomes.
Getting Started with a TapClicks Analytics Dashboard
Embarking on your journey to unified marketing analytics with TapClicks is both straightforward and transformative. Here’s how to set up your multi-channel analytics dashboard for maximum impact:
1. Connect Your Data Sources
Begin by leveraging TapClicks’ vast library of over 10,000 marketing, advertising, and business data connectors. With just a few clicks, you can pull in data from paid search, social media, programmatic, email, and virtually any other channel you use. TapClicks’ automated ETL/ELT pipelines simplify the process—extracting, transforming, and loading all your marketing data into a single, centralized platform.
2. Design Custom Dashboards
Once your data is connected, use TapClicks’ intuitive drag-and-drop dashboard builder to create visualizations tailored to your business goals. Start with ready-made templates or build custom dashboards from scratch for each stakeholder—executives, campaign managers, or clients. Organize key metrics such as spend, conversions, CPA, ROAS, and channel-specific KPIs for a clear view of performance.
3. Set Up Automated Reports and Alerts
Take advantage of TapClicks’ automated, scheduled reporting features to deliver insights to the right people at the right time. Set up recurring reports for clients or internal teams, ensuring everyone stays informed without manual effort. You can also configure SmartEmail to automatically send AI-curated insight summaries, so stakeholders are always up to date on campaign performance and optimization opportunities.
4. Apply Best Practices for Dashboard Design
- Clarity First: Highlight the most important metrics and use clear, visual layouts.
- Actionable Insights: Incorporate TapClicks’ AI-driven recommendations (like SmartPilot) directly into your dashboards to surface optimization opportunities.
- Customization: Tailor dashboards for different audiences—executives may need high-level ROI tracking, while campaign managers benefit from granular, channel-specific data.
- Consistency: Standardize naming conventions and metric definitions to ensure everyone is speaking the same language.
5. Monitor, Optimize, and Scale
Use your TapClicks dashboard to benchmark performance, monitor trends, and identify optimization opportunities—whether you’re managing a handful of accounts or thousands. With role-based access and collaboration tools, you can empower teams to act on insights and scale your reporting operations seamlessly.
Ready to experience the power of unified marketing analytics? Explore TapClicks as your all-in-one solution for omnichannel data integration, reporting, and insight-driven growth.
Start Automating Your Marketing Data Today!
No Credit Card Required.

