

Multi-Channel Analytics Dashboard: Unified Marketing Insights
A multi-channel analytics dashboard is no longer a luxury—it's the backbone of modern marketing intelligence. When teams juggle paid search, social, display, email, and more, the ability to unify performance data into a single, actionable view makes all the difference. TapClicks delivers an all-in-one platform for cross-channel marketing analytics, campaign performance visualization, and automated insights, empowering marketers and agencies to monitor ROI, spot trends, and optimize results in real time. This guide explores how a unified reporting platform can streamline your analytics workflow, save hours on manual reporting, and drive smarter decisions across every channel.
What Is a Multi-Channel Analytics Dashboard?
A multi-channel analytics dashboard is your marketing command center—a single, streamlined hub that pulls together data from every corner of your digital ecosystem.
Instead of toggling between Google Ads, Facebook, email platforms, programmatic display, and SEO tools (and wrangling endless spreadsheets), you get one real-time interface for everything. Here’s why that matters:
What Makes Multi-Channel Dashboards Different?
Let’s break it down:
-
Single-Channel Dashboard:
Tracks data from just one source (e.g., a Google Ads dashboard focused only on paid search). -
Multi-Channel Dashboard:
Aggregates and visualizes metrics across all your platforms—search, social, email, display, SEO, and more.
Why Marketers Rely on Multi-Channel Dashboards
- Unified, Real-Time View:
See campaign performance across every channel at a glance. - Cross-Channel Insights:
Analyze how channels interact (e.g., how paid social boosts website conversions alongside email campaigns). - Data-Driven Decisions:
Identify top-performing campaigns, compare ROI by channel, and optimize spend with confidence. - No More Data Silos:
Eliminate manual data pulls and ensure everyone—marketing, sales, leadership, and clients—works from the same up-to-date insights.
Who Benefits Most?
Multi-channel dashboards are essential for:
- Agencies and media companies managing diverse client portfolios.
- Brands juggling multi-platform campaigns.
- Enterprise teams needing a consolidated view for strategic planning and reporting.
TapClicks: Your Multi-Channel Dashboard Powerhouse
With integrations to over 10,000+ marketing and business data sources, TapClicks makes it easy to:
| TapClicks Advantage | What It Means for You |
|---|---|
| Data Integration | Blend, normalize, and unify all your campaign data |
| Custom Dashboards & Reports | Visualize KPIs and trends in ways that matter to your team |
| Automated Insights & Alerts | Act quickly on what’s working—and what needs attention |
| Scalability | Designed for agencies, brands, and enterprises at scale |
Ready to see how a unified dashboard can transform your analytics workflow?
Explore more at the TapClicks homepage.
Why Unified Reporting Matters for Marketing Teams
Marketing teams today are inundated with data from a growing patchwork of platforms—Google Ads, Facebook, programmatic display, email, CRM systems, and more. Each of these tools often comes with its own analytics dashboard, but when teams rely on siloed, single-channel reporting, they face a host of challenges: duplicate data entry, inconsistent metrics, and an incomplete picture of performance. Fragmented analytics not only slow down reporting but also create opportunities for error and misaligned decision-making.
Unified reporting solves these pain points by consolidating multi-channel data into a single, integrated dashboard. With all marketing performance metrics visible in one place, teams can easily compare channels, spot cross-platform trends, and ensure that reporting is both timely and accurate. This centralization streamlines workflows—reducing the hours spent chasing down disparate spreadsheets and manual exports—and enables more agile, data-driven optimization across campaigns.
For agencies and in-house marketing teams alike, the benefits are substantial. Efficiency soars as reporting processes become automated and standardized, allowing analysts to focus on strategy instead of data wrangling. Accuracy improves, since unified dashboards reduce the risk of manual errors and offer consistent, up-to-date metrics for every stakeholder. Ultimately, integrated dashboards empower teams to deliver better results for clients and internal stakeholders, driving growth through smarter, faster decisions.
To see how marketing teams are using automation to boost their reporting efficiency, check out “Marketing Dashboard Automation: Boost Agency Reporting Efficiency.” This resource explores how platforms like TapClicks are transforming data chaos into actionable marketing intelligence.
Key Features of a Multi-Channel Analytics Dashboard
An effective multi-channel analytics dashboard is defined by its ability to bring clarity and cohesion to the chaos of modern marketing. To truly empower teams and agencies, the platform must offer a suite of features tailored for comprehensive insights, streamlined collaboration, and scalable operations. Here’s what to look for—and how TapClicks leads the way:
1. Customizable Dashboards for Every User and Client
No two marketing teams are identical, and neither are their reporting needs. A first-class dashboard allows users to customize views, metrics, and visualizations to match workflows and stakeholder goals. With TapClicks, teams can build drag-and-drop dashboards that spotlight KPIs by channel, campaign, or client, ensuring that both executives and account managers see the metrics that matter most.
2. Campaign Performance Visualization
Beyond static charts, advanced dashboards transform raw data into live, interactive visualizations. TapClicks’ reporting suite empowers users to monitor campaign status, channel mix, spend pacing, and conversion performance in real time—across paid search, social, display, email, and more. This holistic view makes it easy to identify what’s working, where to optimize, and how to allocate budgets.
3. ROI Tracking and Attribution
A unified dashboard isn’t just about data aggregation—it’s about connecting marketing efforts to business outcomes. TapClicks enables seamless ROI tracking, combining cross-channel performance data with conversion and revenue metrics. Marketers can measure true return on ad spend (ROAS), attribute results to the right touchpoints, and demonstrate bottom-line impact to stakeholders.
4. Automated Marketing Insights and Reporting
Manual data pulls and endless spreadsheet wrangling are relics of the past. TapClicks automates data integration across 10,000+ connectors, schedules branded reports, and delivers AI-powered insights directly to your inbox. Features like SmartEmail proactively surface anomalies, trends, and recommendations—so you spend less time hunting for insights and more time acting on them.
5. Integrated Marketing Metrics and Data Aggregation
The heart of a unified dashboard is seamless data aggregation. TapClicks excels at blending and normalizing metrics from disparate platforms, whether you’re managing hundreds of clients or dozens of locations. This unified dataset enables apples-to-apples comparisons, true omnichannel analysis, and centralized marketing intelligence reporting.
6. Role-Based Access and Collaboration Tools
For agencies and large teams, secure and customizable access is a must. TapClicks offers robust role-based permissions, allowing you to grant clients, sales, and fulfillment teams exactly the right level of visibility and control. Centralized order management and workflow tools streamline campaign execution and foster real-time collaboration across departments.
7. Automated Report Scheduling
Never miss a reporting deadline again. TapClicks’ automated report scheduling ensures that clients and internal teams receive up-to-date dashboards and performance summaries—on a daily, weekly, or monthly basis. This not only saves hours of manual effort but also boosts transparency and client satisfaction.
How TapClicks Stands Out
With its extensive data connector library, AI-driven insights, and scalable dashboard management, TapClicks delivers everything agencies and brands need to unify reporting, accelerate analytics, and drive better marketing decisions at scale. Whether you’re managing a handful of campaigns or thousands, TapClicks’ all-in-one platform turns multi-channel complexity into actionable clarity.
How Automated Insights Drive Smarter Campaign Decisions
Today’s marketers need more than just a sea of metrics—they need instant, actionable takeaways. Automated marketing insights transform dashboards from static scoreboards into dynamic command centers, giving you the edge to act fast and stay ahead.
Why Automated Insights Matter
- Raw data isn’t enough: Sifting through spreadsheets or toggling between siloed tools wastes time and hides opportunity.
- Actionable intelligence wins: Automated insights surface what matters most—trends, anomalies, and recommendations you might otherwise miss.
What Does This Look Like in Practice?
Imagine a dashboard that…
- Doesn’t just show paid social spend is up—but flags that your cost-per-acquisition is creeping above your target on Instagram.
- Spots that email campaigns in the Midwest are outperforming historical benchmarks.
- Recommends budget shifts or creative tweaks based on real-time performance—not just monthly reviews.
How TapClicks Supercharges Automated Insights
TapClicks takes automation further by combining AI, predictive models, and workflow tools:
| TapClicks Feature | What It Does for You |
|---|---|
| AI Agents | Auto-analyze cross-channel data to highlight: – Underperforming campaigns – Budget pacing alerts – Optimization recommendations |
| SmartEmail | Delivers AI-curated insight summaries right to your inbox—no need to log in or hunt for updates |
| Predictive Models | Benchmark performance, forecast results, and suggest action steps before issues arise |
| Automated Dashboards | Visualize prioritized action items, not just raw metrics |
The Real-World Impact
With automated insights from TapClicks, you can:
- Pivot campaigns instantly. Spot and act on opportunities before the competition.
- Allocate budget more efficiently. Shift spend to high-ROI channels in real time.
- Keep teams aligned. Everyone gets the same prioritized updates—without data overload.
See It in Action
Curious how real-time, automated data collection transforms decision-making? Check out our deep dive:
Unlocking Real-Time Marketing: The Power of Automated Data Collection for Brand Marketers
With TapClicks, you don’t just unify marketing intelligence—you amplify it. Move from reporting to results, faster than ever.
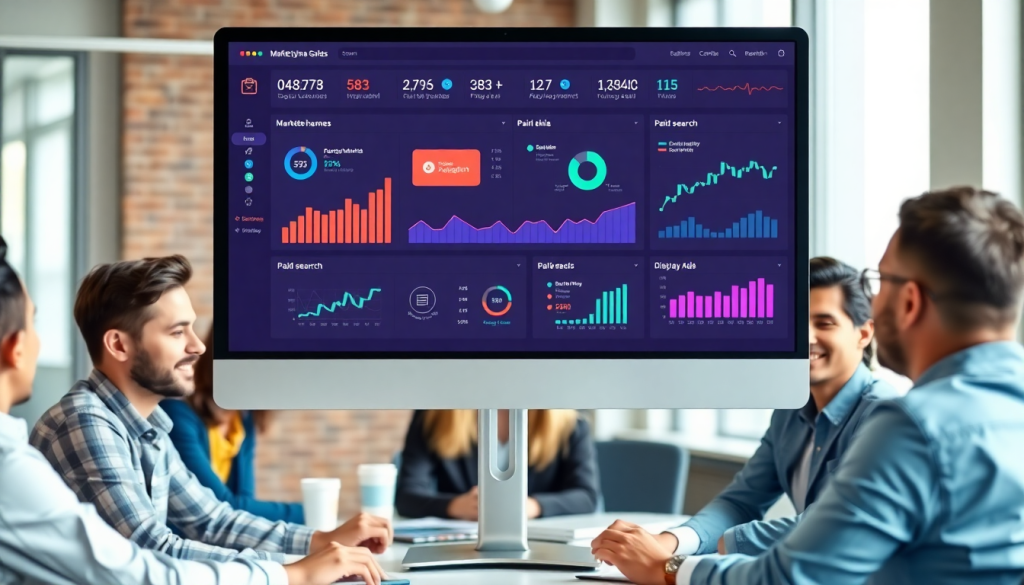
Visualizing Campaign Performance Across Channels
Multi-channel analytics dashboards transform raw marketing data into clear, actionable visualizations that empower agencies and brands to evaluate performance across every touchpoint—paid, owned, and earned media. With the right dashboard, marketers gain a panoramic view of campaign impact, eliminating the need to toggle between siloed platform reports or manually piece together Excel sheets.
Modern dashboards, like those offered by TapClicks, are designed to bring clarity to complexity. Through intuitive widgets and customizable layouts, users can instantly see channel-by-channel breakdowns, compare spend and engagement, and drill into conversion funnels—all within a single interface. For example, a campaign dashboard might feature:
- Channel performance widgets: Compare metrics like impressions, clicks, and conversions side by side for Google Ads, Facebook, email, and programmatic display.
- Conversion funnels: Visualize how leads move from initial ad exposure through to final sales, identifying drop-off points across multiple channels.
- ROI and budget pacing charts: Instantly track spend, revenue, and return on investment for each campaign, ensuring budgets are on track and underperforming channels are flagged for optimization.
For agencies managing multiple clients—or brands running campaigns across dozens of locations—multi-platform reporting software is not just a convenience, but a competitive edge. Stakeholders can filter dashboards by location, channel, or campaign objective, while role-based access ensures the right people see the right data. This level of clarity helps teams spot trends, make fast pivots, and transparently communicate results to clients or executives.
Ultimately, effective campaign performance visualization turns data overload into insight, making it possible to measure what matters, celebrate wins, and quickly spot opportunities for improvement. By leveraging an integrated dashboard solution, marketers can confidently optimize across every channel—driving smarter, more impactful campaigns.
Bringing All Your Marketing Data Together—Why It Matters
Today’s marketing teams juggle data from countless sources: Google Ads, Facebook, LinkedIn, TikTok, email platforms, web analytics, CRMs—you name it. The big challenge? Turning all these siloed numbers into a single, actionable story.
Why Centralize Your Marketing Data?
Here’s what happens when you unify your data:
- No more manual downloads: Say goodbye to exporting CSVs and merging spreadsheets from dozens of platforms.
- Holistic visibility: Every click, impression, and conversion—whether from paid search, social, or email—shows up in one place.
- Standardized metrics: Data normalization ensures that KPIs like impressions, clicks, spend, and conversions mean the same thing across every channel.
- Spot trends faster: Multi-channel dashboards help you identify what’s working (and what isn’t) at a glance.
- Confident reporting: With one source of truth, ROI calculations are accurate and client reports are a breeze.
What Does a Robust Analytics Dashboard Actually Do?
A great marketing analytics dashboard should:
- Connect seamlessly to ad networks, social channels, CRMs, and web analytics tools
- Aggregate and normalize data for apples-to-apples comparisons
- Offer automated, scheduled reporting for internal and client-facing needs
- Enable deeper insights with visualizations and customizable dashboards
| Feature | Why It Matters |
|---|---|
| 10,000+ Data Connectors | Pull in data from virtually any source |
| Automated ETL/ELT Pipeline | Save hours on data prep and cleaning |
| Data Enrichment | Blend web, CRM, and offline conversions |
| Flexible Data Destinations | Send cleaned data to TapClicks or your BI tool |
How TapClicks Makes It Effortless
TapClicks is built for omnichannel marketing data integration at scale. Here’s how it stands apart:
- 10,000+ marketing, advertising, and business data connectors
- Automated ETL/ELT pipelines: Extract, transform, and load data—either into TapClicks or your favorite BI tools (like Tableau or Power BI)
- Smart data enrichment: Blend and normalize data across channels, clients, or locations
- Real-time dashboards: Instantly visualize multi-channel performance and trends
Pro Tip: With TapClicks, agencies and brands can ditch manual wrangling and focus on strategy—spending less time on spreadsheets and more time optimizing campaigns.
Ready to see unified data integration in action? Explore TapClicks.
Real-World Benefits: Time Savings, Accuracy, and Growth
The impact of adopting a unified multi-channel analytics dashboard goes far beyond convenience—it translates directly into measurable business value. One of the most significant advantages is the substantial time savings realized by marketing teams. Manual data collection, spreadsheet wrangling, and repetitive report building can consume 50+ hours per analyst each month. By automating data aggregation and report generation, platforms like TapClicks free up valuable team resources, allowing marketers to focus on strategy and optimization instead of administrative tasks.
Accuracy and transparency also see marked improvements. When data flows automatically from over 10,000 marketing, advertising, and business sources into a single dashboard, there’s less room for human error and far greater consistency in reporting. Stakeholders can trust that the numbers they see reflect the latest campaign performance across every channel—no more version control headaches or out-of-date insights. This level of precision builds credibility with clients and leadership alike.
For many TapClicks customers, these benefits drive real growth. Agencies using TapClicks report that automated dashboard workflows have enabled them to scale client reporting without adding headcount, while brands gain a holistic view of marketing ROI across regions and channels. With enriched, normalized data at their fingertips, teams can quickly identify what’s working, double down on successful strategies, and course-correct campaigns in real time.
To see a deeper dive into analytics-driven efficiency, check out "Marketing Dashboard Automation: Boost Analytics Reporting". Or, learn more about how TapClicks supports smarter, faster marketing operations at TapClicks.com.
Choosing the Right Multi-Channel Analytics Dashboard
Selecting the ideal multi-channel analytics dashboard is a strategic decision that can define your marketing team's efficiency and impact. To ensure your platform will meet today’s demands—and scale with tomorrow’s growth—consider these key criteria:
1. Scalability and Performance:
As campaigns proliferate and clients multiply, your dashboard must handle high data volumes and complex reporting with ease. Platforms like TapClicks are engineered for scale, supporting thousands of dashboards and users without sacrificing speed or reliability. This is crucial for agencies and brands managing multi-location or enterprise demands.
2. Customization and Usability:
Look for solutions that offer drag-and-drop widgets, flexible dashboard layouts, and custom branding. The ability to tailor views for different stakeholders—executives, analysts, or clients—ensures everyone gets actionable insights in the format they need. TapClicks excels here, offering granular customization and automated, branded reporting.
3. Data Integration and Connectivity:
True omnichannel analytics requires seamless connections to all your marketing, advertising, and business data sources. Evaluate the breadth and depth of connectors; TapClicks stands out with 10,000+ pre-built integrations and the ability to build custom connectors for niche platforms, making it a leader in integrated marketing analytics.
4. Automation and Insights:
Manual reporting is a drain on resources. Choose a dashboard with robust automation features—scheduled reporting, AI-powered insights, and anomaly detection. TapClicks’ AI agents and SmartEmail deliver proactive recommendations and campaign summaries directly to your team’s inboxes, moving beyond static dashboards to real-time actionability.
5. Support and Ecosystem:
Evaluate the platform’s customer support, onboarding resources, and integration with your existing tech stack. Whether you need role-based access for agencies, or want to push data into external BI tools, TapClicks offers the flexibility and support needed for smooth adoption and long-term success.
When comparing TapClicks to alternatives like Funnel.io, Adverity, or Agency Analytics, its unified approach—blending scalable data integration, automated reporting, AI insights, and workflow tools—sets it apart. Many competitors are either lightweight point solutions or pure data pipes, whereas TapClicks acts as a marketing OS, consolidating operations in one place.
Ultimately, a unified reporting platform is essential for high-performing marketing teams. It empowers you to break down data silos, boost operational efficiency, and drive smarter, faster decisions—propelling your campaigns (and your business) forward.
Start Automating Your Marketing Data Today!
No Credit Card Required.

