

Multi-Channel Analytics Dashboard: Unified Marketing Insights
A multi-channel analytics dashboard brings all your marketing data—across platforms and campaigns—into one place for actionable insight. Instead of juggling spreadsheets or logging into multiple tools, marketers can visualize, analyze, and optimize performance from a single, unified reporting platform. With TapClicks, organizations automate marketing data aggregation, streamline campaign performance visualization, and unlock automated marketing insights that drive smarter, faster decisions. This guide explores how a multi-channel analytics dashboard supports omnichannel analytics, ROI tracking, and true marketing intelligence reporting at scale.
What Is a Multi-Channel Analytics Dashboard?
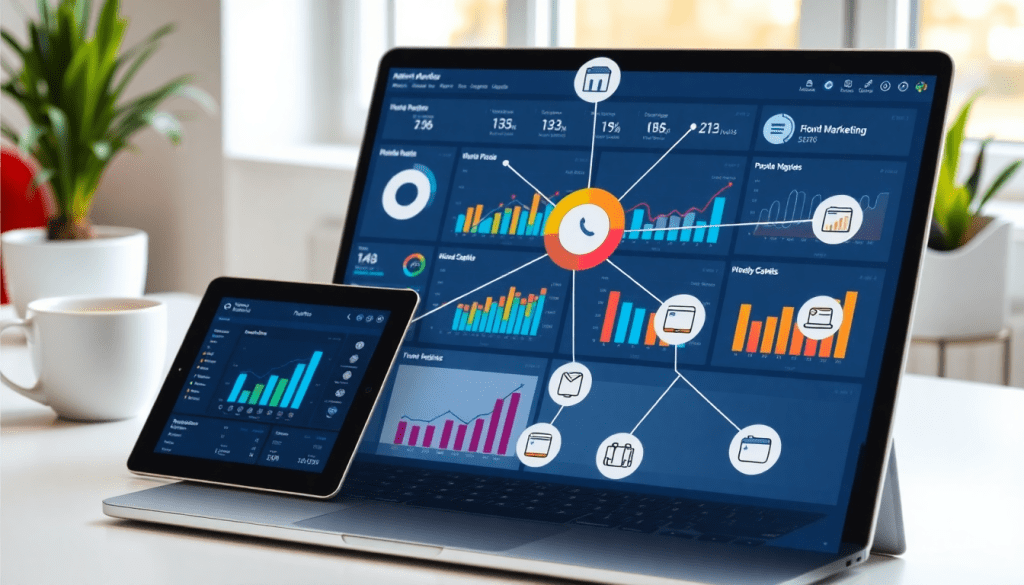
A multi-channel analytics dashboard is a centralized platform that aggregates, visualizes, and analyzes marketing data from multiple sources—such as social media, search, email, and display advertising—into a single, unified interface. Unlike traditional single-channel analytics tools, which only monitor performance within one platform at a time (for example, just Google Ads or only Facebook campaigns), a multi-channel dashboard enables marketing teams to view and compare results across all their digital channels simultaneously.
The core functions of a multi-channel analytics dashboard include automated data aggregation, real-time performance tracking, cross-channel campaign comparison, and actionable reporting. Marketers can quickly identify which channels are driving the best ROI, spot trends, and make data-driven decisions without toggling between platforms or managing cumbersome spreadsheets. These dashboards often support customizable views, role-based access, and advanced visualization tools to help teams zero in on the insights that matter most for their objectives.
The evolution from single-channel to cross-channel analytics is crucial in today’s marketing landscape. Consumers interact with brands across a variety of touchpoints—social feeds, search engines, websites, and more—making it impossible to understand the full customer journey with siloed data. Cross-channel analytics provide a holistic view, revealing how different campaigns and platforms work together to drive conversions, engagement, and revenue.
As marketing operations grow more complex, the need for unified reporting platforms like TapClicks has become essential. These solutions not only consolidate data from thousands of marketing and advertising sources but also empower teams to automate reporting, identify optimization opportunities, and scale their efforts efficiently. By transforming fragmented data into a single source of truth, a multi-channel analytics dashboard unlocks the ability to measure, compare, and improve marketing performance at scale.
Why Unified Reporting Matters for Marketing Teams
For today’s marketing teams, the complexity of managing campaigns across dozens of digital and offline channels is a double-edged sword. While the opportunities for reach and engagement have never been greater, so too has the challenge of wrangling fragmented data. When performance metrics are scattered across platforms—think Facebook Ads, Google Analytics, email systems, and programmatic buys—teams often find themselves drowning in spreadsheets, logging into multiple tools, and manually stitching together reports. This fragmented data landscape not only wastes time but also increases the risk of errors and makes it difficult to see the full picture of marketing ROI.
Unified reporting platforms, like those offered by TapClicks, address these challenges by consolidating all marketing data streams into a single source of truth. Instead of chasing down numbers from disparate systems, marketers get a holistic, real-time view of campaign performance. This integration empowers teams to make data-driven decisions quickly, spotting trends, budget anomalies, or optimization opportunities before they impact results.
Integrated marketing metrics are essential for effective decision-making. When all channels are visualized together, it’s easier to understand cross-channel influence, attribute conversions accurately, and identify which tactics are truly driving growth. Automated dashboard reporting further elevates this process—by eliminating manual data pulls and report generation, teams save dozens of hours per month and can focus on interpreting insights rather than wrangling data. As highlighted in this article on marketing dashboard automation, these efficiencies enable agencies and in-house teams alike to deliver more timely, accurate, and actionable reports to stakeholders.
Ultimately, unified reporting is not just about operational efficiency—it’s about enabling marketing teams to move faster, react smarter, and demonstrate value with confidence. By centralizing data and automating insights, platforms like TapClicks help organizations transform fragmented information into the strategic intelligence needed to outpace the competition.
Core Features of a Powerful Multi-Channel Analytics Dashboard
A truly effective multi-channel analytics dashboard does more than just collect data—it transforms raw numbers into actionable business intelligence that empowers marketing teams to deliver results across every channel. Here are the core features that set a powerful dashboard apart, along with the unique advantages TapClicks brings to organizations seeking unified marketing insight at scale.
1. Campaign Performance Visualization
The heart of any analytics dashboard is its ability to turn complex, multi-platform data into clear, intuitive visualizations. Marketers need to see the big picture and drill down into channel, campaign, or creative-level performance at a glance. TapClicks provides dynamic, drag-and-drop dashboards that aggregate all your marketing KPIs—impressions, clicks, conversions, spend, and more—across search, social, programmatic, email, and offline campaigns. This centralized view eliminates data silos and surfaces trends instantly, fueling faster, data-driven decisions.
2. ROI Tracking Dashboard
Understanding which initiatives generate the most value is critical. A robust multi-channel dashboard offers real-time ROI tracking, tying spend directly to outcomes such as leads, sales, and revenue. TapClicks’ ROI tracking dashboards automate the process, mapping cost to conversions and revenue across every channel, so marketers can quickly see where budget is working hardest and optimize allocation for maximum return.
3. Marketing Data Aggregation
Manually wrangling data from dozens of ad platforms, analytics tools, and CRM systems is time-consuming and error-prone. TapClicks solves this with over 10,000 marketing, advertising, and business data connectors, automating data aggregation and normalization at scale. This enables seamless blending of cross-channel, multi-location, and multi-client datasets—delivering a unified source of truth with no manual effort required.
4. Performance Tracking Dashboard
Beyond just reporting, ongoing campaign monitoring is essential for agile optimization. TapClicks offers customizable performance tracking dashboards that update in real time, allowing teams to set alerts, monitor pacing, and react quickly to shifts in performance. This level of visibility makes it easy to catch issues early, double down on what’s working, and maximize every marketing dollar.
TapClicks’ Game-Changing Strengths
What truly sets TapClicks apart is its combination of automation, scalability, and AI-powered insight. With real-time analytics and AI tools, TapClicks goes beyond reporting by automatically surfacing actionable recommendations, scoring campaigns, and generating SmartEmail summaries for stakeholders. Its omnichannel analytics solution is built to scale—handling thousands of dashboards, clients, and campaigns simultaneously—making it a trusted platform for agencies, media companies, and enterprise brands alike.
When evaluating multi-channel analytics dashboards, look for a platform that not only aggregates and visualizes your marketing data, but also delivers the automated insights and scalability your business needs to grow. Learn more about how TapClicks powers unified marketing intelligence at tapclicks.com.
How TapClicks Streamlines Multi-Platform Reporting
The complexity of modern marketing means data lives everywhere: search, social, programmatic, email, and dozens of campaign tools. TapClicks eliminates this fragmentation by offering a robust data integration engine that connects with over 10,000 marketing, advertising, and business platforms. Whether you need to unify Google Ads, Facebook, TikTok, Salesforce, or niche adtech stacks, TapClicks’ Smart Connectors and automated ETL/ELT pipelines pull data into a single, normalized hub—no manual exports or late-night spreadsheet wrangling required.
Beyond just aggregating information, TapClicks empowers marketing teams with workflow automation and AI-driven insights. From campaign order management to customizable dashboards, TapClicks automates routine tasks and keeps stakeholders aligned throughout the entire campaign lifecycle. This not only accelerates onboarding and reporting for new clients or campaigns but also ensures that sales, ops, and fulfillment teams can collaborate seamlessly within a centralized environment.
One of TapClicks’ standout advantages is the integration of AI agents and predictive analytics directly into the dashboard experience. As data flows in, TapClicks surfaces actionable insights—flagging anomalies, benchmarking performance, and recommending optimizations across channels. Automated reports and SmartEmail summaries keep both internal teams and clients informed in real time, delivering clarity without the manual lift.
The result? Dramatic time savings and operational efficiency. According to this post, TapClicks users often reduce reporting workload by 50+ hours per analyst each month. Marketers spend less time wrangling data and more time acting on insights—driving better results across all platforms, for every client or brand. In short, TapClicks turns multi-platform chaos into streamlined, scalable marketing intelligence.
Setting Up and Customizing Your TapClicks Analytics Dashboard
Getting started with a TapClicks analytics dashboard is straightforward, and the platform’s flexibility ensures you can tailor reporting for any marketing operation—whether you’re an agency managing hundreds of clients or a brand unifying data across locations and channels. Here’s how to set up and customize your dashboard for maximum impact:
Step 1: Connect Your Data Sources
Begin by linking all your marketing, advertising, and business platforms through TapClicks’ expansive library of over 10,000 connectors. Whether you need to import social, search, programmatic, email, or offline data, the Smart Connector system supports fast, automated integrations. Simply select your channels (like Google Ads, Facebook, LinkedIn, or custom CRMs), authenticate, and TapClicks will start aggregating your data in real time.
Step 2: Build Your First Dashboard
Once your data is flowing, head to the TapAnalytics dashboard builder. Use the intuitive drag-and-drop interface to add key performance widgets—such as campaign spend, conversions, impressions, and ROI metrics. You can create multiple dashboards for different purposes: high-level executive summaries, detailed channel breakdowns, or campaign-specific overviews.
Step 3: Customize by Channel, Client, or Campaign
TapClicks excels at granular customization. Filter and segment data by channel (e.g., paid search, social, display), by individual client or brand division, or by specific campaigns and timeframes. This means you can provide each stakeholder—whether it’s an internal team or an external client—with a tailored view relevant to their objectives. Use grouping and comparison features to benchmark performance across regions, products, or creative variants.
Step 4: Enable Role-Based Access and Permissions
Collaborative marketing operations demand secure, role-based access. Within TapClicks, you can assign different permissions to users based on their role—allowing account managers, analysts, executives, or clients to access only the data and dashboards relevant to them. This not only safeguards sensitive information, but also streamlines the user experience for each team or client.
Step 5: Brand and Automate Your Reporting
Elevate your reporting by applying your branding—logos, color schemes, and custom domain options ensure a seamless client experience. Schedule automated reports to deliver insights directly to stakeholders’ inboxes at customized intervals. With TapClicks’ SmartEmail feature, you can even trigger AI-curated summaries, so everyone gets actionable highlights without having to log in daily.
Pro Tips for Customization and Scale:
- Use dashboard templates to quickly roll out standardized reporting across multiple clients or verticals.
- Leverage TapClicks’ enrichment tools to blend data from disparate sources for holistic, cross-channel analysis.
- For agencies and multi-location brands, take advantage of white-labeled portals to reinforce your brand identity in every client touchpoint.
With these steps, TapClicks empowers you to create a unified analytics environment that adapts to your unique marketing ecosystem. To learn more about how TapClicks can transform your reporting and workflow, visit TapClicks.
Maximizing ROI with Automated Marketing Insights
In today’s fast-paced, multi-channel marketing environment, maximizing return on investment (ROI) depends on your ability to act on insights quickly and confidently. Traditional reporting methods—manual data pulls, static spreadsheets, and labor-intensive analysis—simply can’t keep up. That’s where automated marketing insights in a unified analytics dashboard like TapClicks become game-changers, empowering marketers to optimize campaigns in real time and allocate budgets with precision.
Accelerate Optimization with AI-Driven Insights
Automated insights powered by AI sift through vast volumes of campaign data—across platforms, channels, and locations—to instantly identify what’s working and what’s not. TapClicks’ AI Agents and SmartEmail capabilities, for example, proactively surface anomalies, performance trends, and optimization opportunities directly to stakeholders’ inboxes. This means marketers can spot underperforming channels, sudden cost spikes, or emerging audience segments without having to dig through dashboards or wait for manual reports.
Smarter Budget Allocation for Maximum Impact
With predictive analytics and budget pacing tools, TapClicks enables teams to not only monitor spend but also forecast outcomes and adjust investments proactively. Imagine a scenario where your dashboard flags that paid social campaigns are yielding higher than average cost-per-acquisition compared to search. With automated recommendations, you can swiftly reallocate budget to better-performing channels, ensuring every marketing dollar delivers maximum impact.
Real-World Performance Gains
Agencies and brands leveraging automated insights consistently report significant improvements in campaign outcomes. For example, a multi-location retail chain using TapClicks’ omnichannel analytics solution reduced their reporting workload by over 50 hours per analyst per month. More importantly, they uncovered a hidden high-ROI channel—previously masked by siloed data—and doubled conversion rates after reallocating budget, all thanks to automated, actionable insights delivered by their dashboard.
AI-Powered Optimization Across Channels
TapClicks’ predictive models don’t just report on historical performance—they suggest next best actions, benchmark results against industry standards, and even flag potential risks before they impact ROI. Whether optimizing for cost efficiency, lead quality, or customer lifetime value, automated insights empower marketers to make data-driven decisions at scale. The result: campaigns that aren’t just tracked, but continuously fine-tuned for optimal results across every channel.
For a deeper dive into how real-time analytics and AI tools drive smarter marketing, explore this in-depth guide on marketing dashboard automation and AI.
By harnessing automated marketing insights within a unified analytics platform, organizations transform raw data into continuous ROI gains—unlocking the full potential of every marketing dollar.
Comparing Multi-Channel Analytics Solutions
When evaluating multi-channel analytics dashboards, it's crucial to consider factors like scalability, automation, depth of insights, and workflow integration. Popular platforms such as Supermetrics, Funnel.io, and Agency Analytics offer useful data aggregation and reporting tools, but each comes with its own strengths and limitations.
Supermetrics is well-regarded for its data pipeline capabilities, allowing marketers to pull data from a wide array of sources into spreadsheets or BI tools. However, it primarily acts as a connector, lacking built-in analytics dashboards or advanced visualization features out of the box. Similarly, Funnel.io excels at automated data extraction and normalization. While it feeds clean data into analytics and visualization platforms, its focus is on ETL (Extract, Transform, Load) rather than providing a comprehensive, unified reporting environment.
Agency Analytics and NinjaCat are tailored for agencies managing multiple clients, offering branded dashboards and some client-facing reporting automation. However, these tools are often more lightweight, with basic visualization and limited cross-channel analytics or AI-driven insights.
TapClicks stands apart as a true “marketing OS.” With over 10,000 connectors, TapClicks not only aggregates and normalizes data from virtually any marketing or advertising platform but also provides a robust, drag-and-drop dashboard builder, advanced reporting automation, and AI-powered insights. Its workflow automation features—like order management, role-based access, and collaboration tools—are purpose-built for agencies and large brands managing high volumes and complex campaign structures.
Unlike point solutions focused on either data movement or lightweight reporting, TapClicks delivers:
- Unified Scale: Handle thousands of dashboards and clients within a single platform, perfect for agencies and enterprise teams.
- AI Insights: Go beyond dashboards with automated recommendations, campaign scoring, and predictive analytics to drive optimization.
- Workflow Automation: Streamline marketing operations end-to-end, from order intake to fulfillment and reporting.
- Flexible Data Exports: Use TapClicks as your single source of truth or seamlessly pipe enriched data to BI tools like Tableau, Power BI, or Looker for further analysis, enabling maximum flexibility.
When choosing a multi-channel analytics dashboard, consider not just where your data lives, but how quickly and intelligently you can transform that data into action. TapClicks’ combination of unified scale, AI-driven intelligence, and workflow automation delivers a comprehensive solution for agencies, media companies, and enterprise marketing teams seeking true marketing intelligence at scale.
Getting the Most Out of Your Unified Analytics Platform
A unified analytics platform is only as powerful as the processes and strategies you put behind it. To truly unlock the value of a multi-channel analytics dashboard, organizations must move beyond initial setup and adopt ongoing best practices for dashboard management, reporting, and cross-team collaboration. Here’s how to ensure your analytics platform remains a driver of continuous marketing performance improvement.
1. Establish a Routine for Dashboard Review and Optimization
Regularly scheduled reviews of your dashboards keep your reporting relevant and actionable. Set weekly or monthly sessions to evaluate key metrics, flag anomalies, and update goals as campaigns evolve. Leveraging features like automated alerts and AI-driven recommendations—such as those provided by TapClicks—helps surface insights that may otherwise go unnoticed.
2. Foster a Data-Driven Culture Across Teams
Encourage collaboration by granting role-based access to dashboards for stakeholders in marketing, sales, operations, and leadership. This transparency ensures everyone is working from the same source of truth and can act on unified insights. Collaborative annotation tools, shared dashboards, and automated summary reports can all enhance alignment and accelerate decision-making.
3. Continuously Refine Integrated Marketing Metrics
Your business doesn’t stand still—neither should your metrics. Periodically reassess which KPIs are most meaningful for your objectives. TapClicks’ flexible dashboard customization lets you adjust visualizations, add new data sources, and blend metrics across channels or clients as your strategy shifts. This agility supports better attribution modeling, more accurate ROI tracking, and a deeper understanding of omnichannel performance.
4. Automate Where Possible, Analyze Where It Matters
Take full advantage of your platform’s automation capabilities for data aggregation, report distribution, and routine campaign monitoring. This frees your team to focus on higher-value strategic analysis and optimization. For example, TapClicks’ automated dashboard reporting and predictive insights save hours of manual work each week—so your analysts can spend more time uncovering growth opportunities.
5. Leverage Cross-Team Feedback for Continuous Improvement
Regularly solicit feedback from all dashboard users to identify gaps, clarify reporting needs, and discover new use cases. Iterative improvements based on real-world input ensure your analytics platform evolves alongside your organization’s goals.
By following these best practices and maintaining a proactive approach to dashboard management, your unified analytics platform can become a true marketing intelligence engine. For more on maximizing the impact of your marketing operations, explore the capabilities of TapClicks and discover how automation, AI insights, and cross-team collaboration can elevate your analytics strategy.
Start Automating Your Marketing Data Today!
No Credit Card Required.

