

Multi-Channel Analytics Dashboard: Unified Marketing Insights
A multi-channel analytics dashboard is more than just a collection of charts—it’s the nerve center for modern marketing teams striving to make smarter, faster decisions. By weaving together data from disparate platforms into a unified reporting environment, these dashboards empower marketers to visualize performance, track ROI, and surface actionable insights across every campaign and channel. With solutions like the TapClicks analytics dashboard, organizations can automate reporting, streamline data aggregation, and unlock a new level of marketing intelligence that simply isn’t possible with siloed spreadsheets or single-channel tools. Here’s how a truly integrated dashboard transforms marketing performance and decision-making.
What is a Multi-Channel Analytics Dashboard?
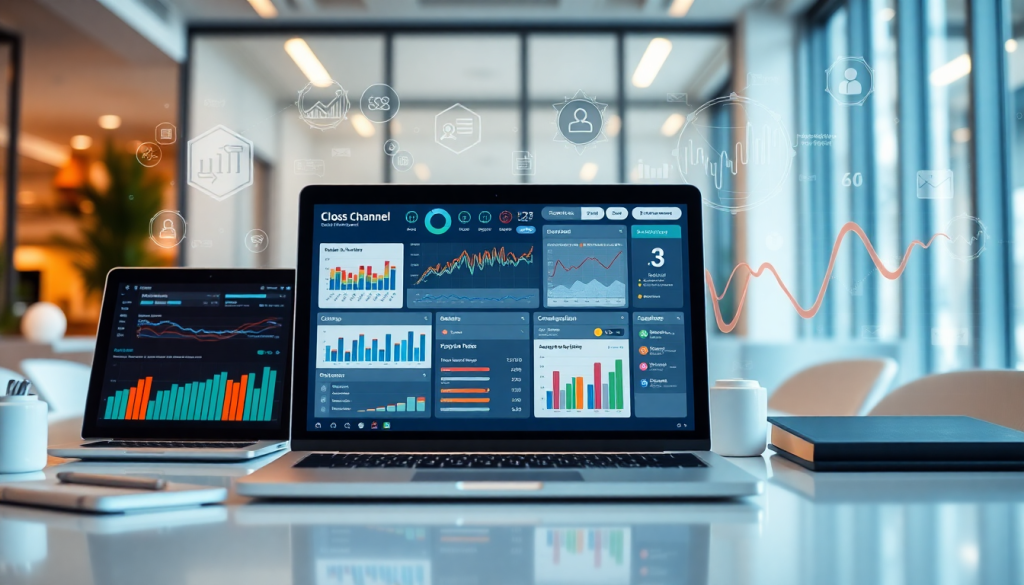
A multi-channel analytics dashboard is a centralized, digital workspace that unifies marketing data from all your platforms—search, social, display, email, and even offline channels—into a single, cohesive view. Instead of jumping between siloed dashboards or wrangling spreadsheets from different sources, marketers leverage these dashboards to see the complete picture of their campaigns’ performance at a glance.
The core concept of a multi-channel dashboard is unified reporting. This means data from Google Ads, Facebook, LinkedIn, programmatic platforms, and countless other sources are aggregated, cleaned, and normalized so teams can compare metrics side by side. Unlike single-channel analytics tools, which focus on just one source (like Google Analytics or Facebook Insights), a multi-channel dashboard enables true cross-channel marketing analytics. This empowers marketers to identify trends, attribute conversions, and optimize spend holistically, rather than making decisions in a vacuum.
Why is this level of marketing data aggregation so essential? Without it, insights are fragmented. Campaigns often touch multiple touchpoints before converting, and only by blending data from every channel can you get accurate, holistic insights into what’s driving results. Unified dashboards eliminate guesswork, reduce manual reporting errors, and create a foundation for data-driven decisions that move the needle for your business. For organizations ready to streamline and scale their analytics, platforms like TapClicks make it possible to bring all your marketing data together—and finally turn scattered numbers into actionable intelligence.
Why Unified Reporting Platforms Are a Game-Changer for Marketing Teams
Centralizing your analytics and reporting isn’t just about convenience—it’s about unlocking efficiency, accuracy, and collaboration at scale. Here’s how unified reporting platforms like TapClicks can completely change the way your team works:
Major Benefits at a Glance
-
Save Dozens of Hours, Every Month
- Automated data pulls from hundreds of sources—no more manual spreadsheet wrangling.
- Real-world results: Teams regularly cut 50+ hours per analyst per month.
-
Boost Data Accuracy and Consistency
- Eliminate copy-paste errors and outdated numbers.
- Everyone accesses the same, up-to-date dataset across the organization.
- Builds trust with clients and stakeholders by reducing costly reporting mistakes.
-
Foster Seamless Collaboration
- All your marketing data lives in one dashboard.
- Role-based access (a TapClicks specialty) ensures each team member or client sees only what’s relevant.
- No more waiting for manual updates or tracking down numbers from multiple departments.
-
Accelerate Smarter, Faster Decisions
- Real-time insights surface instantly, not days or weeks later.
- Teams can pivot campaigns, optimize spend, and seize new opportunities with confidence.
- Data-driven decisions, not guesswork, drive campaign performance.
How TapClicks Delivers These Benefits
| Feature | How It Helps Your Team |
|---|---|
| Automated Reporting | Frees up time for strategy and service |
| AI-Driven Insights | Surfaces actionable recommendations |
| Customizable Dashboards | Tailors views for each stakeholder |
| Role-Based Access | Ensures secure, relevant data sharing |
Ready to Boost Your Marketing Operations?
TapClicks is built for agencies, brands, and media companies managing complex, multi-channel campaigns. Its unified approach means:
- Fewer tools to juggle
- More time for creative and strategic work
- Greater transparency and accountability
Explore more about TapClicks or discover agency reporting efficiency tips to see how unified reporting can transform your workflows.
In summary:
Unified reporting platforms aren’t just a nice-to-have—they’re the backbone of high-performing, data-driven marketing teams. By saving time, reducing errors, and enabling smarter decisions, they set the stage for real growth.
What Makes a Modern Performance Tracking Dashboard Truly Effective?
Today’s marketers expect dashboards to do more than just display numbers—they want tools that reveal what’s working, where to invest, and how to prove results to clients and stakeholders. Here’s how standout dashboards, like TapClicks, deliver on those expectations:
Instantly See What’s Driving Results
Top dashboards make campaign performance obvious, not obscure.
- Drag-and-drop visualization: Instantly customize dashboards to compare impressions, clicks, conversions, or revenue across every channel.
- Macro and micro views: Zoom in on a single campaign or zoom out for a big-picture, cross-channel summary.
- Real-time clarity: No waiting for overnight updates—see live performance and pivot fast.
Get ROI Answers Without the Guesswork
ROI isn’t just a metric—it’s your evidence of impact.
- Automated ROI calculations: See spend versus results, automatically, by channel, campaign, or client.
- Budget pacing: Monitor spend to avoid over- or under-investment.
- Performance benchmarks: Instantly spot high-performers and underachievers for quick optimization.
One Dashboard, Hundreds of Data Sources
The modern marketer juggles more than just Google and Facebook.
- Aggregate everything: Connect to thousands of platforms—ad networks, social, email, CRM, offline—with TapClicks’ 10,000+ connectors.
- Unified reporting: No more copy-pasting spreadsheets; get omnichannel analytics in one place.
- Executive-ready summaries: Support both deep dives and big-picture overviews, perfect for all stakeholders.
Let AI Find Insights—So You Don’t Have To
More data isn’t better—smarter insights are.
- AI-powered agents: Automatically surface trends, anomalies, and optimization ideas.
- SmartEmail: Get curated, actionable findings delivered right to your inbox for faster decision-making.
- No more buried insights: Critical information rises to the top, not lost in endless rows of data.
All Your KPIs, Truly Integrated
Cross-channel clarity is the new marketing superpower.
- Metric normalization: Blend and standardize data from different channels for “apples-to-apples” comparisons.
- Single source of truth: Avoid the pitfalls (and confusion) of siloed reporting.
- Efficient performance tracking: Instantly spot opportunities and risks across every touchpoint.
| Key Feature | What It Means for You | TapClicks Advantage |
|---|---|---|
| Campaign Visualization | Instantly see what’s working | Drag-and-drop, real-time dashboards |
| ROI Tracking | Prove and optimize marketing spend | Automated ROI and budget pacing |
| Multi-Platform Data Integration | Every channel, every campaign, one view | 10,000+ data connectors, unified reporting |
| Automated Insights | Smarter, faster decisions—no manual digging | AI Agents, SmartEmail, actionable findings |
| Integrated Metrics | Consistent, comparable KPIs across channels | Normalized data, cross-channel analytics |
Together, these features mean your dashboard becomes a true command center—empowering channel managers, strategists, and executives alike to make data-driven decisions, maximize results, and stay ahead in the ever-evolving marketing landscape.
How TapClicks Automates Marketing Analytics and Reporting
TapClicks streamlines the entire marketing analytics lifecycle by automating data collection, integration, and reporting at scale. At the heart of this automation are TapClicks’ robust data connectors—over 10,000 strong—covering virtually every major ad platform, analytics tool, CRM, and business system. These connectors eliminate the headache of logging into multiple platforms or manually downloading spreadsheets. Instead, TapClicks automatically extracts, normalizes, and updates your campaign data in real time, ensuring your dashboards are always current and accurate.
Beyond just data aggregation, TapClicks’ workflow automation tackles repetitive and time-consuming reporting tasks. With customizable templates and drag-and-drop dashboards, users can set up scheduled, fully branded reports that are automatically delivered to clients or stakeholders. This drastically reduces the manual effort spent on monthly or weekly reporting cycles and frees up analysts to focus on uncovering insights rather than wrangling data.
The impact is substantial: TapClicks users routinely report saving 50+ hours per analyst each month—the equivalent of more than a full work week—by letting the platform handle routine data pulls, dashboard updates, and report generation. This level of automation not only accelerates decision-making but also improves reporting accuracy and consistency across teams and clients.
To see a deeper dive into how TapClicks’ analytics automation drives efficiency and accuracy, check out their insights on analytics automation advantages. For organizations looking to eliminate reporting bottlenecks and move at the speed of modern marketing, TapClicks offers a truly unified solution for automated analytics and reporting.
See Your Whole Campaign Story in One View
Managing campaigns across digital, social, search, and even offline channels can feel overwhelming—especially when your data is scattered across multiple platforms. A unified analytics dashboard changes the game, bringing all your campaign performance data into one crystal-clear view.
Why a Unified Dashboard Matters
With all your channels in one place, you can:
- Spot ROI Winners Instantly: See which campaigns are driving the best results, side by side.
- Surface Hidden Synergies: Uncover performance patterns and cross-channel effects you’d miss in siloed tools.
- Identify Underperformers Fast: Quickly flag channels or campaigns that need a creative tweak or budget shift.
- Eliminate Data Chasing: No more toggling between Google Ads, Facebook, email, and print dashboards.
Real-Time Optimization, Not Guesswork
When campaign results are visualized together, your team can:
- Compare Performance Across Platforms: Instantly see how social, search, and email stack up for your latest product launch.
- Reallocate Budgets with Agility: If Facebook is outperforming search, move spend in days—not weeks.
- Adjust Creative On the Fly: Use real-time data to refine messaging or creative assets where they’ll make the most difference.
TapClicks: The Dashboard Built for Marketers
TapClicks makes multi-channel campaign visualization effortless with:
- Customizable Dashboards: Drag-and-drop widgets for the KPIs you care about—channel breakouts, trend lines, or executive overviews.
- Automated Data Updates: Dashboards refresh as new data comes in, so you’re always working with the latest numbers.
- Interactive Reporting: Share live dashboards with clients or team members for greater transparency and collaboration.
- Flexible Templates: Tailor views for different stakeholders, from in-the-weeds analysts to C-suite execs.
Example: Channel Performance Snapshot
| Channel | Impressions | Clicks | Conversions | ROI |
|---|---|---|---|---|
| Social (Paid) | 1,250,000 | 12,000 | 850 | 210% |
| Search (Google) | 950,000 | 8,500 | 610 | 180% |
| 400,000 | 2,200 | 210 | 150% | |
| 120,000 | N/A | 75 | 90% |
Turn Complexity Into Clarity
By visualizing campaign performance across all channels, you transform messy, fragmented data into a story you can act on—fast. The result? More confident decisions, tighter collaboration, and better marketing outcomes.
Want to see how TapClicks can streamline your campaign reporting and unlock deeper insights?
Visit tapclicks.com.
From Data Aggregation to Actionable Marketing Intelligence
The true power of a multi-channel analytics dashboard emerges when raw data is transformed into actionable marketing intelligence. While data aggregation lays the groundwork—bringing together metrics from search, social, email, display, and traditional channels—real value comes from the ability to interpret, contextualize, and act on that information.
Modern dashboards like TapClicks go far beyond static reporting. By leveraging AI-powered insights and automated analytics, these platforms continuously monitor your data for emerging trends, outliers, and optimization opportunities. Instead of sifting through countless spreadsheets or juggling siloed reports, marketers receive clear, prioritized recommendations—such as campaign anomalies, budget pacing alerts, or new growth opportunities—directly within their workflow.
This evolution from data collection to intelligence reporting is a game-changer for marketing teams. Automated marketing insights surface what matters most, enabling users to react in real time, allocate resources more strategically, and confidently report on ROI. Through tools like real-time marketing automation insights, brands and agencies can move from reactive analysis to proactive decision-making, ensuring every campaign is optimized for maximum impact.
Ultimately, a unified analytics dashboard becomes more than a repository for numbers—it’s an always-on intelligence engine, empowering marketers to unlock the full potential of their data and drive better business outcomes. To learn more about transforming your analytics into actionable intelligence, explore TapClicks and see how automation and AI can elevate your marketing operations.
Finding the Right Omnichannel Analytics Solution for Your Team
With so many marketing analytics platforms out there, picking the right one can feel overwhelming. But making the right choice is crucial—it can shape your team’s agility, insight, and ability to compete. Here’s how to focus your search and ensure you choose a solution that delivers real value, both now and as you grow.
What to Look For
🚀 Built to Scale
- Why it matters: If you’re an agency handling hundreds of clients or a brand running campaigns in multiple locations, your platform must scale—fast.
- Key question: Can it manage thousands of dashboards, users, and data sources—without slowdowns?
- TapClicks example: Engineered for high-volume use, ideal for agencies, media companies, and enterprise teams.
🔗 Seamless Integration
- Why it matters: Your dashboard should connect with all your marketing, ad, and business tools—no exceptions.
- What to check:
- Number of native data connectors (the more, the better)
- Custom integration options for niche or proprietary platforms
- TapClicks example: 10,000+ pre-built connectors plus flexible Smart Connectors for custom sources.
🗺️ Multi-Location & Multi-Brand Support
- Why it matters: Modern marketers rarely work from a single playbook.
- Must-have features:
- Granular segmentation
- Roll-up reporting
- Use case: Compare campaigns across brands, locations, or regions and get both detailed and big-picture views.
🎨 Customization & User Control
- Why it matters: Every organization is unique.
- Key features:
- Custom dashboards and reports
- Role-based access control
- White-labeling for agencies
- Benefit: Maintain brand consistency and data security.
🤖 Automation & AI Insights
- Why it matters: Manual number crunching wastes time.
- What to look for:
- Automated report generation
- AI-driven insights and recommendations
- Anomaly detection
- TapClicks highlight: AI-curated insights delivered to stakeholders via SmartEmail and intuitive dashboards.
🤝 Support & Community
- Why it matters: Great onboarding and ongoing help can make or break your success.
- What counts:
- Responsive support
- Rich documentation
- Active user forums or communities
TapClicks vs. the Rest
| Feature | TapClicks | Funnel.io/Adverity/Agency Analytics |
|---|---|---|
| Data Integration | 10,000+ connectors, Smart Connectors | Limited connectors, basic integrations |
| Scalability | Enterprise-grade, multi-client | Suited for smaller teams or point solutions |
| AI & Automation | AI Agents, SmartEmail, predictive insights | Basic automation, limited AI features |
| Customization | Deep dashboard and workflow tailoring | Less flexible, template-based |
| Workflow & Ops | Built-in order management, roles | Reporting only, no workflow |
Quick Reference: Is Your Platform Ready?
- Can it scale with your growing data and client lists?
- Does it integrate with every channel you use?
- Is it built for multi-location, multi-brand operations?
- Are dashboards, reports, and permissions fully customizable?
- Does it offer automated analytics and actionable AI insights?
- Will you get ongoing, enterprise-level support?
Why Unified Analytics Matters
The right omnichannel analytics solution isn’t just a reporting tool—it’s the backbone of your marketing operations. With a unified platform like TapClicks, you’ll spend less time wrestling with data and more time making strategic moves that drive growth.
Curious how TapClicks can streamline your analytics and reporting? Learn more about TapClicks’ omnichannel analytics capabilities.
Equip your marketing team to move faster, make smarter decisions, and stay ahead in a data-driven world.
Unlocking Smarter Decisions with Integrated Marketing Metrics
Ultimately, the true value of a multi-channel analytics dashboard lies in its ability to transform complex, disconnected marketing data into clear, actionable intelligence. By unifying metrics from every campaign, channel, and platform, marketers gain a holistic view that empowers them to make faster, smarter, and more confident decisions. Integrated dashboards break down data silos, revealing not just what’s working—but why, and where to optimize for even greater impact.
With a solution like TapClicks, teams can go beyond surface-level reporting and harness deeper marketing intelligence. Instead of spending hours wrangling spreadsheets or reconciling numbers across platforms, stakeholders have instant access to real-time, reliable insights that drive strategy—from high-level budget allocation to granular channel optimization. This unified approach doesn’t just improve analytics; it accelerates outcomes, fuels collaboration, and unlocks a new standard of marketing performance.
Ready to see how unified reporting can elevate your marketing operations? Explore TapClicks as your all-in-one analytics solution for integrated marketing metrics and intelligence. Book a demo or start a trial today to experience the power of smarter, data-driven decision-making firsthand.
Start Automating Your Marketing Data Today!
No Credit Card Required.

