

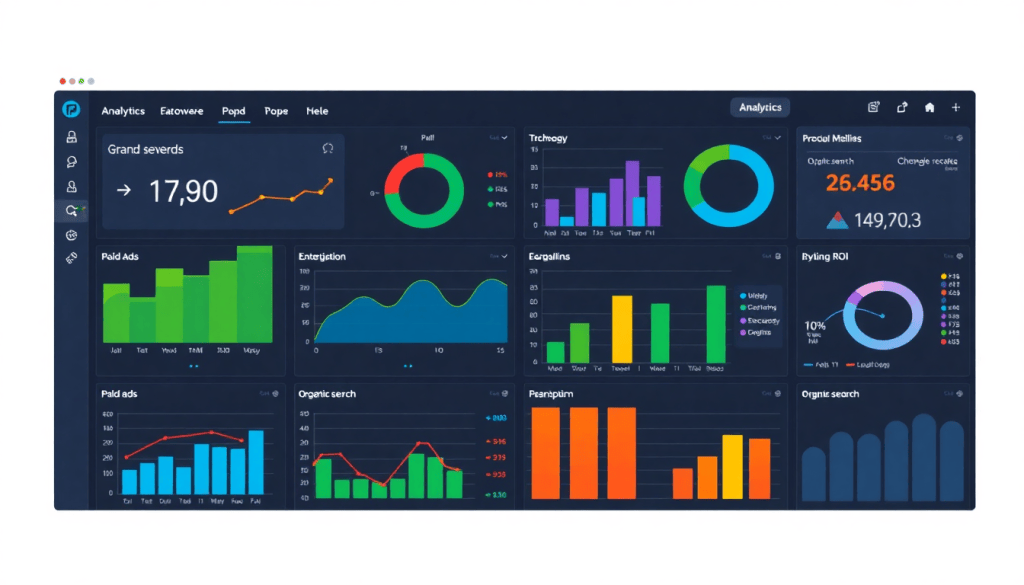
Multi-Channel Analytics Dashboard: Unified Marketing Insights
A multi-channel analytics dashboard brings clarity to complex marketing operations by consolidating data from all your channels—paid, organic, social, email, and more—into one actionable view. With unified metrics, marketers and agencies can easily track campaign performance, visualize ROI, and surface automated insights that drive smarter decisions. This guide explains how integrated dashboards transform fragmented reporting into a seamless, intelligence-driven workflow, and why a platform like TapClicks is purpose-built for high-volume, cross-channel analytics.
What is a Multi-Channel Analytics Dashboard?
A multi-channel analytics dashboard is a centralized platform that aggregates, visualizes, and analyzes marketing data from every channel—such as paid search, social media, organic search, email campaigns, and more—in a single, integrated view. Unlike traditional reporting methods that require marketers to jump between siloed tools or spreadsheets, a multi-channel dashboard unifies all cross-channel analytics and reporting, making it possible to track holistic performance, attribute ROI, and surface actionable insights at scale.
At its core, a multi-channel analytics dashboard includes several essential components:
- Data Connectors: Seamlessly ingest data from a wide range of sources, including ad networks (Google Ads, Facebook Ads), analytics tools (Google Analytics), CRMs, email platforms, and more.
- Data Normalization and Blending: Standardize and combine disparate datasets, enabling apples-to-apples comparisons across campaigns and channels.
- Visualization Tools: Drag-and-drop widgets, customizable charts, and interactive dashboards that make complex data easy to understand.
- Automated Reporting: Schedule recurring reports and alerts for stakeholders, reducing manual effort and ensuring everyone stays informed.
- Performance Analytics: Drill down into KPIs, budget pacing, attribution, and ROI to uncover what’s driving business results.
By unifying cross-channel analytics, these dashboards empower marketing teams to move beyond fragmented reporting and toward a consolidated, intelligence-driven workflow. Marketers can quickly spot trends, optimize spend, and demonstrate value across every touchpoint—all from a single source of truth.
Common Use Cases:
- Agencies: Manage reporting for hundreds of clients, each with unique channel mixes and KPIs, while delivering branded, automated dashboards that save time and improve transparency.
- Brands: Especially multi-location or enterprise brands, consolidate performance data across regional teams, locations, or product lines to optimize marketing spend and track nationwide campaign impact.
- Enterprise Teams: Use as a marketing data hub, feeding unified analytics into business intelligence tools, CRMs, or finance systems for greater cross-functional alignment.
A purpose-built platform like TapClicks is designed to meet these demands at scale, offering thousands of data connectors, advanced data blending, and AI-powered insights—all in one place. By leveraging a multi-channel analytics dashboard, organizations of any size can unlock the clarity and agility needed to thrive in today’s complex marketing landscape.
Key Features: From Data Aggregation to Automated Insights
A powerful multi-channel analytics dashboard is defined by its ability to streamline every aspect of marketing data management, from initial aggregation to delivering actionable insights. Here are the essential features to look for—and why they matter:
1. Marketing Data Aggregation
At the foundation is seamless data aggregation. The right dashboard pulls in metrics from thousands of sources—think Google Ads, Facebook, programmatic platforms, email tools, and CRMs—using robust connectors. This centralizes all your marketing data, eliminating the manual hassle of exporting and merging spreadsheets.
2. Unified Reporting Platform
A unified reporting platform standardizes disparate data points across channels into a single, coherent structure. This enables apples-to-apples comparisons and holistic performance tracking, whether you’re overseeing a single campaign or hundreds of client accounts. TapClicks, for example, makes cross-channel normalization effortless, serving as a reliable source of truth for agencies and brands alike.
3. Performance Tracking Dashboard
Live dashboards visualize KPIs in real-time, providing instant feedback on campaign health. Marketers can monitor spend, impressions, conversions, and custom metrics at a glance, with the ability to drill down by channel, campaign, or client. This visibility is critical for timely optimizations.
4. Campaign Performance Visualization
Effective dashboards turn raw data into clear, engaging visualizations—charts, graphs, heat maps, and trend lines—making it easy to spot patterns, outliers, and growth opportunities. Customizable views ensure each stakeholder (from analysts to executives) sees the insights most relevant to them.
5. ROI Tracking Dashboard
Automated ROI calculations help quantify the impact of every dollar spent. By blending cost, conversion, and revenue data, marketers can pinpoint top-performing channels and campaigns, allocate budgets more strategically, and demonstrate value to clients or leadership.
6. Automation and Real-Time Data Refreshes
Modern dashboards aren’t just static reports—they’re dynamic, with automated data pulls and scheduled updates. This reduces reporting lag and manual workload, allowing teams to focus on strategy instead of data wrangling. For a deeper dive into how automation boosts efficiency, check out Marketing Dashboard Automation: Boost Agency Reporting Efficiency.
7. AI-Driven Insights and Recommendations
The most advanced platforms layer in AI to surface trends, anomalies, and optimization opportunities automatically. Instead of combing through dashboards for insights, users receive proactive recommendations—enabling faster, smarter decision-making.
Collectively, these features transform a multi-channel dashboard from a simple reporting tool into an intelligent marketing operations hub. Platforms like TapClicks are engineered to deliver on all these fronts, empowering teams to scale reporting, unlock deeper insights, and drive better outcomes across every channel.
Why Unified Reporting Changes the Game for Marketers
Unified dashboards don’t just tidy up your reports—they unlock a whole new level of insight, efficiency, and collaboration for marketing teams. Here’s how:
One Dashboard, All Your Data
Say goodbye to:
- Manual spreadsheet merges
- Logging into a dozen siloed platforms
- Hunting for campaign performance metrics
With unified reporting, you get a centralized view aggregating all your marketing data—paid search, social, display, email, and more. This is the foundation of true omnichannel analytics.
What Unified Reporting Makes Possible
1. Everyone on the Same Page
- Executives, account managers, and analysts see the same real-time data.
- No more waiting for custom reports or acting on outdated numbers.
- Shared dashboards = faster alignment and better collaboration.
2. Smarter Client Communication
- Agencies can:
- Show stakeholders live results.
- Visualize budget pacing.
- Quickly address performance concerns with up-to-date insights.
3. Deeper Marketing Intelligence
- Spot trends and cross-channel synergies you’d miss in channel-specific views.
- Instantly identify underperforming tactics.
- Run automated comparisons and roll-ups to optimize spend and strategy.
| Siloed Reporting | Unified Reporting |
|---|---|
| Manual data wrangling | Automated aggregation |
| Channel-by-channel view | Holistic performance view |
| Delayed insights | Real-time visibility |
Save Time, Reduce Errors
- Automated data collection and scheduled reports can save analysts dozens of hours every month.
- Less manual work = fewer errors and more time for high-impact analysis.
The Real-World Impact
- Faster, more accurate decisions
- Increased marketing agility
- A true competitive edge in today’s data-driven landscape
Want to see it in action?
Discover how TapClicks delivers unified, scalable analytics for modern marketing teams at TapClicks.com.
Visualizing Campaign Performance and ROI
A hallmark of a robust multi-channel analytics dashboard is its ability to transform a sea of marketing data into clear, compelling visualizations that track campaign performance and ROI at-a-glance. By bringing together performance metrics from paid, organic, social, email, and other marketing channels, these dashboards empower teams to quickly spot trends, identify what’s working, and make data-driven decisions—all without toggling between disparate systems.
Dashboards like TapClicks offer rich, customizable views tailored to the needs of different stakeholders. Executives can access high-level summaries and ROI heatmaps to guide strategic decisions, while analysts can drill down into granular, channel-specific KPIs and conversion paths. For agencies, client-facing dashboards deliver transparency and value, showcasing campaign impact and spend efficiency in real time.
Customizability is key: with drag-and-drop widgets, filterable date ranges, and the ability to pivot views by region, product, or audience segment, each user sees the data most relevant to their goals. This flexibility not only accelerates insights but also fosters collaboration, as marketers and clients can align around shared visual benchmarks and goals.
The real payoff comes in the form of actionable clarity. Instead of piecing together spreadsheets and static reports, teams can instantly visualize campaign lift, ROI trends, and budget pacing—enabling faster optimization and stronger outcomes. For a deeper look at how dashboard automation fuels more effective analytics reporting, see "Marketing Dashboard Automation: Boost Analytics Reporting", which features real-world examples of dashboards delivering transformative campaign insights.
Integrating Data Sources for Complete Marketing Intelligence
Marketing teams today rely on a diverse tech stack—ad networks, social platforms, CRM systems, analytics tools, and more—to reach audiences and track results. The true challenge is not just collecting data from these myriad platforms, but transforming it into coherent, actionable intelligence. That’s where integrating data sources into a unified reporting platform becomes mission-critical.
Methods for Marketing Data Aggregation
To achieve holistic visibility, modern dashboards leverage several methods for aggregating marketing data:
- Direct API Integrations: Connecting directly to platforms such as Google Ads, Meta, LinkedIn, Mailchimp, and Salesforce, dashboards can automatically pull in performance data at scheduled intervals.
- Smart Connectors and ETL/ELT Pipelines: Advanced solutions support custom connectors and automated extract, transform, load (ETL/ELT) processes, allowing teams to blend, normalize, and clean data from both standard and niche sources.
- Manual Upload and File Import: For platforms lacking robust APIs, dashboards may accept CSV, Excel, or other file formats, ensuring no dataset is left behind.
- Third-Party Middleware: Integration tools like Zapier or proprietary middleware can further bridge gaps, syncing data between disparate systems.
These aggregation techniques ensure that whether your data lives in an ad manager, a cloud drive, or an in-house analytics tool, it can be centralized for unified analysis.
Unified Reporting for Integrated Marketing Metrics
A unified reporting platform consolidates these diverse inputs into a single source of truth. By automatically mapping and harmonizing data fields—such as campaign names, spend, conversions, and audiences—marketers gain access to integrated metrics that transcend channel silos. This holistic view empowers teams to:
- Track cross-channel performance side-by-side for true omnichannel analytics.
- Identify trends and correlations that would be invisible within isolated reports.
- Surface actionable insights that drive budget allocation, creative optimization, and strategic planning.
Perhaps most importantly, unified reporting enables automated, role-based dashboards, so every stakeholder—from executives to analysts to clients—gets the right view of performance without manual data wrangling.
TapClicks: Robust Omnichannel Analytics at Scale
When it comes to integrating data sources at scale, the TapClicks analytics dashboard stands out as a purpose-built solution. With 10,000+ marketing, advertising, and business data connectors—plus enrichment tools for blending datasets—TapClicks empowers agencies, brands, and enterprise teams to:
- Combine all marketing data streams into one intuitive interface
- Automate data refreshes and normalization for always-current insights
- Seamlessly support multi-client, multi-location, and multi-channel reporting needs
By eliminating the friction and fragmentation of manual data aggregation, TapClicks delivers a complete, intelligence-driven foundation for marketing success.
Automated Marketing Insights and Intelligence
Today’s marketers are inundated with massive volumes of campaign data—far more than any human team can manually analyze in real time. This is where AI-powered dashboards fundamentally change the game. By leveraging artificial intelligence and machine learning, modern multi-channel analytics dashboards like TapClicks do more than just visualize data—they automatically surface the insights that matter, when they matter most.
AI-driven dashboards scan your unified marketing data for patterns, trends, and anomalies, delivering automated marketing insights directly to your team or clients. For instance, predictive models can forecast campaign performance, budget pacing, or audience engagement, helping marketers proactively optimize tactics before issues arise. Advanced anomaly detection flags sudden drops or spikes in metrics, alerting you to both problems and emerging opportunities across any connected channel.
Benchmarks and comparative analytics are another critical capability. AI can instantly compare your results to historical data, industry standards, or cross-channel averages, making it easy to identify where campaigns are over- or under-performing. This level of intelligence not only accelerates decision-making but also brings a new layer of transparency and accountability to reporting.
The real power of automation lies in delivering these insights in real time. As highlighted in "Unlocking Real-Time Marketing: The Power of Automated Data Collection for Brand Marketers", automated data collection and analysis enable brands to react instantly to market shifts, optimize ad spend on the fly, and continuously refine messaging for maximum impact.
With TapClicks AI agents, you can automate the delivery of curated insight summaries, set up instant alerts for key performance shifts, and access recommended optimizations—all without lifting a finger. This not only reduces manual analysis but also empowers marketing teams to act faster, allocate resources more effectively, and drive better outcomes for clients and stakeholders.
By integrating AI-powered insights and intelligence, a unified analytics dashboard becomes far more than a reporting tool—it transforms into a strategic partner that accelerates marketing success at scale. Learn more about how TapClicks brings these capabilities to life at TapClicks.com.
How to Pick a Multi-Platform Reporting Solution That Actually Scales
Choosing a reporting dashboard isn’t just a box to check—it's a long-term investment in your team's productivity, visibility, and client satisfaction. Here’s what really matters when comparing platforms, and why TapClicks is the go-to for agencies and brands that need more than just pretty charts.
What to Look For (And Why It Matters)
📈 Scalability and Performance
You want a dashboard that grows with you. Ask:
- Can it handle hundreds (or thousands) of campaigns, clients, and locations?
- Does it support frequent data refreshes for real-time insights?
- Is it built to scale as your marketing operation expands?
🔗 Seamless Data Integration
Your platform should connect everywhere you work.
- Look for 10,000+ native connectors—not just the basics.
- Check for automated ETL/ELT pipelines: extract, transform, and load data with minimal IT help.
- Prioritize solutions that normalize and blend data cross-channel, multi-location, and multi-client.
🤖 Automation and AI-Driven Insights
Let the platform do the heavy lifting.
- Automated report generation and delivery (internal & client-facing)
- AI agents for surfacing key insights, performance alerts, and optimization tips
- Integration with email or workflow tools for automatic insight delivery
Want to see how automation can change your workflow? Read: Marketing Dashboard Automation: Boost Agency Reporting Efficiency
🎨 Customization and User Experience
Reporting should fit your unique needs—not the other way around.
- Custom dashboards, templates, and branded exports
- Role-based access for execs, analysts, and clients
- Easy drag-and-drop setup (no steep learning curve)
🤝 Support and Flexibility
You’re not just buying software—you’re partnering for success.
- Responsive onboarding and ongoing customer support
- Ability to export clean data into BI tools (Tableau, Power BI, etc.)
- Regular platform updates, new connectors, and AI features
How the Leading Platforms Stack Up
| Platform | Strengths | Limitations |
|---|---|---|
| Funnel.io, Supermetrics | Data aggregation, simple setup | Lacks robust reporting & workflow |
| Agency Analytics, NinjaCat | Lightweight dashboards, easy for small teams | Not built for scale or deep automation |
| Salesforce Datorama, Adverity | Enterprise-grade analytics, flexible APIs | Complex, resource-intensive |
| TapClicks | Unified scale, deep automation, AI insights | Purpose-built for marketing ops at scale |
Why TapClicks?
- Consolidates 10,000+ data sources
- Automates reporting for hundreds of clients
- Surfaces actionable AI intelligence (not just charts)
- Offers role-based access, white-labeling, and seamless export options
See what sets TapClicks apart →
Ready to Measure Real ROI? Here’s a Quick Evaluation Plan
- Kick off a pilot: Integrate your own data and test automation/reporting firsthand.
- Track time savings: Calculate hours saved by eliminating manual reporting.
- Stress-test scalability: Simulate growth—can the platform keep up?
- Review adaptability: Is the platform evolving with new features, connectors, and AI?
The right platform isn’t just solving today’s challenges—it’s setting you up for long-term marketing intelligence, automation, and growth. TapClicks brings it all together for agencies and brands who want to scale smarter, not harder.
Getting Started: Best Practices for Implementation
Rolling out a multi-channel analytics dashboard is a transformative step toward streamlined marketing operations and smarter decision-making. To maximize the impact of your unified dashboard, here’s a step-by-step guide to implementation—along with proven best practices that drive adoption and ongoing success.
1. Map Your Data Sources and Metrics
Begin by identifying all the marketing platforms, ad networks, CRMs, and analytics tools you use. Create a comprehensive list of data sources and define the key metrics you want to track across channels—such as impressions, clicks, conversions, spend, and ROI. This foundation ensures your dashboard delivers relevant, unified insights.
2. Centralize Data Integration
Leverage robust data connectors to aggregate information from each platform into your dashboard. Solutions like TapClicks offer thousands of prebuilt data integrations and customizable connectors, eliminating manual data pulls and ensuring your dashboards are always up-to-date. Prioritize platforms that support automated ETL/ELT workflows and accommodate complex data normalization needs.
3. Design with Stakeholders in Mind
Craft dashboard layouts tailored to your users—executives, marketing teams, analysts, and clients. Use intuitive visualizations, customizable filters, and role-based access controls to deliver the right level of detail to each audience. Consider starting with template dashboards and iterating based on stakeholder feedback.
4. Set Up Automated Reporting and Alerts
Activate automated report scheduling and real-time alerts to keep teams informed without manual intervention. This not only saves time but also ensures that insights and anomalies are surfaced to the right people, at the right time. Explore options for automated insight delivery, such as AI-driven email summaries or in-dashboard notifications.
5. Train Your Team and Drive Adoption
Comprehensive onboarding is crucial—host training sessions, create resource guides, and encourage hands-on exploration. Make sure users understand the dashboard’s capabilities and how to interpret metrics. Foster a culture of data-driven decision-making by demonstrating how unified analytics directly impact campaign performance.
6. Iterate and Optimize Continuously
Monitor usage, solicit feedback, and adapt dashboards to evolving business needs. Regularly review data quality, visualization effectiveness, and reporting workflows. Continuous optimization is key to maintaining dashboard relevance and maximizing long-term value.
Key Takeaways and Next Steps
Implementing a multi-channel analytics dashboard is not a one-time project, but an ongoing process that evolves alongside your marketing strategy. By methodically mapping data, prioritizing automation, investing in stakeholder training, and embracing continuous improvement, agencies and marketing teams can break down data silos and unlock actionable intelligence. Ready to unify your reporting? Start with a platform designed for scale and flexibility, and empower your organization to make smarter, faster marketing decisions.
Start Automating Your Marketing Data Today!
No Credit Card Required.

