

Multi-Channel Analytics Dashboard: Unified Marketing Insights
A multi-channel analytics dashboard empowers marketing teams to understand, optimize, and communicate performance across every touchpoint—social, search, email, display, and beyond—all from a single source of truth. By aggregating data from disparate platforms, these dashboards eliminate silos and guesswork, making it possible to compare results, spot trends, and act on insights faster than ever. With tools like the TapClicks analytics dashboard, organizations can automate reporting, visualize campaign performance, and confidently track ROI, streamlining marketing intelligence for better decisions and outcomes.
What is a Multi-Channel Analytics Dashboard?
A multi-channel analytics dashboard is a centralized platform that consolidates data from all your marketing channels—think social media, paid search, programmatic ads, email, and more—into a single, cohesive view. Its core function in marketing operations is to seamlessly unify fragmented data streams, transforming disconnected metrics into actionable insights that drive smarter strategy and execution.
Rather than toggling between individual dashboards for Facebook Ads, Google Analytics, Mailchimp, and dozens of other tools, a multi-channel analytics dashboard aggregates these disparate sources. This unified approach allows marketers to monitor performance holistically, compare cross-channel results side-by-side, and spot emerging trends that would otherwise go unnoticed in siloed reports.
Cross-channel marketing analytics is critical in today’s complex digital landscape. Brands and agencies need to understand not just how each channel performs in isolation, but how channels interact and influence each other throughout the customer journey. Integrated marketing metrics—such as total reach, cost per acquisition, or blended ROAS—enable more accurate attribution and campaign optimization, leading to better outcomes and higher ROI.
Efficiency is another cornerstone of these dashboards. As highlighted in "marketing dashboard automation", automating data collection and reporting reduces manual effort, eliminates errors, and speeds up the delivery of insights to stakeholders. This streamlined approach empowers marketing teams to focus on strategic analysis and decision-making, rather than getting bogged down in data wrangling.
In essence, a multi-channel analytics dashboard is the nerve center of modern marketing operations—a single source of truth that brings clarity, consistency, and agility to the ever-evolving world of digital marketing.
Key Features of a Unified Reporting Platform
A unified reporting platform serves as the backbone of modern marketing analytics, bringing together diverse data sources and transforming them into actionable insights. Here are the essential features that set these platforms apart:
1. Data Aggregation Across Channels
At the heart of any effective multi-channel analytics solution is robust data aggregation. Unified reporting platforms seamlessly collect and consolidate data from a vast array of marketing channels—search, social, email, programmatic, and more. This eliminates data silos, ensuring that teams always have a holistic view of campaign performance.
2. Campaign Performance Visualization
Intuitive dashboards and visualization tools allow marketers to easily interpret complex datasets. With customizable widgets, graphs, and scorecards, teams can track KPIs, monitor spend, and compare results across platforms—all in real time. This empowers users to spot trends and anomalies at a glance, fueling faster and more informed decisions.
3. Automated Marketing Insights
Modern platforms go beyond static reporting by providing automated, AI-driven insights. Features like predictive analytics and anomaly detection surface optimization opportunities, budget pacing alerts, and performance benchmarks without manual analysis. This level of intelligence is critical for proactive campaign management and continuous improvement.
4. Real-Time Updates and Scheduled Reporting
Unified dashboards deliver real-time data refreshes, so marketers are always working with the latest information. Automated, scheduled reports keep stakeholders in the loop, reducing the manual burden on analysts and ensuring timely communication of results.
5. Customizable and White-Labeled Reporting
Every organization has unique reporting needs. Unified platforms offer flexible customization—users can tailor dashboards, choose branding options, and set up white-labeled reports for clients or internal teams. This level of personalization enhances professionalism and strengthens client relationships.
6. Role-Based Access and Enterprise-Grade Scalability
Security and scalability are non-negotiable for agencies and enterprise teams. Role-based access ensures the right people see the right data, supporting collaboration while protecting sensitive information. Leading platforms are built to manage thousands of dashboards, clients, and reports simultaneously, making them ideal for high-volume use cases.
To explore these features in greater detail, refer to this piece on "marketing dashboard automation for analytics", which highlights how automation and integration capabilities drive analytics efficiency.
Unified reporting platforms like TapClicks embody these core features, enabling organizations to centralize marketing intelligence, scale operations, and deliver impactful insights with ease.
The Benefits of Cross-Channel Marketing Analytics
In today’s fragmented digital landscape, cross-channel marketing analytics are essential for brands and agencies aiming to maximize campaign effectiveness and efficiently allocate budgets. By consolidating data from every channel—social media, search engines, programmatic ads, email, and beyond—omnichannel analytics solutions provide a holistic view of marketing performance that simply isn’t possible with siloed tools.
Optimize Campaigns and ROI with Unified Insights
A unified dashboard lets marketers move beyond vanity metrics, drilling into cross-channel comparisons and attribution models that reveal what’s actually driving conversions. With all campaign data side-by-side, teams can quickly identify top-performing channels, optimize underperformers, and shift spend in real time to maximize return on investment. This comprehensive approach to ROI tracking means every marketing dollar is measured and justified.
Accelerate Decision-Making with Real-Time Intelligence
Speed is a competitive advantage. Cross-channel dashboards deliver up-to-the-minute results, empowering teams to make data-driven decisions without waiting for manual reports or disparate platform logins. When insights are centralized and accessible, marketing leaders can respond to trends as they emerge, capitalizing on new opportunities or correcting course before small issues become costly problems. This is especially powerful when paired with real-time marketing and automated data collection, which ensures the freshest data is always at your fingertips.
Reduce Manual Work and Reporting Errors
A unified analytics dashboard doesn’t just save time—it significantly reduces the risk of human error. Instead of exporting spreadsheets from multiple platforms and painstakingly stitching them together, marketers rely on automated data aggregation and standardized reporting. This not only slashes hours of manual labor each week, but also ensures greater data integrity and accuracy, leading to more trustworthy insights.
Enhance Marketing Intelligence and Collaboration
Finally, cross-channel analytics foster a culture of transparency and collaboration. With a single source of truth, all stakeholders—from executives to account managers—see the same metrics and trends. This unified view streamlines communication, supports smarter marketing intelligence reporting, and allows teams to rally around shared goals and KPIs.
In short, embracing cross-channel analytics is a strategic advantage, enabling marketers to optimize campaigns, make faster decisions, and eliminate the manual headaches of fragmented reporting. The result: better outcomes, clearer ROI, and a stronger competitive edge.
How TapClicks Powers Multi-Platform Reporting
The TapClicks analytics dashboard stands out as a true command center for multi-platform marketing reporting. At its core, TapClicks unifies all aspects of marketing data—bringing together solutions like TapData (for data integration and enrichment), TapAnalytics (for deep analysis), and TapReports (for custom dashboards and automated reporting). This ecosystem is designed to serve the needs of agencies, brands, and enterprise teams managing high volumes of marketing activity and complex data requirements.
A major differentiator is TapClicks’ unparalleled connectivity, boasting over 10,000 marketing, advertising, and business data connectors. These connectors feed data into an advanced automated ETL/ELT pipeline, streamlining the process of extracting, transforming, and loading data from virtually any platform—be it social, search, programmatic, email, or beyond. This means marketers can consolidate insights from Google Ads, Facebook, TikTok, programmatic DSPs, email platforms, and even offline channels, all into a single, normalized view.
TapClicks is built for scale and flexibility. Whether you're an agency juggling hundreds of client accounts or a multi-location brand with diverse campaigns, the platform can handle thousands of dashboards and reports simultaneously. Its role-based access controls and white-labeling options ensure that every stakeholder—internal teams or clients—sees only what’s relevant to them, all under your brand’s look and feel.
Where TapClicks truly excels is in its AI-driven insights. With features like TapInsights and SmartPilot, the platform goes beyond static dashboards, proactively analyzing data to surface actionable recommendations, performance anomalies, and optimization opportunities. Automated, scheduled reports and AI-curated SmartEmails keep teams and clients in-the-know without the manual reporting grind, ensuring decisions are always data-driven and timely.
Use cases abound: agencies leverage TapClicks to automate client reporting and streamline campaign management; brands gain a holistic, cross-channel view to optimize spend and performance; enterprise teams use TapClicks as a unified data hub that seamlessly integrates with existing BI tools and workflows. The result is a marketing operations platform that doesn’t just collect data—it transforms it into strategic action, empowering teams to drive better outcomes at every level.
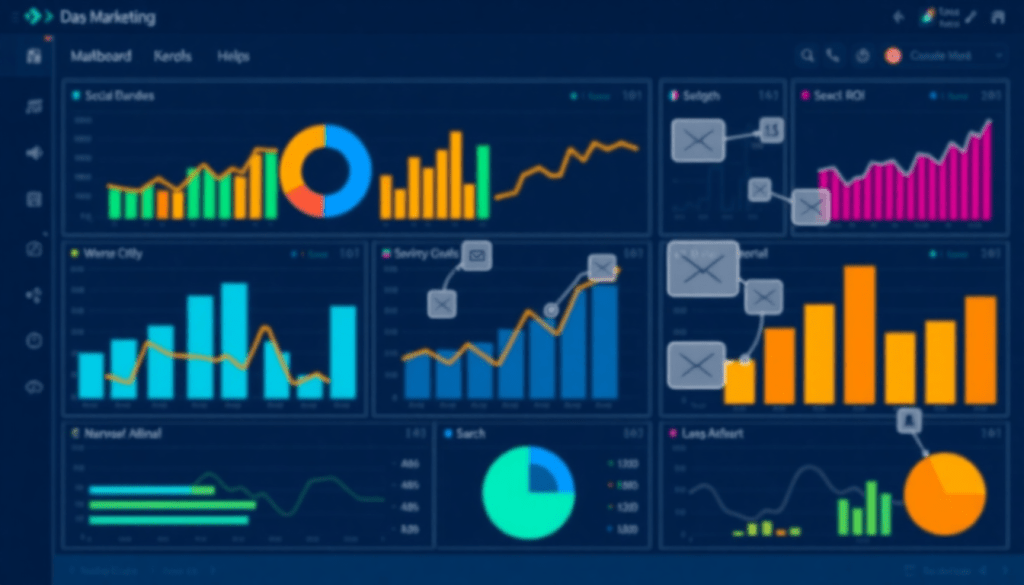
Bringing Campaign Performance to Life with Powerful Visuals
When it comes to marketing analytics, seeing is believing. A well-designed, multi-channel dashboard not only consolidates campaign data but transforms it into a story everyone can understand—whether you’re an executive, an account manager, or a creative lead.
Why Unified Dashboards Matter
A single source of truth is essential for fast, confident decisions. With an analytics dashboard like TapClicks, you can:
- Aggregate data from every channel: search, social, display, email, and more
- Replace siloed spreadsheets with interactive graphs, custom scorecards, and tables
- Empower every team member—from high-level leaders needing quick overviews to analysts diving into granular details
Building Dashboards That Work for You
Customization is the secret sauce. Here’s how flexible dashboards can be tailored to fit unique needs:
| Visualization Type | Example Use Case | Value Delivered |
|---|---|---|
| Bar Charts | Compare lead volume from Google Ads vs. Facebook | Instantly spot channel leaders |
| Time-Series Graphs | Monitor spend vs. conversions over a quarter | Track trends and seasonality |
| Scorecards | Highlight top and bottom campaign performers | Surface wins and areas for improvement |
| Tables | Review granular metrics by campaign or channel | Enable detailed analysis |
Proving and Optimizing ROI
ROI tracking dashboards are a marketer’s best friend. By unifying cost, conversion, and revenue data in one place, you can quickly answer:
- What’s our true return on ad spend (ROAS)?
- Which campaigns deliver the lowest cost per acquisition (CPA)?
- Where should we shift budget for maximum impact?
With TapClicks, these insights are just a click away—no manual spreadsheets or endless data wrangling required.
Tips for Maximum Impact
Keep these strategies in mind to make your dashboards truly actionable:
- Lead with clarity: Use consistent colors, intuitive layouts, and clear labels to help users focus on what matters.
- Encourage exploration: Enable drill-downs so teams can dig deeper into the data behind each metric.
- Automate everything: Set up real-time or scheduled data refreshes to keep your dashboards current.
- Match the message to the audience: Tailor each view for executives, clients, or specialists—highlighting relevant KPIs for each.
By following these principles, you’ll transform scattered campaign stats into compelling visuals that drive smarter, faster marketing decisions. Ready to see it in action? Explore the TapClicks analytics dashboard to experience seamless campaign and ROI visualization for yourself.
Automated Marketing Insights and Intelligence
Marketing teams today face a flood of data—making it hard to see what actually matters. TapClicks cuts through the noise by embedding AI-powered intelligence at every level, so you get insights that drive real results, not just more dashboards.
Turning Data Into Decisions: How TapClicks AI Makes It Easy
With TapClicks’ AI-driven features, you get:
-
TapInsights:
- Scans your dashboards and datasets 24/7
- Surfaces trends, anomalies, and new opportunities
- Delivers clear, actionable recommendations (e.g., which channels are outperforming, where to optimize spend, which campaigns need immediate attention)
-
SmartPilot:
- Goes beyond “what happened” to “what’s next”
- Predicts campaign outcomes with benchmarking and pacing analysis
- Suggests optimization strategies and budget reallocations in real time
Get Insights Delivered—Automatically
No more endless spreadsheet reviews!
With TapClicks:
- SmartEmail delivers:
- Plain-language, AI-written summaries of campaign performance
- Automated email delivery to clients or internal teams
- Stakeholders always have the latest updates—no manual reporting required
Why Marketers Love TapClicks Intelligence
| Challenge | TapClicks Solution |
|---|---|
| Too much data, not enough time | Automated insights and recommendations |
| Manual, error-prone reporting | Automated, scheduled, and AI-curated reporting |
| Difficulty benchmarking at scale | Cross-client, multi-campaign performance benchmarks |
| Missed optimization windows | Real-time alerts and proactive optimization suggestions |
Focus on Strategy, Not Reporting
Here’s what you can expect with TapClicks AI:
- Less time crunching numbers
- More time acting on insights that matter
- Faster, smarter optimization across all campaigns
- A marketing team that’s always ahead of the curve
Bottom Line:
With TapClicks, automated marketing intelligence isn’t just convenient—it’s the new competitive edge. Let AI handle the data, while your team focuses on strategy, creativity, and growth.
How to Choose the Best Omnichannel Analytics Solution for Your Team
Selecting a unified reporting platform isn’t just about checking boxes—it’s about empowering your marketing operations, maximizing ROI, and staying agile in a fast-moving landscape. Here’s how you can make a thoughtful, future-proof decision for your organization.
What to Look for in a Modern Reporting Platform
1. Data Integration That Matches Your Stack
- Comprehensive Connectivity: Does the platform support all your major channels (social, search, email, programmatic, direct buys)?
- Custom Data Sources: Can you bring in proprietary or niche data easily?
- Automated ETL/ELT: Are data transformation and normalization streamlined—or will you spend hours wrangling spreadsheets?
- Connector Quality & Quantity: More isn’t always better; look for reliability and ongoing updates.
2. Built for Scale—Not Just Startups
- Handles Growth: Will it keep up as your campaigns, dashboards, and number of clients or locations multiply?
- No Bottlenecks: Can it support hundreds (or thousands) of users, dashboards, or reports simultaneously?
- Ideal For: Agencies, media companies, and multi-location brands with high-volume needs.
3. Automation and Seamless Workflows
- Automated Data Pulls: Say goodbye to manual exports and uploads.
- Report Generation: Create and schedule reports in bulk—no more repetitive busywork.
- Integrated Order & Workflow Management: Centralize campaign orders, assign roles, and collaborate with fulfillment teams without leaving the platform.
- Role-Based Access: Give clients and internal teams the right level of visibility and control.
4. Actionable Intelligence—Not Just Pretty Charts
- AI-Driven Insights: Does the system surface trends, anomalies, or optimization opportunities automatically?
- Predictive Analytics: Can you forecast budget pacing or campaign performance?
- Smart Recommendations: Move beyond reporting to get real, strategic guidance—like TapClicks’ AI agents and SmartEmail summaries.
5. Customization and Branding That Reflects You
- Branded Dashboards: Make every client touchpoint feel like your own.
- Client-Specific Metrics: Tailor the experience so each stakeholder sees what matters most.
- Flexible Visualizations: Adapt charts, tables, and exports for maximum clarity and impact.
Comparing Your Options: TapClicks vs. Other Platforms
| Feature | TapClicks | Funnel.io / Supermetrics | Agency Analytics | Datorama (Salesforce) | Adverity |
|---|---|---|---|---|---|
| Data Connectors | 10,000+ | 500-1,000+ | 70+ | 100+ | 600+ |
| Workflow Integration | Centralized, robust | Limited | Basic | Moderate | Moderate |
| Automation | End-to-end | Data only | Basic | Strong | Strong |
| AI Insights | Advanced, proactive | Minimal | None | Moderate | Moderate |
| Scalability | Enterprise-grade | Varies | SMB-focused | Enterprise | Enterprise |
| Customization | Deep, white-label | Moderate | Good | Good | Good |
Why TapClicks Stands Out
- Handles Scale: Supports thousands of dashboards, clients, and locations with ease.
- True Automation: Automates everything from ETL to report scheduling and insight delivery—saving teams 50+ hours/month per analyst.
- AI-Powered: Proactively delivers insights, optimization tips, and predictive analytics.
- Unified Workflow: Centralizes campaign management, order tracking, and collaboration.
Takeaway: Move Beyond Fragmented Reporting
Choosing the right omnichannel analytics platform comes down to three things:
- Comprehensive connectivity—so you never miss a data point.
- Operational efficiency—to free up your team for higher-value work.
- Strategic intelligence—so every campaign improves on the last.
With TapClicks, you move from scattered data and manual processes to unified, insight-driven marketing operations that drive real business outcomes.
Getting Started with TapClicks Analytics Dashboard
Onboarding with the TapClicks analytics dashboard is designed to be intuitive, scalable, and fast—whether you’re an agency managing dozens of client brands, a multi-location enterprise, or a data-driven marketing team. Here’s how to make a smooth start and unlock the full potential of unified marketing analytics:
1. Connect Your Data Sources
TapClicks offers over 10,000 pre-built marketing data connectors, allowing you to seamlessly integrate social, search, email, programmatic, and business platforms with just a few clicks. Begin by selecting your key platforms—Google Ads, Facebook, LinkedIn, HubSpot, and more—using TapClicks’ straightforward connector wizard. For unique or proprietary data, leverage Smart Connectors to import custom datasets, ensuring every source is captured for comprehensive analysis.
2. Build and Customize Your Dashboards
Once your data is flowing into TapClicks, you can configure dashboards tailored to your goals. Use drag-and-drop widgets, scorecards, graphs, and tables to visualize campaign metrics, performance trends, and ROI across channels. White-labeling and role-based access controls make it easy to deliver branded, permissioned dashboards to clients or internal stakeholders. For best practices in dashboard setup, explore "marketing dashboard automation for analytics".
3. Automate Reporting and Insights
Schedule automated reports for your team or clients, eliminating manual work and reducing errors. TapClicks’ AI-powered features—like SmartPilot and TapInsights—deliver proactive recommendations and benchmarking, helping you optimize spend and campaign performance. For tips on boosting efficiency, see "marketing dashboard automation".
4. Manage Users and Permissions
Invite users with tailored access based on their role—whether they’re analysts, account managers, or clients. TapClicks’ role-based permissions ensure data security and relevant visibility, supporting collaboration across marketing, sales, and operations teams.
5. Leverage Support and Advanced Features
TapClicks offers robust onboarding resources, including step-by-step guides, webinars, and a responsive support team. As your needs evolve, explore advanced capabilities like predictive models, SmartEmail for automated insight delivery, and workflow automation through TapOrders and TapWorkflow.
Ready to elevate your marketing intelligence and streamline reporting? Visit TapClicks to request a demo, or dive into the "real-time marketing and automated data collection" guide for more inspiration. With TapClicks, unified analytics and actionable insights are just a few steps away.
Start Automating Your Marketing Data Today!
No Credit Card Required.

