

Multi-Channel Analytics Dashboard: Unified Marketing Insights
A multi-channel analytics dashboard empowers marketing teams to see the big picture—pulling data from every platform and channel into a single, unified reporting environment. With TapClicks, marketing leaders can track ROI, visualize campaign performance, and uncover automated insights at scale. This guide explores the core benefits, features, and best practices for implementing a multi-channel analytics dashboard, highlighting how TapClicks delivers integrated marketing intelligence and operational efficiency.
What is a Multi-Channel Analytics Dashboard?
A multi-channel analytics dashboard is a centralized platform that aggregates, visualizes, and analyzes marketing data from all your digital channels—think search, social, display, email, video, and beyond—into one cohesive reporting environment. Unlike single-channel dashboards or basic reporting tools that only surface metrics from a single platform (such as just Facebook Ads or Google Analytics), a multi-channel dashboard provides a panoramic view of your entire marketing ecosystem. This unified perspective is essential in today’s complex marketing landscape, where campaigns often span multiple networks, devices, and audience segments.
At its core, a multi-channel analytics dashboard empowers marketing teams to practice cross-channel marketing analytics—the process of comparing and correlating performance metrics across platforms to assess true campaign effectiveness, optimize channel mix, and demonstrate ROI. Rather than toggling between siloed reports or manually stitching together spreadsheets, marketers can leverage a unified reporting platform to monitor KPIs, track budget pacing, and uncover trends in real time.
Integrated marketing metrics are foundational to this approach. With a multi-channel dashboard, you’re not just collecting data; you’re blending and normalizing it so that performance can be compared apples-to-apples across channels. For example, impressions, clicks, conversions, and cost-per-acquisition from Google, Meta, TikTok, and programmatic campaigns can all be visualized side-by-side. This enables deeper insights into which channels drive the most value, where to allocate budget, and how to optimize for maximum impact.
With advanced platforms like TapClicks, marketing leaders gain a true “mission control” for their operations—where data flows automatically from over 10,000 sources, and AI-powered insights help teams move from reporting to action at scale. In summary, a multi-channel analytics dashboard is no longer a “nice to have”—it’s the backbone of modern, integrated marketing strategy and execution.
Core Benefits of a Unified Reporting Platform
Aggregating marketing data from every channel into a single analytics dashboard unlocks a host of transformative advantages for organizations of all sizes. At its core, a unified reporting platform like TapClicks eliminates the chaos of multiple spreadsheets, logins, and disconnected reports—replacing them with a streamlined, real-time view of marketing performance across every touchpoint.
Time Savings and Error Reduction: Manual data collection and reporting are time-consuming and prone to human error. Automating these processes not only slashes hours from analysts’ workloads—often saving 50+ hours per month per analyst—but also ensures greater accuracy and consistency. This means marketing teams can trust their numbers and spend more time on strategic analysis rather than data wrangling.
Enhanced Visibility and Decision-Making: By consolidating data from paid search, social, display, SEO, and more, marketers gain a holistic view of campaign performance. This makes it easier to spot trends, compare channels, and uncover opportunities for optimization that would otherwise be hidden in siloed systems. Cross-channel analytics empower teams to evaluate true ROI and quickly pivot strategies based on comprehensive insights.
Benefits for Agencies, Brands, and Enterprise Teams:
- Agencies can impress clients with branded, automated reports and dashboards that scale effortlessly across hundreds of accounts, boosting both efficiency and client satisfaction.
- Brands—especially those with multiple locations or business units—can unify data to monitor performance at both macro and micro levels, facilitating smarter budget allocation and campaign management.
- Enterprise teams benefit from a marketing data hub that feeds clean, normalized insights into business intelligence (BI) tools, CRMs, or finance systems, ensuring alignment across the organization.
For a deeper dive into how unified dashboards streamline reporting and drive efficiency for agencies, check out "Boost Agency Reporting Efficiency".
Ultimately, a unified reporting platform like TapClicks delivers not just operational efficiency, but also the strategic agility needed to thrive in today’s fast-paced, multi-channel marketing landscape.
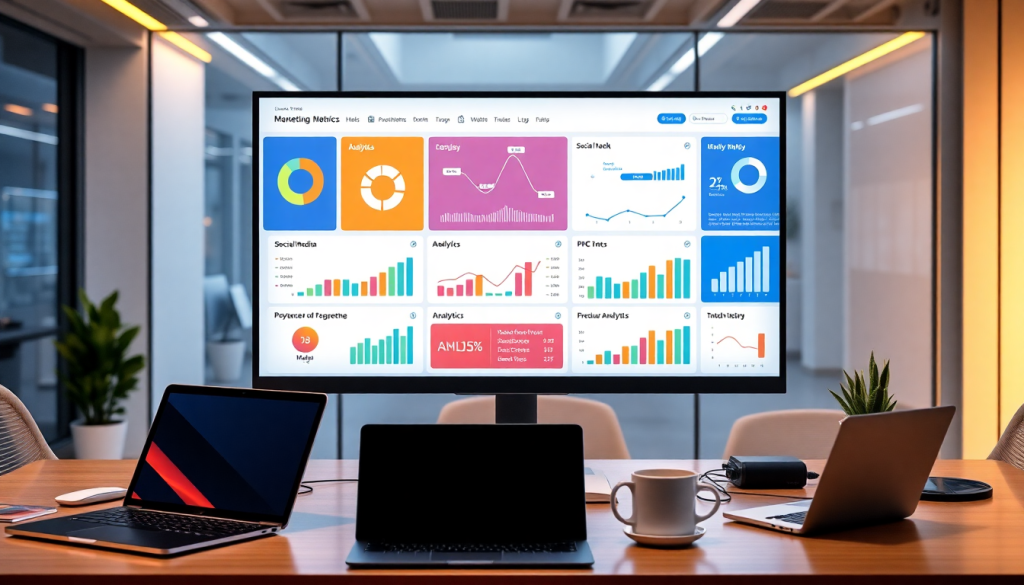
Key Features of the TapClicks Analytics Dashboard
The TapClicks analytics dashboard stands out as a comprehensive solution for marketing teams seeking to unify, visualize, and act on data across every channel. Here’s what sets it apart:
Performance Tracking Dashboard
At the core of TapClicks is a powerful performance tracking dashboard that brings together campaign data from search, social, display, email, and offline channels. With a drag-and-drop interface, marketers can build custom views to monitor KPIs, track conversions, and compare cross-channel performance—all in real time. Robust filtering and segmentation options make it easy to isolate results by client, location, campaign, or timeframe.
ROI Tracking & Campaign Visualization
TapClicks makes ROI tracking effortless by aggregating cost, spend, and revenue data from every source. Marketers can quickly assess which channels deliver the strongest returns, identify underperforming campaigns, and allocate budgets for maximum impact. The dashboard’s visualizations—ranging from multi-touch attribution charts to geo-mapping and funnel analysis—help teams understand campaign effectiveness at a glance.
Automated Marketing Insights & AI-Driven Recommendations
Going beyond static dashboards, TapClicks leverages AI-powered features like SmartPilot and customizable AI Agents to automatically analyze campaign data and surface actionable insights. Users receive proactive recommendations for optimization, budget pacing, and media mix—all delivered through intuitive visuals and even automated SmartEmail reports sent directly to stakeholders. This means less time spent digging through spreadsheets and more time acting on what matters.
Customizable Dashboards for Every Stakeholder
Every agency, brand, or enterprise team has unique reporting needs. TapClicks enables users to create tailored dashboards and branded reports for different audiences, whether it’s a high-level executive summary, a deep-dive for analysts, or a client-facing performance snapshot. With role-based access controls, you ensure each user sees the data and insights relevant to their responsibilities.
Seamless Integration and Flexible Data Use
One of TapClicks’ greatest strengths is flexibility. Organizations can use TapClicks as their single source of marketing truth—or leverage its robust data integration capabilities to feed enriched, normalized data into external BI tools like Tableau, Power BI, or Looker. This ensures that teams can operationalize their analytics in the way that best fits their existing workflows.
For a closer look at the full suite of features, visit TapClicks and discover how a unified analytics dashboard can transform your approach to marketing performance and reporting.
Why a Unified Analytics Dashboard Is a Game Changer
A single, consolidated analytics dashboard does more than tidy up your reporting—it transforms the way marketing teams make decisions. Here’s why bringing all your campaign data together unlocks next-level performance:
What Happens When You Integrate All Your Channels?
When you unify data from every channel (search, social, programmatic, email, and more):
- Break Down Silos: No more isolated data sets—see the big picture at a glance.
- Easy Comparison: Instantly compare performance across tactics and platforms.
- Clear Attribution: Understand exactly how each touchpoint influences conversions.
Example in Action:
A retail brand running Google Ads, Facebook campaigns, and email promotions can use TapClicks to:
- Visualize cross-channel attribution (see which channels drive conversions)
- Track spend and ROI in real time
- Reallocate budget instantly to top-performing campaigns
How TapClicks Elevates Multi-Channel Analytics
TapClicks goes beyond basic dashboards by harnessing AI and smart automation:
-
Performance Tracking Dashboard:
Real-time, omnichannel view of all campaigns -
AI-Powered Recommendations:
TapClicks’ SmartPilot and SmartEmail deliver:- Automated insights and optimization suggestions
- Alerts on underperforming channels
- Actionable next steps to improve results
-
Automated Insight Summaries:
Agencies managing dozens of client campaigns get regular email digests—no manual analysis required
Attribution and Optimization Made Simple
Forget the headache of juggling spreadsheets. With TapClicks you get:
| Without TapClicks | With TapClicks |
|---|---|
| Disparate spreadsheets | Unified dashboard for all channels |
| Manual, error-prone attribution | Automated, accurate attribution modeling |
| Slow budget adjustments | Real-time spend reallocation |
| Guesswork on campaign impact | Data-driven, actionable insights |
What Does This Mean for Your Team?
- Less Guesswork: Confidently optimize mid-flight campaigns based on real-time data.
- Faster Decisions: Spot issues and opportunities instantly—no more waiting for manual reports.
- Prove Value: Justify spend and strategy with clear, unified analytics for stakeholders.
Bottom line:
Unified multi-channel analytics isn’t just a reporting upgrade—it’s your foundation for smarter, faster, and more profitable campaign management. With TapClicks, every marketing decision is grounded in reliable, real-time insights.
Data Aggregation and Integration: The Foundation of Unified Insights
At the heart of every effective multi-channel analytics dashboard lies the ability to bring together disparate marketing data into a single, cohesive view. Without robust data aggregation and integration, cross-channel insights are fragmented—making true marketing intelligence impossible. This foundational step is where TapClicks sets itself apart, empowering marketing teams to seamlessly unify and harness their data at scale.
Comprehensive Connectivity: TapClicks boasts an industry-leading library of over 10,000 marketing, advertising, and business data connectors. Whether you’re pulling campaign results from Google Ads, organic reach from Facebook, e-commerce analytics from Shopify, or local performance from dozens (or hundreds) of franchise locations, TapClicks automates the connection and ingestion of all your data sources. This breadth of integration eliminates manual data pulls and data silos, enabling a holistic view across every channel, region, or client.
Automated ETL/ELT Pipelines: The platform’s automated ETL (Extract, Transform, Load) and ELT pipelines mean that data isn’t just collected, but is also transformed and loaded into TapClicks—or your external BI environment—without tedious manual intervention. Marketers gain near real-time access to harmonized data, accelerating the speed to insight and freeing up countless hours previously spent wrangling spreadsheets.
Data Enrichment and Normalization: True multi-channel analytics requires more than just data aggregation—it demands data that’s comparable and actionable across channels, devices, and markets. TapClicks’ enrichment tools blend, normalize, and standardize datasets, making it possible to compare KPIs across different platforms or locations. For agencies with multi-client portfolios or brands with multiple locations, this means consistent, apples-to-apples reporting that fuels more accurate benchmarking and smarter decision-making.
By investing in robust data aggregation and integration, organizations lay the groundwork for unified, actionable insights—turning their multi-channel analytics dashboard into a true command center for marketing performance. To learn more about how TapClicks can streamline your data foundation, visit the official TapClicks site.
Automated Marketing Insights & Intelligence Reporting
A modern multi-channel analytics dashboard should do more than display raw numbers—it should illuminate opportunities, surface risks, and automate routine analysis. TapClicks delivers this future today, harnessing AI-powered intelligence reporting to transform marketing data into actionable insights.
With TapClicks’ SmartPilot and customizable AI agents, marketers no longer need to dig through endless dashboards to spot trends or diagnose performance issues. Instead, the platform automatically analyzes your cross-channel data, scoring campaigns and flagging anomalies, so you’re always one step ahead. Through predictive models, TapClicks can forecast outcomes, recommend budget reallocations, and even benchmark your performance against historical or industry standards.
Automated alerts and SmartEmail summaries ensure that both internal teams and clients receive timely, relevant updates—without manual effort. Whether it’s a sudden drop in ad engagement, an opportunity to optimize spend, or a cross-platform attribution insight, TapClicks’ intelligence reporting delivers it directly to your inbox or dashboard. This not only boosts efficiency, but also empowers teams to make faster, more confident decisions.
Discover how TapClicks can help you streamline analytics reporting and boost analytics reporting with advanced automation and AI-driven recommendations. With intelligence baked into every report, TapClicks transforms analytics from a chore into a competitive advantage—freeing your team to focus on strategy and growth.
Best Practices for Implementing a Multi-Channel Analytics Dashboard
A successful multi-channel analytics dashboard implementation hinges on thoughtful planning, seamless data integration, and ongoing optimization. Whether you’re an agency managing hundreds of client campaigns or a brand consolidating multi-location performance, following these best practices ensures you get maximum value from your analytics investment.
1. Start with Stakeholder Alignment and Clear Objectives
Before diving into setup, engage key stakeholders—marketing, sales, analytics, and executive teams—to define reporting goals, KPIs, and success metrics. Clarify which channels, campaigns, and business units require visibility. This alignment ensures your dashboard delivers actionable insights tailored to the needs of each audience.
2. Streamline Onboarding and Data Integration
Leverage TapClicks’ extensive library of over 10,000 marketing, advertising, and business connectors to integrate all relevant data sources. Use automated ETL/ELT pipelines to extract, transform, and load data, reducing manual effort and accelerating time to value. For unique or custom data sources, employ Smart Connectors to ensure no critical data is left out.
3. Design Customizable Dashboards for Every Stakeholder
With TapClicks, you can build drag-and-drop dashboards that reflect the specific needs of agencies, brands, or enterprise teams. Create role-based access so each stakeholder sees the most relevant data—executives get high-level ROI and pacing, while campaign managers drill down into channel-level performance. Brand dashboards with client logos and custom visuals to enhance professionalism and trust.
4. Automate Recurring Reporting and Analytics Tasks
Set up automated, scheduled reports to deliver insights directly to stakeholders’ inboxes, freeing your analysts from repetitive data pulls. TapClicks’ SmartEmail and AI-powered insights help surface trends and anomalies without manual effort. Automate routine alerts and performance summaries to keep teams proactive and data-driven.
5. Continually Optimize and Evolve Your Dashboards
Regularly review dashboard usage and stakeholder feedback to refine visualizations, metrics, and reporting cadence. As new marketing channels emerge or business needs shift, TapClicks’ flexible platform enables you to add connectors, update KPIs, and expand reporting without rebuilding from scratch.
6. Emphasize Data Quality and Normalization
Ensure incoming data is cleaned, normalized, and enriched for accurate cross-channel analysis. TapClicks’ data enrichment tools help unify disparate datasets for apples-to-apples comparisons—especially crucial for multi-location, multi-client, or cross-channel reporting environments.
7. Provide Training and Documentation
Invest in onboarding sessions and user guides to help teams maximize dashboard adoption. Empower users to explore self-service analytics, set up custom views, and interpret AI-driven recommendations.
Implementing a unified analytics dashboard is not a one-and-done project—it’s an evolving process that can deliver transformative efficiency and insight. By following these best practices and leveraging a proven platform like TapClicks, your organization can move from siloed data chaos to streamlined, actionable marketing intelligence.
Choosing the Right Multi-Platform Reporting Solution
Selecting the best multi-channel analytics dashboard for your organization requires a careful evaluation of both current needs and future ambitions. With a crowded market of reporting solutions—such as Funnel.io, Agency Analytics, Supermetrics, Datorama, and NinjaCat—the differences often come down to scale, usability, and intelligence.
Many platforms, like Funnel.io and Supermetrics, excel at data extraction and pipeline automation but stop short at offering unified visualization or AI-driven insights. Others, such as Agency Analytics and NinjaCat, provide lightweight dashboards ideal for small agencies but may struggle to support high-volume, multi-client operations or advanced analytics. Enterprise-focused options like Datorama (Salesforce) can handle complexity, but often at the cost of lengthy implementations and steep learning curves.
TapClicks sets itself apart through a unique blend of scale, intelligence, and operational integration. Its platform is designed to handle thousands of dashboards and clients simultaneously, making it a go-to solution for agencies and enterprise teams managing large, distributed portfolios. TapClicks’ AI-powered features—like SmartPilot for automated insights, campaign scoring, and predictive modeling—deliver not just data, but actionable recommendations that drive real business outcomes. The ability to automate recurring workflows, generate branded client reports, and integrate seamlessly with over 10,000 connectors means less time wrangling spreadsheets and more time focusing on strategy.
When evaluating solutions, consider these guiding questions:
- Scalability: Can the platform handle your current—and future—reporting volume?
- Automation: How much manual effort does the system eliminate in data integration, reporting, and insights delivery?
- Intelligence: Does it go beyond dashboards to offer AI-driven recommendations and predictive analytics?
- Flexibility: Can it act as your single source of truth, or integrate easily with your BI stack (e.g., Tableau, Power BI)?
- Workflow Integration: Does it support collaboration across teams, from sales to fulfillment?
Ultimately, the right choice is the platform that not only centralizes your data but also empowers your teams to act faster, smarter, and at scale. To see how TapClicks delivers on these promises, visit TapClicks and discover why leading agencies and brands trust it as their unified marketing analytics operating system.
Why Unified Analytics Is a Game Changer
Today’s marketing moves fast—and marketing leaders need insights to move even faster. Unified analytics isn’t just a “nice to have” anymore; it’s the backbone of modern marketing operations.
What Makes a Unified Dashboard So Valuable?
- End Data Chaos: No more toggling between platforms or exporting endless CSVs. Multi-channel dashboards bring all your marketing data—ads, social, search, email, web—into a single view.
- Act on Insights, Not Gut Feelings: With consolidated reporting, trends and opportunities pop out, enabling teams to make confident, ROI-driven decisions.
- Automate the Busywork: Scheduled reports and AI-powered summaries mean less time spent on manual exports and more time on strategy.
How TapClicks Powers Better Marketing Decisions
Whether you’re:
- Juggling campaigns across dozens of channels,
- Managing reports for hundreds of clients,
- Or optimizing performance for a multi-location brand,
TapClicks transforms fragmented data into actionable intelligence—at scale.
Here’s What Sets TapClicks Apart:
| Feature | TapClicks Advantage |
|---|---|
| Scale | Handles thousands of dashboards and clients at once |
| AI Insights | Surfaces opportunities and optimizations automatically |
| Integrated Workflow | Unifies reporting, analytics, and operations in one platform |
Take the Next Step
Don’t let data complexity slow you down. With TapClicks, you can focus on strategy—not spreadsheets.
Ready to unlock the power of unified marketing analytics?
Explore TapClicks or request a personalized demo to see what’s possible for your team.
Start Automating Your Marketing Data Today!
No Credit Card Required.

