

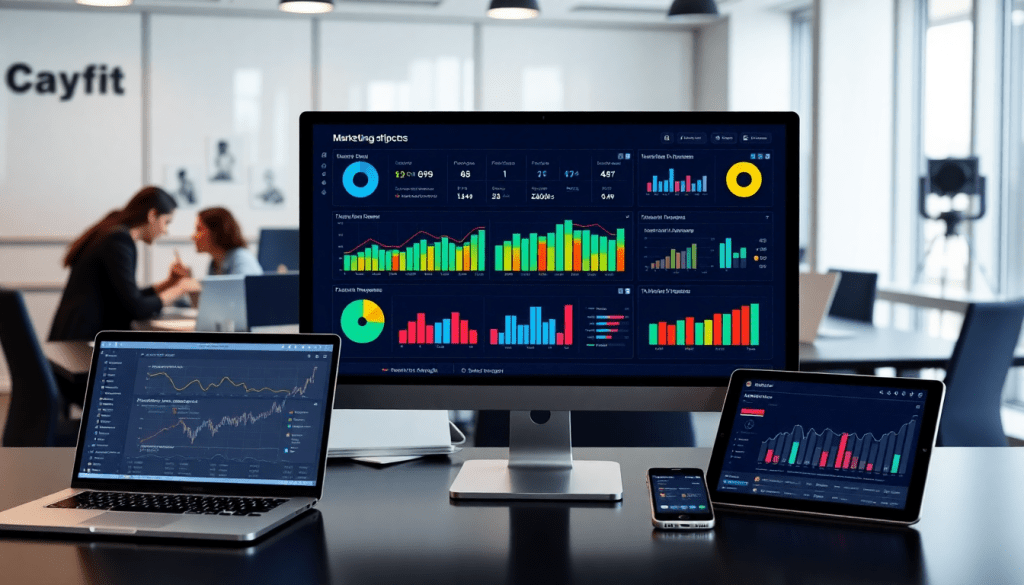
Multi-Channel Analytics Dashboard: Unified Marketing Insights
Marketing leaders and analysts are often challenged by the fragmented nature of campaign data—spread across platforms, channels, and reporting systems. A multi-channel analytics dashboard solves this by aggregating marketing data, automating insights, and delivering unified, cross-channel reporting. With solutions like the TapClicks analytics dashboard, teams gain real-time clarity into campaign performance, ROI, and channel effectiveness—empowering better decisions at scale. This guide explores how a unified reporting platform transforms marketing intelligence with integrated metrics, automation, and intuitive visualizations.
What is a Multi-Channel Analytics Dashboard?
A multi-channel analytics dashboard is a centralized digital hub that aggregates and visualizes marketing data from numerous platforms—such as Google Ads, Facebook, LinkedIn, email, SEO tools, and more—into a single, unified interface. Its core purpose is to enable marketers, agencies, and enterprise teams to monitor, analyze, and optimize campaign performance across every channel without toggling between disjointed reports or manually consolidating spreadsheets.
At its heart, a multi-channel analytics dashboard delivers three essential functions:
- Marketing Data Aggregation: Automatically pulls and merges data from disparate sources, eliminating silos and presenting a holistic view of all marketing initiatives.
- Campaign Performance Visualization: Transforms raw data into intuitive charts, graphs, and KPIs, making it easier for teams to spot trends, compare channels, and measure success.
- Omnichannel Analytics Solution: Goes beyond single-channel reporting to offer true cross-channel insights, highlighting how different touchpoints work together to drive results.
Unified reporting is vital for brands managing multi-location operations, agencies handling dozens (or hundreds) of client campaigns, and enterprise teams seeking scalable marketing intelligence. It empowers faster, more accurate decision-making, reduces manual effort, and provides stakeholders with timely, actionable insights. In today’s data-driven environment, a single source of marketing truth isn’t just a convenience—it’s a competitive necessity.
For a deeper dive into how dashboard automation transforms agency efficiency, check out this resource on "marketing dashboard automation for agency efficiency".
Why Unified Reporting Platforms Change the Game for Marketers
Unified reporting platforms aren’t just a convenience—they’re a game-changer for marketing teams navigating ever-growing data complexity. Here’s how they make a measurable impact:
No More Data Chaos: Everything in One Place
- Centralized Hub: Access every campaign metric—across all channels and clients—in a single, streamlined dashboard.
- Cross-Channel Visibility: Instantly compare performance data from search, social, display, and more.
- Consistent Metrics: Standardized, apples-to-apples comparisons, no matter where the data originates.
Massive Time Savings
- Automated Data Aggregation: Eliminate manual data pulls and spreadsheet wrangling.
- Scheduled Reporting: Set it and forget it—reports are generated and delivered automatically.
- 50+ Analyst Hours Saved: Many teams reclaim over 50 hours per analyst, per month, just by automating the reporting process.
Accuracy You Can Rely On
- Fewer Human Errors: Minimal manual entry means fewer mistakes and greater confidence in your numbers.
- Standardization: Unified definitions and calculations across all campaigns and clients.
- Audit-Friendly: Easy to trace data back to its source for validation or compliance.
Faster, Smarter Decisions
- Real-Time Insights: Up-to-date dashboards let you spot trends and issues as they happen.
- Budget Optimization: Quickly identify underperforming channels and reallocate spend where it matters most.
- Client-Ready: Instantly share polished, branded reports that build trust and credibility.
Collaboration and Alignment Get Easier
- Single Source of Truth: Everyone—internal teams, clients, leadership—works from the same, accurate data set.
- Faster Approvals and Strategy Shifts: Clear, unified reports enable swift, informed decision-making.
Want More?
See how automation and unified dashboards can supercharge your analytics and reporting:
Read the Guide: Marketing Dashboard Automation & Analytics Reporting
Features to Look for in a Performance Tracking Dashboard
Selecting the right performance tracking dashboard is crucial for marketing teams aiming to unify and simplify their analytics. Here are the must-have features that set the best solutions apart:
Automated Data Pulls: Manual data collection is time-consuming and error-prone. The ideal dashboard offers robust, automated integrations that seamlessly pull data from all your marketing platforms—whether it’s Google Ads, Facebook, programmatic networks, or CRM systems. This ensures your reports are always up to date and frees your team to focus on strategic analysis rather than repetitive tasks.
Customizable Dashboards: Every team, client, or stakeholder has unique reporting needs. Look for dashboards that allow full customization—drag-and-drop widgets, modular templates, and white-label branding—so you can tailor the view for executives, account managers, or clients. This adaptability is vital for agencies juggling multi-client reporting or brands managing multiple business units.
Integrated Marketing Metrics: Unified dashboards should aggregate and normalize metrics across channels, allowing you to compare performance apples-to-apples. Look for solutions that blend data from paid, owned, and earned media, standardize KPIs, and provide cross-channel attribution, so you can get a true picture of ROI.
Role-Based Access: Data governance and security are non-negotiable, especially for agencies and enterprise teams. Choose dashboards with granular, role-based access controls to ensure the right people see the right data—facilitating collaboration without compromising sensitive information.
Campaign Performance Visualization: The best dashboards turn raw data into meaningful visuals—interactive charts, tables, and graphs that make insights immediately clear. Effective visualization helps marketers spot trends, compare time periods, and drill into specific campaigns or channels to understand what’s driving results.
Real-Time Updates and Automated Insights: In today’s fast-paced marketing environment, real-time data is a necessity. Dashboards should deliver live updates and, ideally, automated marketing insights—surfacing anomalies, trends, and optimization opportunities without manual analysis. This empowers marketers to act quickly and confidently.
When evaluating solutions, prioritize dashboards that combine these features to support smarter, faster, and more strategic marketing decisions. For a deeper dive into how automation and analytics reporting can transform your workflow, see marketing dashboard automation and analytics reporting. And to explore how a unified platform like TapClicks delivers all these capabilities at scale, visit TapClicks.
How TapClicks Powers Multi-Platform Reporting and Analytics
TapClicks isn’t just another dashboard—it's a marketing intelligence powerhouse designed for the complexity of today’s multi-channel world. Here’s how TapClicks brings clarity, speed, and strategy to marketing reporting and analytics:
Your Single Source of Truth for Campaign Data
Why TapClicks?
- Centralizes data from over 10,000 marketing, advertising, and business sources
- Eliminates silos between channels, campaigns, and client accounts
- Empowers cross-channel optimization with unified visibility
How it Works:
| Data Integration Features | What It Means for You |
|---|---|
| 10,000+ Smart Connectors | Social, search, programmatic, email, offline…all in one place |
| Automated ETL/ELT Pipeline | Extract, transform, and load data—no manual wrangling |
| Dataset Blending & Normalization | Seamlessly compare campaigns, clients, or locations |
AI-Driven Insights (So You’re Always Ahead)
TapClicks’ AI capabilities put actionable insights front and center. Here’s what stands out:
- AI Agents: Instantly surface trends, budget pacing issues, and anomalies
- SmartEmail: Get curated, actionable summaries delivered to your inbox or your client’s
- Real-Time Opportunity Identification: Move from reactive to proactive marketing decisions
Reporting That Actually Saves Time
Managing hundreds of dashboards? No sweat.
- Drag-and-Drop Dashboards: Customizable, intuitive, and fully branded
- Automated, Scheduled Reports: Set once, impress clients forever
- Role-Based Access: Ensure the right people see the right data (and only the right data)
- Efficiency Gains: Reduce analyst reporting workload by 50+ hours/month
Why This Matters for Agencies & Brands
Whether you’re a large agency juggling dozens of clients or a multi-location brand tracking performance across geographies, TapClicks gives you:
- Faster turnaround on reporting
- More accurate, up-to-date analytics
- The ability to scale operations without adding headcount
- Confidence to make data-driven decisions, not just data-driven guesses
Ready to see it in action?
Explore the power of automated data collection and discover how TapClicks can unlock real-time insights, drive smarter decisions, and transform your marketing operations at scale.
Best Practices for Campaign Performance Visualization
Designing an effective campaign performance dashboard requires more than simply aggregating data; it’s about presenting information in ways that drive action, clarity, and collaboration. Here are essential best practices to ensure your dashboards deliver real value:
1. Prioritize Clarity with Smart Visualization Techniques
Choose the right visual elements for your metrics. Use bar and line charts to illustrate trends over time, pie charts to show channel share, and tables for granular breakdowns. Key Performance Indicators (KPIs) should be featured prominently—think impressions, clicks, conversions, and spend—so stakeholders can assess campaign health at a glance. Including comparison periods (such as week-over-week or year-over-year) provides necessary context for interpreting performance shifts.
2. Tailor Detail to the Audience
Different stakeholders need different levels of detail. Executives and clients often want high-level summaries—such as overall ROI, top-performing channels, or budget pacing—while analysts and campaign managers may require deep dives into channel, creative, or geo-level performance. Use dashboard filters and role-based views to ensure each audience sees what matters most, without information overload.
3. Balance Summary and Drill-Down
Start with summary widgets: an at-a-glance snapshot of core metrics. Then enable interactive elements—such as clickable charts or dropdowns—to let users drill down into specific campaigns, channels, or date ranges. This layered approach supports both quick executive check-ins and deeper analysis by your marketing team.
4. Customization and Branding
Customize dashboards to align with team or client priorities. For agencies, tailor reporting to highlight campaign objectives for each client. For in-house teams, build dashboards around business lines, regions, or product categories. Branded visualizations—using your logo, color palette, and terminology—reinforce professionalism and help stakeholders connect with the data.
5. Automate and Refresh Regularly
Automated data pulls and scheduled refreshes ensure stakeholders always see the most current performance. This is vital for agile optimization and proactive issue resolution. Solutions like TapClicks offer automated updates and flexible scheduling, so your team spends less time chasing data and more time analyzing impact.
By following these best practices, you can deliver dashboards that not only communicate results clearly but also empower better, faster marketing decisions for every stakeholder.
Maximizing ROI with Real-Time Data and Automated Insights
In today’s fast-paced marketing landscape, the ability to act on up-to-the-minute campaign data and automated insights is a game changer for ROI. Real-time analytics empower marketers to move beyond static, rearview reporting toward active, ongoing optimization. With a multi-channel analytics dashboard, teams can spot trends, anomalies, and opportunities for improvement as they unfold, rather than waiting for end-of-month reviews or static exports.
Unified dashboards provide instant visibility across campaigns, channels, and client portfolios. For example, if a paid social campaign’s cost-per-click starts to spike unexpectedly, real-time alerts and visualizations can flag the issue immediately. Marketers can pause or adjust budgets, reallocate spend to higher-performing channels, or test new creative—minimizing wasted spend and maximizing returns. Similarly, automated insights can highlight underperforming geographies, creative fatigue, or audience segments that warrant a strategic pivot before more budget is committed.
The most powerful dashboards, like those offered by TapClicks, go beyond surface-level metrics. Built-in AI and predictive analytics deliver actionable recommendations, such as forecasting which channels are likely to deliver the best ROI or suggesting optimal budget pacing based on historical trends. This level of automation not only saves time but also enables marketers to make smarter, data-driven decisions with confidence.
Consider the value of automated reporting: Instead of manually compiling spreadsheets and searching for insights, TapClicks’ AI-powered dashboards analyze campaign performance, generate insight summaries, and even email them directly to stakeholders. This ensures that marketing and executive teams always have the latest intelligence at their fingertips—without the bottleneck of manual analysis.
Ultimately, leveraging real-time data and automated insights through unified dashboards accelerates marketing performance cycles, reduces inefficiencies, and drives measurable improvements in ROI. By centralizing analytics and surfacing smart recommendations, marketers can proactively optimize campaigns and demonstrate tangible business value, campaign after campaign.
Integrating Multi-Channel Dashboards with Your Marketing Stack
To unlock the full value of a multi-channel analytics dashboard, seamless integration with your existing marketing stack is essential. Modern marketing teams rely on a complex array of tools—ad platforms like Google Ads and Facebook, CRMs such as Salesforce or HubSpot, ecommerce systems like Shopify, and BI tools including Tableau or Power BI. The challenge is not just to consolidate data from these sources, but to ensure that information flows smoothly and securely between systems, enabling centralized analysis and reporting.
Connecting Your Ecosystem:
The foundation of integration lies in robust APIs, pre-built connectors, and flexible data pipelines. Leading platforms, such as TapClicks, provide access to an expansive library of over 10,000 marketing, advertising, and business data connectors. These tools simplify the process of aggregating data from disparate sources—whether you’re pulling campaign metrics from multiple ad networks, syncing sales data from your CRM, or exporting cleaned datasets to external BI tools for deeper analysis. Automated ETL/ELT (Extract, Transform, Load) pipelines ensure that data is not only imported but also normalized and enriched for consistent cross-channel reporting.
Overcoming Common Integration Hurdles:
Integration can sometimes be complicated by data silos, inconsistent naming conventions, and platform-specific API limitations. The most effective dashboards provide solutions such as smart connectors, which can map, blend, and harmonize metrics across sources, as well as custom field mapping to resolve discrepancies in data structure. Additionally, look for platforms that support role-based access and data governance, ensuring that sensitive information is only visible to authorized users.
Future-Proofing Your Marketing Data Infrastructure:
As your marketing stack evolves, your dashboard should scale with you. Prioritize solutions that offer flexible integration options—so you can add, remove, or update data sources without disrupting your workflows. By leveraging a unified platform like TapClicks, you ensure that your analytics dashboard remains the reliable hub for all marketing intelligence, supporting both current needs and future growth.
With the right integration strategy, your multi-channel dashboard becomes more than just a reporting tool—it’s the connective tissue that enables holistic, data-driven marketing operations.
Getting Started with TapClicks Analytics Dashboard
Embarking on your unified marketing intelligence journey with TapClicks is straightforward, whether you’re an agency managing hundreds of client accounts or a brand centralizing multi-location performance. Here’s how to get started and make the most of the TapClicks analytics dashboard:
1. Connect Your Data Sources Effortlessly
Begin by leveraging TapClicks’ library of 10,000+ data connectors to unify all your marketing and advertising platforms—think Google Ads, Facebook, programmatic networks, CRMs, and more. The platform’s Smart Connectors and automated ETL/ELT pipelines ensure that even custom or offline datasets are seamlessly integrated, enriching your dashboards with comprehensive, normalized data.
2. Build Your Custom Dashboards
TapClicks features an intuitive drag-and-drop dashboard builder. Select from a wide array of visualization widgets—charts, tables, KPIs, and more—to craft dashboards tailored to your unique reporting needs. Whether you’re setting up high-level summaries for executives or granular, channel-specific views for campaign managers, TapClicks makes it easy to design actionable, branded dashboards.
3. Schedule Automated, Branded Reports
Eliminate manual reporting by setting up automated delivery of scheduled reports. TapClicks enables you to define recipient lists, reporting frequencies, and delivery formats (PDF, PowerPoint, web links), ensuring stakeholders always have up-to-date insights—without analyst intervention.
4. Leverage Training Resources and Support
TapClicks supports new users with a robust onboarding program, including live training, an extensive knowledge base, and responsive customer support. Agencies and brands have access to best practice guides, video tutorials, and community forums to accelerate adoption and maximize value.
5. Take the Next Step—Experience TapClicks in Action
Ready to see how unified marketing dashboards can transform your reporting workflow and campaign insights? Explore a guided demo or sign up for a trial at TapClicks to experience real-time marketing intelligence and automated analytics firsthand.
By following these steps, your team will quickly move from fragmented, manual reporting to actionable, centralized insights—empowering better decisions and delivering greater value to clients and stakeholders.
Start Automating Your Marketing Data Today!
No Credit Card Required.

