

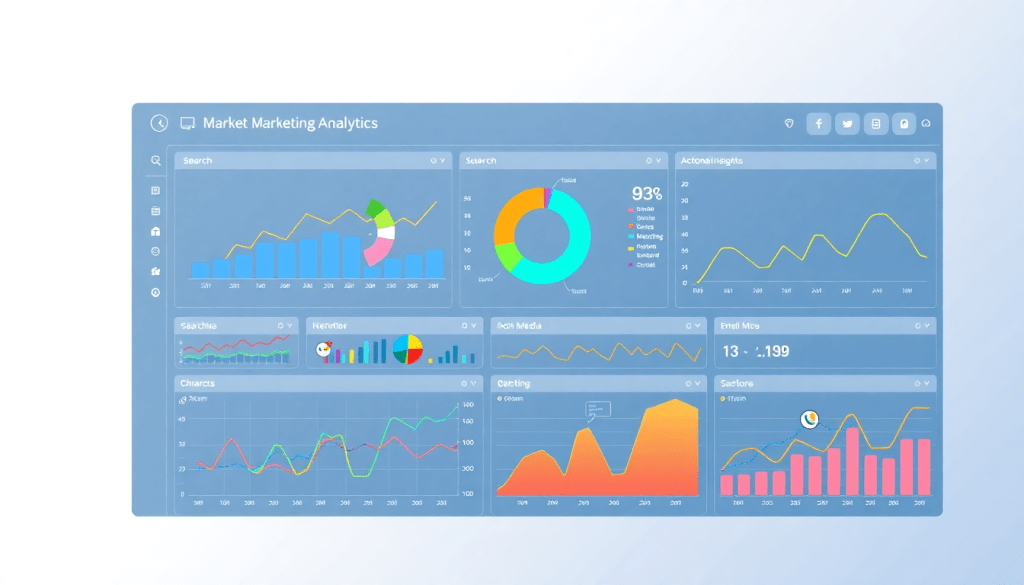
Multi-Channel Analytics Dashboard: Unified Marketing Insights
A multi-channel analytics dashboard brings all your marketing data together in one place, making it easier to see how campaigns are performing across every platform. Instead of juggling siloed spreadsheets or logging into countless tools, you get a single, unified view—so you can move from just tracking the numbers to actually understanding what’s working (and why). With TapClicks, you unlock cross-channel analytics, automated insights, and campaign visualization that help you make faster, smarter decisions about your marketing investments.
Why Unified Reporting Makes All the Difference for Modern Marketers
Marketing today isn’t just multi-channel—it’s truly multi-platform, multi-format, and multi-team. With campaigns running simultaneously on paid search, social, display, email, OTT, and beyond, it’s easy for your data to become fragmented and your insights to get lost in the chaos.
The Problem: Data Silos and Manual Reporting Headaches
Here’s what happens when reporting isn’t unified:
- Wasted hours: Teams spend countless hours manually exporting, formatting, and reconciling data from disparate sources.
- Conflicting metrics: Numbers often don’t match up across platforms, leading to confusion and second-guessing.
- Slow, error-prone processes: Manual data handling increases the risk of human error and slows down your ability to act.
- Insights trapped in silos: When data lives in separate spreadsheets or isolated tools, spotting cross-channel trends or true ROI is nearly impossible.
- Stalled collaboration: Disconnected reporting can stall teamwork, delay insights, and hinder quick pivots on underperforming campaigns.
The Solution: One Dashboard, All Your Data
Unified reporting platforms like TapClicks solve these challenges by bringing everything together in one place. Here’s how:
- All channels, one view: See paid, social, search, display, and more in a single dashboard.
- Automated data integration: No more wrangling spreadsheets—data flows in automatically, updated in real time.
- Scheduled reporting: Set it and forget it. Reports go out to stakeholders on your schedule, not theirs.
- Holistic insights: Spot cross-channel trends, attribute ROI accurately, and optimize campaigns quickly.
- Scalable for any team: Whether you’re an agency with hundreds of clients or a brand managing dozens of locations, TapClicks scales with you.
What This Means for You
When your marketing insights are unified:
- Decisions are faster: No more waiting for manual reports.
- Decisions are smarter: Access to holistic, cross-channel insights means you see the full picture.
- Results are better: Less guesswork, more actionable strategy, and improved ROI.
Want to see how dashboard automation can take your analytics to the next level?
Check out "Marketing Dashboard Automation: Boost Analytics & Reporting".
Core Features of a Multi-Channel Analytics Dashboard
A high-quality multi-channel analytics dashboard is more than just a collection of charts; it’s a dynamic command center for your marketing operation. To truly empower marketers, agencies, and brands, the dashboard should deliver several must-have features:
1. Cross-Channel Integration:
The foundation of any effective dashboard is seamless integration with all your marketing channels—search, social, display, email, programmatic, and beyond. TapClicks sets the industry standard with over 10,000 pre-built connectors, allowing teams to unify data from virtually any source without the hassle of manual imports or custom development.
2. Campaign Performance Visualization:
Raw data is only as useful as your ability to interpret it. Leading dashboards, like those in TapClicks, offer intuitive, drag-and-drop interfaces to build dashboards and visualizations tailored to your KPIs. This means you can quickly see how each campaign is performing, identify trends, and share insights with stakeholders, all in a format that’s clear and actionable.
3. Automated Insights:
In today’s fast-paced landscape, manual analysis can’t keep up. TapClicks leverages AI-powered insights—such as SmartPilot and AI Agents—to automatically analyze your dashboards and datasets, surfacing key findings, trends, and optimization recommendations. Tools like SmartEmail even deliver curated insight summaries directly to your inbox or clients, ensuring you never miss a critical opportunity or emerging issue.
4. ROI Tracking Dashboards:
Ultimately, every marketer wants to know: what’s driving results? TapClicks’ dashboards make it easy to track ROI and budget pacing across all your campaigns, consolidating spend and outcome data in one place. Predictive models help benchmark performance, so you can allocate resources where they’ll have the greatest impact.
TapClicks’ unified approach means you’re not just aggregating data—you’re transforming it into actionable intelligence. By bringing together cross-channel metrics, rich visualizations, and automated insights, the platform empowers marketing teams to make faster, more confident decisions. Explore how TapClicks can elevate your marketing analytics at www.tapclicks.com.
Cross-Channel Marketing Analytics in Action
A true multi-channel analytics dashboard doesn’t just collect data—it brings it to life by seamlessly aggregating and comparing campaigns across every marketing touchpoint. Imagine you’re running search ads on Google, social campaigns on Facebook and Instagram, display ads across the web, and email marketing blasts—all at once. Without a unified dashboard, you’d be forced to log into each platform separately, export reports, and try to reconcile metrics in endless spreadsheets. This approach is not only time-consuming but also prone to errors and blind spots.
With a platform like TapClicks, all your data flows into a single, cohesive environment. For example, you can instantly visualize how your paid search campaigns are stacking up against your social ad performance, or see how a recent email promotion influenced traffic and conversions across your website and digital ads. By comparing cost-per-acquisition or click-through rates side by side, you can quickly identify which channels are driving the best ROI and which might need reallocation of spend.
Let’s say your display ads are generating a high impression count, but your social campaigns are delivering more engaged leads at a lower cost. With omnichannel analytics, you spot these trends in real time, enabling you to shift budget and creative resources where they’ll have the most impact. You can also uncover hidden relationships—such as how a spike in email activity correlates with increased branded search queries or conversions from other channels—powering smarter, data-driven decisions.
Multi-platform reporting software like TapClicks doesn’t just aggregate numbers; it transforms raw data into actionable insights. This means you spend less time wrangling disparate reports and more time optimizing your cross-channel strategy, identifying opportunities, and demonstrating the full value of your marketing efforts with confidence.
Automated Insights: From Data Overload to Smart Actions
For marketers, the sheer volume of data generated across channels can quickly become overwhelming. Manually sifting through thousands of campaign metrics and performance indicators is not only time-consuming—it also increases the risk of missed opportunities and slow response to market changes. That’s where automated insights come in, transforming data overload into smart, timely actions that drive real results.
With TapClicks, automated marketing insights are baked into the platform through powerful AI capabilities. Instead of waiting for analysts to pull and interpret reports, TapClicks leverages AI agents that continuously monitor your dashboards and datasets, surfacing key trends, anomalies, and optimization opportunities without manual intervention. For example, the SmartEmail feature automatically generates curated insight summaries and sends them directly to your team or clients, ensuring stakeholders are always in the loop with the most relevant, up-to-date findings.
Beyond alerts and summaries, TapClicks AI also powers predictive models—helping marketers benchmark performance, forecast outcomes, and receive proactive recommendations on budget pacing and campaign adjustments. The result is a dramatic reduction in time spent on routine analysis and a sharper focus on strategic decision-making.
To see how these capabilities come to life, check out the "Automated KPI Reporting Dashboard: TapClicks AI Platform Guide", which details how TapClicks streamlines insight delivery, boosts reporting efficiency, and empowers teams to act faster and smarter. Ultimately, automated insights bridge the gap between raw data and actionable marketing intelligence, freeing you to focus on what really matters: optimizing performance and driving growth.
Visualizing Campaign Performance & ROI
A well-designed campaign performance dashboard is more than just a collection of charts—it’s a visual command center that translates raw marketing data into clear, actionable insights. When marketers can instantly see which channels are driving conversions, how budgets are pacing, and where ROI is highest, they’re empowered to make smarter, faster decisions. That’s why effective ROI tracking dashboards are at the heart of any successful multi-channel analytics strategy.
Best Practices for Dashboard Design:
To maximize value, dashboards should be intuitive and tailored to each user’s needs. Start by segmenting data by user role—executives need high-level ROI snapshots, while campaign managers benefit from granular performance breakdowns. Use visual elements like bar charts, heat maps, and trend lines to highlight key metrics such as cost per acquisition, channel attribution, and real-time spend. Group related KPIs together and keep layouts uncluttered, ensuring that insights are easy to digest at a glance. Interactive filters and drill-downs let users customize their view, enabling deeper analysis without overwhelming the interface.
TapClicks’ Approach to Visualization:
With TapClicks’ branded reporting studio, agencies and brand teams can build custom dashboards that marry powerful analytics with clean, professional visuals. The drag-and-drop interface allows you to create tailored, client-ready reports in minutes, complete with your branding and color schemes. TapClicks’ visualization tools showcase campaign health, performance trends, and ROI across all platforms—making it simple to compare results, spot anomalies, and share insights with stakeholders.
By transforming complex data into engaging, easy-to-read visualizations, TapClicks helps marketers focus less on number crunching and more on driving campaign impact. To see how TapClicks’ dashboards can elevate your reporting, visit TapClicks.
Marketing Data Aggregation: How TapClicks Unifies Your Stack
In the age of omnichannel marketing, the ability to aggregate data from dozens—or even hundreds—of platforms is essential for any organization seeking a true 360° view of performance. TapClicks stands out with its robust data integration capabilities, enabling seamless aggregation, enrichment, and normalization of marketing data at scale.
Seamless Data Integration and ETL/ELT
TapClicks’ platform is built with over 10,000 native connectors, allowing users to pull in data from virtually any marketing, advertising, or business source. Whether it’s Google Ads, Facebook, programmatic display, email platforms, or e-commerce analytics, TapClicks automates the extract, transform, and load (ETL/ELT) process. This means your team spends less time on manual data wrangling and more time analyzing and acting on insights.
Data Enrichment and Normalization
What sets TapClicks apart is its ability to not only aggregate data, but also to enrich and normalize it across channels. Metrics from disparate sources are standardized, so you can compare performance apples-to-apples—no more headaches from mismatched naming conventions or inconsistent formats. TapClicks offers enrichment tools to blend datasets, enabling cross-channel, multi-location, and multi-client comparisons within the same dashboard.
Blending Multiple Sources into a Single Source of Truth
With TapClicks, users can combine social campaign results with search spend, layer on CRM outcomes, and even factor in offline conversions—all in one platform. This creates a single source of truth for marketing performance, empowering both granular and high-level analysis by any stakeholder. Campaigns can be tracked holistically, and insights can be shared without the fear of data silos or inconsistencies.
Advanced Use Cases: Multi-Location, Multi-Client, Enterprise Reporting
TapClicks’ data aggregation isn’t just for single brands or small teams. It’s architected for scale, supporting complex use cases like multi-location retail reporting, agency client roll-ups, and large-scale enterprise analytics. Customizable Smart Connectors and advanced user permissions ensure that each client, region, or brand sees only the data relevant to them—while leadership can roll up results across all entities in seconds.
From automated ETL pipelines to smart normalization and enterprise-grade scalability, TapClicks unifies your data stack so that your analytics, reporting, and insights are always comprehensive, consistent, and actionable.
Who Benefits from Multi-Channel Analytics Dashboards?
Multi-channel analytics dashboards aren’t just a tech upgrade—they’re a strategic necessity for today’s complex marketing teams. Let’s look at who gets the most value from unified dashboards and how these platforms transform the way organizations work.
Agencies and Media Companies:
For agencies managing dozens or even hundreds of client accounts, juggling platform logins and manual spreadsheets quickly becomes unsustainable. Multi-channel dashboards like TapClicks centralize client campaign data, automate reporting, and allow for role-based access—so account managers, sales teams, and analysts are always on the same page. This level of automation not only saves hours each week but also enables agencies to deliver more proactive client service by surfacing trends and insights before the competition. Discover how dashboard automation accelerates agency reporting in this guide.
Multi-Location Brands and Enterprises:
For retail chains, franchises, or large enterprises, consolidating marketing data across geographies, products, or business units is a major challenge. A unified dashboard aggregates performance metrics from every location, providing corporate teams with a single source of truth while giving local managers access to data relevant to their markets. This approach empowers both high-level strategic planning and on-the-ground optimization—driving smarter budget allocation and campaign execution.
Internal Marketing and Analytics Teams:
Enterprise marketing departments often struggle to connect the dots between channels—especially when data is siloed in different systems (search, social, CRM, programmatic, and more). With a multi-channel analytics platform, teams can blend and normalize metrics, visualize holistic performance, and collaborate seamlessly. The result: faster decision cycles, clearer ROI tracking, and the ability to act on insights in real time.
Collaboration and Workflow Streamlining:
The true value of unified dashboards isn’t just in the data—it’s in how they enable teams to work together. With features like automated alerting, scheduled reporting, and customizable dashboards by user role, everyone from executives to campaign specialists can focus on what matters most. TapClicks, for example, integrates workflow and order management, so teams can move from insight to action without ever leaving the platform.
Whether you’re a fast-growing agency, a national brand, or an enterprise marketing team, leveraging a unified analytics dashboard unlocks greater transparency, efficiency, and impact from your marketing efforts. To see how TapClicks can streamline your analytics and reporting workflow, visit tapclicks.com.
Choosing the Right Unified Reporting Platform
Selecting the best multi-channel analytics dashboard for your organization is about more than just connecting data sources—it’s about finding a platform that can evolve with your needs, simplify complex reporting, and deliver real business value. Here are the key criteria to consider when evaluating unified reporting solutions:
1. Scale & Performance:
Can the platform handle the volume and complexity of your data? For agencies and enterprises managing hundreds (or thousands) of clients and campaigns, robust scalability is a must. TapClicks stands out here, supporting thousands of dashboards and automated reports simultaneously—something many lightweight competitors struggle to match.
2. Flexibility & Integration:
Look for a solution with broad integration capabilities and customizable workflows. TapClicks offers over 10,000 marketing, advertising, and business data connectors, along with Smart Connectors for custom sources, ensuring you can unify data from virtually any platform. This flexibility lets you use TapClicks as your marketing OS or pipe data into existing BI tools like Tableau or Power BI.
3. Automation & Efficiency:
Automated ETL/ELT pipelines, scheduled reporting, and AI-powered insights are essential for reducing manual workloads and accelerating time-to-insight. TapClicks’ automation features routinely save analysts 50+ hours per month, freeing up teams to focus on strategy, not spreadsheet wrangling.
4. Actionable AI & Insights:
Many dashboards show you the “what”—few tell you the “why” or “what next.” TapClicks’ AI Agents and SmartEmail proactively surface insights, benchmark performance, and provide optimization recommendations, moving you from data overload to smarter decisions, faster.
5. User Experience & Customization:
A great dashboard should be intuitive, visually engaging, and adaptable to different user roles (executives, analysts, clients). TapClicks’ drag-and-drop dashboard builder and branded reporting studio make it easy to tailor insights for every audience.
Comparing TapClicks to Other Solutions
While point tools like Funnel.io, Adverity, or Supermetrics focus on data collection, and niche platforms such as Agency Analytics or NinjaCat target lightweight reporting, TapClicks uniquely combines enterprise-scale data integration, AI insights, and workflow automation in a single unified platform. Salesforce Datorama covers some similar ground but often requires more complex setup and specialized resources.
Ready to See Unified Reporting in Action?
Choosing the right platform can transform your marketing operations—enabling smarter collaboration, deeper insights, and measurable ROI. Explore how TapClicks can unify your marketing data, streamline reporting, and empower your team to make data-driven decisions at scale. Request a demo or start your trial today to experience the TapClicks difference.
Start Automating Your Marketing Data Today!
No Credit Card Required.

