

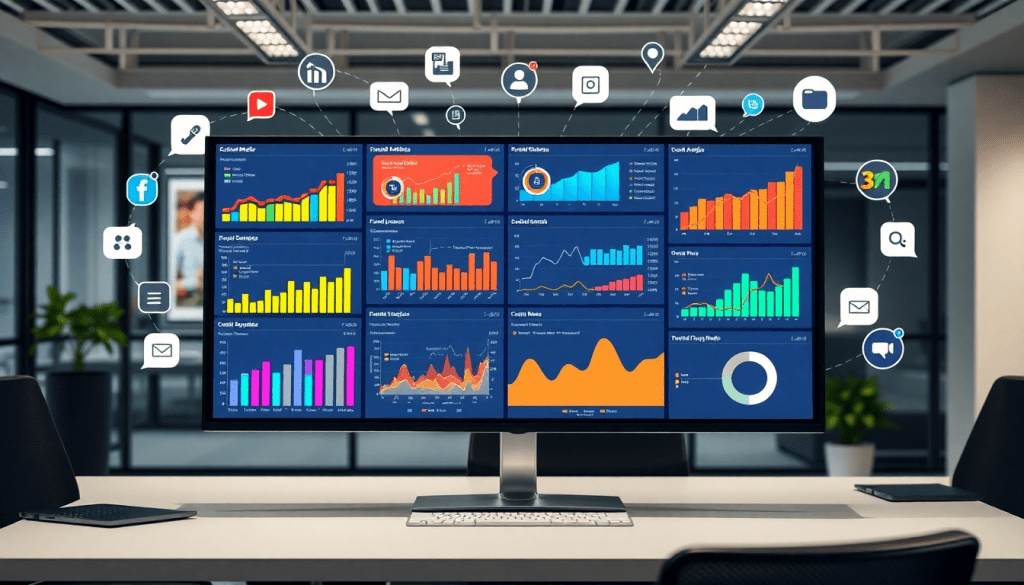
Multi-Channel Analytics Dashboard: Unified Marketing Insights
A multi-channel analytics dashboard is more than just a collection of charts and graphs—it’s the operational nerve center for modern marketing teams. By gathering campaign data from every channel, visualizing performance, and surfacing actionable insights in one unified reporting platform, these dashboards empower marketers to move beyond siloed spreadsheets and manual reporting. With the right solution, teams can monitor ROI, optimize spend, and confidently report results with speed and accuracy. Below, you’ll find a comprehensive outline for exploring the value, features, and practical steps for leveraging a multi-channel analytics dashboard like TapClicks.
Why a Multi-Channel Analytics Dashboard Matters
In today’s marketing landscape, data pours in from every direction—search ads, social media, email, display, video, and more. Each platform provides its own analytics, but that abundance leads to one of the modern marketer’s biggest headaches: data fragmentation. When campaign metrics are spread across dozens of tools and interfaces, it becomes nearly impossible to see the full picture. Valuable time is wasted toggling between tabs, downloading spreadsheets, and manually stitching together reports just to answer crucial performance questions.
Manual reporting isn’t just tedious; it’s risky. Errors can easily creep in during data transfer or spreadsheet formula updates. Insights are delayed, and by the time a report lands on a client’s or executive’s desk, the information may already be outdated. This slows decision-making and hampers a team’s ability to quickly adapt strategy or optimize budget allocation.
A unified multi-channel analytics dashboard eliminates these pain points by consolidating all your marketing data into a single, always-up-to-date view. By aggregating metrics across channels, marketers can unlock true cross-channel analytics—spotting trends, benchmarking results, and understanding how each campaign contributes to overall business goals. This holistic perspective is essential for modern marketing operations, enabling agile decisions and smarter resource allocation.
The benefits extend well beyond efficiency: with centralized reporting, agencies and brands can confidently answer client questions, prove ROI, and focus on strategy rather than data wrangling. For a deeper dive into how dashboard automation can transform agency reporting and boost efficiency, check out this guide on marketing dashboard automation benefits for agencies.
In short, a multi-channel analytics dashboard is no longer a luxury—it’s the foundation for strategic, data-driven marketing in a fast-paced digital world.
Core Features of a Unified Reporting Platform
A unified reporting platform is the backbone of effective multi-channel marketing analytics. To break down data silos and deliver holistic campaign insights, these platforms offer several essential components that transform how marketers access, interpret, and act on performance metrics:
1. Campaign Performance Visualization
At the heart of any unified dashboard is robust visualization. Marketers can track campaign KPIs across digital, social, search, and offline channels using intuitive charts, graphs, and scorecards—all in one place. This real-time visibility enables teams to spot trends, compare channel performance side by side, and quickly identify what’s driving results.
2. Real-time Data Aggregation
Unified platforms automatically pull and aggregate data from a vast array of sources—ad networks, analytics tools, CRM systems, and more. This eliminates manual data wrangling, ensuring reports always reflect the latest performance. With TapClicks, for example, over 10,000 marketing, advertising, and business data connectors power seamless integration and up-to-the-minute analytics.
3. ROI Tracking Dashboard
A best-in-class reporting suite doesn’t just show top-line metrics—it ties spend and engagement directly to ROI. Marketers can monitor budget pacing, cost per acquisition, and return on ad spend (ROAS) with precision, enabling data-driven budget allocation and faster optimization cycles.
4. Integrated Marketing Metrics and Omnichannel Analytics
Unified platforms blend cross-channel metrics into a cohesive analytics layer. Instead of toggling between disparate reports, users see blended performance across paid, earned, and owned channels. This omnichannel view is critical for understanding the true impact of multi-touch campaigns and making strategic, data-backed decisions.
5. Automated Marketing Insights
Beyond reporting, leading platforms leverage marketing intelligence reporting and AI-powered insights. Automated data analysis highlights anomalies, surfaces optimization opportunities, and delivers actionable recommendations—often before a marketer even logs in. This accelerates time-to-insight and empowers teams to act on opportunities in real time.
In short, a unified reporting platform like TapClicks transforms fragmented marketing data into a single source of actionable truth, giving marketers the tools they need to drive smarter decisions, faster reporting, and measurable growth.
How TapClicks Analytics Dashboard Unifies Marketing Data
TapClicks stands out as a powerful multi-platform reporting software and analytics dashboard designed to bring order and clarity to the increasingly complex world of marketing data. Instead of toggling between disparate platforms or wrestling with manual exports, TapClicks automates the entire process—aggregating, normalizing, and visualizing data from over 10,000 marketing, advertising, and business sources.
The unification begins with automated data connectors that pull campaign metrics from channels like Google, Facebook, programmatic platforms, email, and more. TapClicks’ ETL/ELT pipeline not only gathers this data but also transforms and blends it, so marketers get apples-to-apples comparisons across every channel, location, or client. This normalization is especially critical for agencies managing dozens (or hundreds) of client accounts and for multi-location brands seeking a consolidated view of performance.
Once data is centralized, TapClicks’ drag-and-drop dashboards and branded reporting studio make it easy to visualize KPIs, trends, and ROI in real time. Teams can customize views for specific stakeholders—whether that’s a CMO looking at enterprise-wide spend or an account manager drilling into channel-level performance for a client. Automated, scheduled reports further streamline operations, eliminating the need for repetitive manual work.
Both agencies and brands benefit from this unified approach. Agencies leverage TapClicks to deliver transparent, on-demand reporting to clients at scale, while brands enjoy a holistic lens for budget oversight and campaign optimization. Enterprise teams often use TapClicks as their marketing data hub, feeding insights into BI tools, CRMs, or finance systems.
Crucially, TapClicks goes beyond simple dashboards. With built-in AI and automation, the platform delivers actionable insights and recommendations directly within reports—enabling faster, data-driven decision-making. For a deeper dive into how TapClicks automation for analytics and reporting transforms marketing operations, check out this detailed overview.
Visualizing Campaign Performance and ROI
The ability to clearly visualize campaign performance is at the heart of any effective multi-channel analytics dashboard. Marketers need to quickly understand which channels are driving results, how campaigns are pacing against goals, and where optimization efforts will have the greatest impact. A unified dashboard transforms raw data from disparate sources into intuitive, actionable visualizations—making performance tracking seamless and ROI measurement straightforward.
Why Campaign Visualization Matters
Without visual context, even the most robust datasets can become overwhelming or, worse, misleading. Interactive dashboards allow teams to move beyond static spreadsheets, providing dynamic charts, graphs, and heatmaps that highlight trends and anomalies at a glance. This empowers marketers to:
- Spot opportunities and issues in real time: Outliers and underperforming campaigns become immediately visible.
- Compare cross-channel performance: Visual tools make it easy to benchmark results across platforms, audiences, or locations.
- Tell a clear story: Data visualizations make it easier to communicate impact to stakeholders, clients, or executives.
Making ROI Tracking Intuitive and Actionable
A well-designed analytics dashboard doesn’t just show impressions or clicks—it connects the dots to bottom-line outcomes. With features like automated ROI tracking dashboards, marketers can see exactly how much revenue or conversions each channel, campaign, or creative is driving in real time. This level of transparency enables:
- Budget optimization: Quickly shift spend toward high-ROI campaigns or channels.
- Goal alignment: Monitor progress toward KPIs such as cost-per-acquisition or return on ad spend.
- Faster reporting cycles: Automated calculations and visual summaries cut down on manual work and errors.
Practical Tips for Customizing Performance Tracking
To maximize the value of your dashboard, consider these best practices:
- Tailor views for different users: Account managers may need client-level rollups, while CMOs want a high-level executive summary.
- Leverage filters and segmentation: Break down results by region, audience, or campaign type to surface granular insights.
- Set up automated alerts: Get notified instantly when metrics surpass or fall below set thresholds.
- Integrate qualitative notes: Annotate major campaign changes or market shifts for added context.
By leveraging the campaign visualization and ROI tracking capabilities of a robust platform like TapClicks, marketing teams can transform scattered data into a strategic asset—driving smarter decisions, faster optimizations, and measurable business outcomes.
Automated Marketing Insights: Move Faster, Optimize Smarter
Speed and accuracy are the new currency in marketing. Automated insights powered by AI and real-time data can help you leap ahead of the competition—without drowning in spreadsheets or waiting for manual analysis.
Why Automated Insights Matter
- Instant Pattern Recognition: AI agents scan campaign data across every channel—24/7.
- Proactive Alerts: Get notified immediately about performance shifts, trends, or anomalies.
- Actionable Recommendations: Receive suggestions for reallocating budget, pausing underperformers, or testing new segments—before you even log in.
How TapClicks Takes It Further
TapClicks supercharges automated insights with AI-driven engines designed for marketing teams at scale:
| Feature | What It Does | Benefit |
|---|---|---|
| SmartPilot | Real-time analysis of dashboards and campaign data | Surfaces actionable, predictive insights |
| SmartEmail | Auto-generates and distributes insight summaries to teams | Keeps everyone aligned and ready to act |
| Predictive Models | Forecasts results and recommends optimizations | Enables faster, smarter strategy shifts |
What This Means for Your Team
With TapClicks, you can:
- React in Real Time: Spot trends and make optimizations as they happen.
- Save Analyst Hours: Eliminate manual data crunching and repetitive report-building.
- Focus on What Matters: Shift resources to high-value strategy and growth initiatives.
See It in Action
Curious about how real-time automation can revolutionize your marketing ops?
Check out our guide: Unlocking Real-Time Marketing: The Power of Automated Data Collection for Brand Marketers
By embracing automated marketing insights, you turn your dashboards into more than just static reporting—they become live, intelligent engines that drive growth and efficiency for your entire organization.
Building a Single Source of Truth with Data Aggregation
In today’s marketing landscape, data is scattered across paid, owned, and earned channels—think Google Ads, Facebook, programmatic display, organic social, CRM, and more. Without a unified view, teams face an uphill battle making sense of performance, attributing ROI, or even trusting the numbers in their reports. This is where robust marketing data aggregation becomes the backbone of a single source of truth, enabling teams to make confident, data-driven decisions.
What Is Marketing Data Aggregation?
At its core, data aggregation is the process of pulling granular campaign data from multiple platforms into one central hub. But it’s not just about collecting data—it’s about aligning disparate metrics, deduplicating entries, resolving naming differences, and standardizing date ranges and currency. By aggregating and normalizing data, marketers achieve a holistic, apples-to-apples view of performance across all channels.
Steps to Centralize and Normalize Multi-Channel Metrics:
- Connect Your Data Sources: Start by linking every marketing channel—ad networks, analytics tools, CRM, and more—using pre-built connectors or flexible import options. Platforms like TapClicks offer thousands of native integrations, making this step seamless.
- Establish Data Mapping Rules: Define how metrics (e.g., “Impressions,” “Leads,” “Spend”) from each source map onto your master reporting taxonomy. This step ensures consistency and prevents confusion in roll-up dashboards.
- Automate Data Refreshes: Schedule regular imports so your dashboards are always up-to-date. Automated ETL/ELT pipelines, like those in TapClicks, minimize manual effort and reduce the risk of human error.
- Normalize and Enrich Data: Blend datasets to account for channel-specific nuances (such as attribution models or regional naming), then enrich with contextual data—like location or campaign type—for deeper analysis.
- Validate and Monitor Data Quality: Implement checks for anomalies, duplicates, and missing data. Ongoing data quality monitoring is essential to maintain trust in your reports.
Overcoming Common Data Integration Challenges:
- Disparate Data Formats: Not all platforms export metrics the same way. Rely on smart connectors and transformation tools to standardize formats.
- Data Latency: Real-time or near-real-time analytics require frequent refreshes and robust API connections.
- Scaling Complexity: As you add channels or clients, choose a platform built for scale—one that can handle thousands of reports and dashboards simultaneously.
Unifying your marketing data through aggregation isn’t just a technical upgrade; it’s a strategic imperative. By building a single source of truth, you enable cross-channel insights, unlock accurate attribution, and lay the foundation for advanced analytics, automation, and optimization.
How to Select the Right Omnichannel Analytics Solution
Choosing the ideal omnichannel analytics dashboard is a strategic decision that can make or break your marketing operations. With a crowded marketplace of tools and platforms promising unified insights, it’s crucial to cut through the noise and focus on what truly matters.
Key Criteria to Consider
-
Scalability: Will the platform reliably support your current and future data volumes? Whether you’re handling dozens or thousands of campaigns and clients, look for a solution built for high-volume reporting and analytics.
-
Connector Support: Does the dashboard integrate with the full range of marketing, advertising, and business platforms you use? Flexible connector libraries—like the 10,000+ integrations offered by TapClicks—ensure you’re not limited as your channel mix evolves.
-
Customization: Can you tailor dashboards, reports, and workflows to your team or client needs? Custom branding, report templates, and user permissions are essential for agencies and multi-brand enterprises.
-
Automated Reporting: Are report generation, scheduling, and delivery automated? This capability is a major time-saver and reduces the risk of human error.
-
Ease of Use: Is the interface intuitive for both technical and non-technical users? Usability impacts adoption and the speed at which your team can act on insights.
Unified Reporting Platform Comparison
Many platforms on the market address part of the analytics puzzle. Solutions like Funnel.io and Supermetrics excel at data extraction but require additional tools for visualization. Agency Analytics and NinjaCat are lightweight but may hit limits at scale. Salesforce Datorama offers enterprise-grade power, but often at higher complexity and cost.
What sets TapClicks apart is its rare combination of scale, flexibility, and smart automation. TapClicks supports thousands of dashboards and clients, automates the entire analytics workflow (from data ingestion to insight delivery), and includes AI-driven features like SmartEmail and predictive recommendations—capabilities that transform dashboards from passive reports into active decision-support tools.
Checklist for Evaluating a New Dashboard Solution
- Does it integrate with all your marketing, ad, and business data sources?
- Can it scale to your user and reporting needs?
- Is automated reporting (including AI-powered insights) available?
- Are dashboards and reports fully customizable and brandable?
- Is the platform easy for all stakeholders to use?
- Does it offer role-based access for security and collaboration?
- How does it handle data normalization, enrichment, and quality?
- Is onboarding and support robust and responsive?
By benchmarking potential platforms against these criteria, you’ll be equipped to select a solution that delivers unified, actionable insights—empowering your team to optimize campaigns, maximize ROI, and lead with data-driven confidence.
Next Steps: Getting Started with TapClicks Analytics Dashboard
Ready to harness the power of unified marketing insights? Deploying a multi-channel analytics dashboard like TapClicks is a transformative step toward data-driven decision-making and operational efficiency. Here’s a step-by-step guide to get you started:
1. Define Your Data Sources and Objectives
Begin by identifying all the marketing platforms, ad networks, and data sources you use—think Google Ads, Facebook, CRM systems, email platforms, and more. Clarify your reporting goals: Are you focused on client reporting, campaign optimization, or executive-level performance views? Setting clear objectives will shape your dashboard configuration and ensure you capture the right metrics from day one.
2. Connect and Aggregate Your Data
Leverage TapClicks’ extensive library of 10,000+ connectors to integrate your marketing and business platforms. Use Smart Connectors for custom data sources or proprietary systems. This automated ETL/ELT process extracts, cleans, and normalizes data, allowing you to skip manual uploads and ensure consistency across all channels.
3. Customize Dashboards and Reports
With TapClicks’ drag-and-drop dashboard builder, you can tailor reports to your audience—whether that’s internal teams, clients, or executives. Create branded dashboards, set up scheduled reporting, and select key KPIs for campaign performance, ROI, and budget pacing. TapClicks makes it easy to visualize the exact insights that matter to your business.
4. Migrate Existing Data and Historical Reports
For a seamless transition, import historical data and legacy reports into TapClicks. This centralizes your analytics and provides year-over-year comparisons and trend analysis from the start. TapClicks support and onboarding resources can help you map and validate your data during this process.
5. Train and Onboard Your Team
Successful adoption hinges on team enablement. Use TapClicks’ comprehensive training materials, live webinars, and support channels to onboard users. Assign role-based access so that marketers, analysts, and clients see only the data relevant to them—driving adoption and ensuring data security.
6. Automate and Optimize
Activate TapClicks’ AI-powered features, such as automated insights, SmartEmail, and campaign optimization recommendations. Set up alerts for performance anomalies and schedule recurring reports to stakeholders. This automation not only saves time but also uncovers optimization opportunities faster than manual analysis.
7. Commit to Continuous Improvement
A unified dashboard isn’t static—regularly review your analytics setup to ensure it evolves with your marketing strategy. Solicit feedback from users, adjust KPIs as goals shift, and take advantage of new TapClicks features to continually enhance insights and performance tracking.
Ready to Transform Your Marketing Operations?
Explore how TapClicks can help your team unify data, accelerate reporting, and unlock actionable insights at scale. Get started with TapClicks today and move confidently toward a single source of marketing truth.
Start Automating Your Marketing Data Today!
No Credit Card Required.

