

Multi-Channel Analytics Dashboard: Unified Marketing Insights
Marketers today juggle dozens of platforms, channels, and campaigns—each with its own data, KPIs, and reporting quirks. A multi-channel analytics dashboard turns this complexity into clarity, bringing all your marketing metrics, campaign insights, and performance visualizations into one unified reporting platform. With TapClicks, brands, agencies, and media companies can automate data aggregation, streamline analytics, and unlock actionable, cross-channel marketing intelligence at scale.
Demystifying the Multi-Channel Analytics Dashboard
Today’s marketers juggle a dizzying array of platforms—Google, Facebook, programmatic display, email, and more. But with data scattered everywhere, how do you see the full picture? That’s where a multi-channel analytics dashboard comes in.
What Does a Multi-Channel Analytics Dashboard Do?
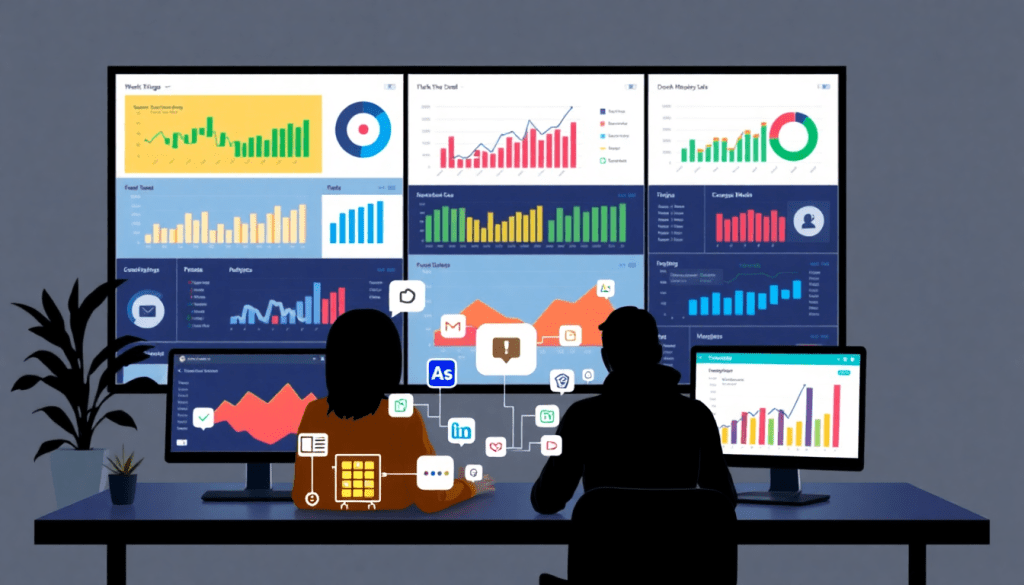
Think of it as your marketing command center. Here’s what sets it apart:
- Centralizes Data: Pulls performance metrics, KPIs, and campaign results from all your marketing channels—search, social, display, email, and beyond.
- Normalizes & Visualizes: Standardizes different data formats and visualizes results in intuitive graphs, tables, and charts.
- Empowers Analysis: Lets you compare channel performance, spot trends, and drill into the details—all in one place.
Why Unified Reporting Matters More Than Ever
Omnichannel marketing is powerful, but it’s also complex. Consider these modern challenges:
- Multiple platforms, each with unique reporting quirks
- Siloed analytics that make cross-channel comparison a headache
- Fragmented data, slowing down insight and decision-making
Without a unified dashboard, proving ROI, optimizing budgets, or even tracking campaign health becomes a major lift.
Enter TapClicks: Simplifying the Complex
TapClicks is built to tackle this exact problem. Here’s how TapClicks empowers marketing teams:
| TapClicks Advantage | What It Means for You |
|---|---|
| 10,000+ Integrations | Connect all your marketing sources—no manual work |
| Drag-and-Drop Dashboards | Instantly build custom views for clients or execs |
| AI-Powered Insights | Surface trends, anomalies, and optimization tips |
| Automated Reporting | Schedule branded reports—no more late-night crunches |
Bottom line: TapClicks turns marketing complexity into unified intelligence, so you can make smarter, faster decisions—no matter how many channels you manage.
Ready to see every channel’s impact at a glance? That’s the power of a multi-channel analytics dashboard.
Why Marketers Rely on Unified Reporting Platforms
Unified reporting platforms, like TapClicks, aren’t just about viewing data—they transform the way marketers work and deliver results. Here’s how:
Save Time, Do More
- Automate tedious tasks: No more manual data pulls or spreadsheet wrangling.
- One dashboard, all your channels: Instantly view performance across Google, Facebook, TikTok, programmatic, and more.
- Reclaim analyst hours: Free up 50+ hours per month per analyst for strategic work, not data collection.
Eliminate Costly Errors
- Consistent, up-to-date metrics: Automated pipelines reduce hand-keyed mistakes.
- Standardization: Unified metrics mean everyone speaks the same language—no more mismatched numbers across teams.
- Trust your data: Know that your reports are always accurate and audit-ready.
Make Smarter, Faster Decisions
- Spot trends in real time: Visualize all KPIs in one place.
- Optimize campaigns on the fly: Instantly diagnose issues and shift budgets for maximum ROI.
- Agile responses: React quickly to market changes with up-to-date insights.
Unlock Advanced Marketing Intelligence
| Benefit | What It Means for You |
|---|---|
| Cross-channel performance | See how campaigns work together, not in silos |
| Accurate attribution | Know exactly what’s driving conversions |
| Proof of ROI | Show stakeholders the value of every dollar |
| Transparent workflows | Simplify collaboration and reporting for teams |
For more on how automated dashboards boost agency reporting efficiency, check out this article.
Turn Analytics into a Strategic Advantage
- From chore to asset: Unified reporting transforms analytics from a time sink to your secret weapon for growth.
- Scalable success: As your campaigns and clients grow, your reporting scales—no extra effort required.
Ready to see how TapClicks can streamline your reporting? Discover more here.
How Multi-Channel Dashboards Aggregate Marketing Data
At the heart of every high-performing multi-channel analytics dashboard is a powerful data aggregation engine—one that seamlessly brings disparate marketing data together into a single, actionable view. The challenge? Marketing teams today rely on a sprawling mix of platforms: from Google Ads and Facebook to programmatic display, email, CRM, and beyond. Each platform produces its own siloed data, with unique structures, naming conventions, and reporting formats. Without automated aggregation, marketers are left piecing together spreadsheets and exporting endless CSVs—a process that’s time-consuming, error-prone, and unsustainable at scale.
This is where TapClicks sets itself apart. Leveraging automated ETL/ELT pipelines, TapClicks pulls raw marketing data from over 10,000 connectors, extracting, transforming, and loading it not just into the TapClicks platform, but also into external destinations if needed. This automated pipeline eliminates manual data pulls and ensures that every data point—impressions, clicks, conversions, budget, and more—flows in seamlessly, ready for analysis.
But aggregation is only the first step. For cross-channel analytics to be meaningful, data must be unified and normalized. TapClicks excels at this, with built-in enrichment tools that blend and standardize datasets across every channel and location. Whether you’re consolidating campaign data from dozens of clients or managing multi-location brand analytics, TapClicks ensures that metrics align, naming conventions are harmonized, and all your data “speaks the same language.” This unified foundation powers deeper analytics, enabling marketers to slice, dice, and compare performance across every channel—all from a single dashboard.
In short, TapClicks transforms multi-platform marketing chaos into integrated intelligence. By automating data aggregation and normalization, it lays the groundwork for smarter reporting, faster insights, and more confident decision-making. Discover how seamless marketing data aggregation and integration can supercharge your analytics and unlock the full value of your campaigns.
Cross-Channel Marketing Analytics: Turning Data Into Insights
In today’s fragmented digital landscape, marketers need more than just raw data—they need clarity, context, and real insights. This is where cross-channel performance tracking dashboards prove invaluable. By consolidating KPIs from every campaign, platform, and channel into a single, intuitive interface, these dashboards allow marketers to visualize the full spectrum of their marketing efforts at a glance, rather than piecing together results from siloed sources.
Performance visualization is at the core of effective cross-channel analytics. Instead of toggling between separate dashboards for search, social, display, and email, marketers can spot trends, compare metrics, and identify outliers in one unified view. TapClicks elevates this experience by layering automated marketing insights and AI-powered recommendations directly onto your dashboards. The platform’s AI agents analyze your integrated data, detecting anomalies, surfacing high-impact opportunities, and providing actionable suggestions tailored to your unique marketing mix.
These AI-enhanced analytics do more than just report what happened—they reveal why it happened and what you should do next. For example, TapClicks can automatically notify you of underperforming campaigns, recommend budget reallocations, or even benchmark your results against industry standards. This proactive intelligence transforms traditional reporting into a dynamic decision-making tool, empowering teams to move faster and optimize campaigns in real time.
For a deeper dive into how automation and AI are revolutionizing analytics and reporting, see "boosting analytics and reporting". With solutions like TapClicks, marketers can move beyond surface-level metrics and unlock actionable, cross-channel insights that drive better results across every stage of the customer journey.
ROI Tracking and Campaign Performance Visualization
A unified multi-channel analytics dashboard transforms the daunting task of ROI tracking into a streamlined, intuitive process. Instead of piecing together data from disparate sources, marketers can instantly access consolidated metrics that reveal the true impact of every campaign—across every channel. This holistic view is essential for accurate attribution, enabling you to see which touchpoints drive conversions and where budgets are delivering the highest return.
With TapClicks, ROI tracking is not only simplified but also highly customizable. Interactive dashboards present campaign performance through a variety of visualizations—charts, graphs, heatmaps, and more—tailored to your specific KPIs and business objectives. Whether you need to compare the effectiveness of paid social versus search, evaluate creative variations, or drill down into location-based performance, TapClicks provides the flexibility to visualize data in ways that make insights immediately actionable.
For agencies managing multiple clients or brands overseeing complex, omnichannel initiatives, TapClicks’ omnichannel analytics solutions deliver clarity at scale. Account managers can effortlessly segment performance by client, product line, region, or campaign, and generate presentation-ready reports in minutes. Enterprises benefit from unified dashboards that align marketing, sales, and finance teams on a single source of truth—ensuring every stakeholder understands not just what’s happening, but why.
In today’s data-driven landscape, the ability to visualize campaign performance and track ROI in real time isn’t just a convenience—it’s a competitive advantage. By leveraging a centralized platform like TapClicks, marketers can move beyond static spreadsheets and manual reporting, embracing a smarter, more proactive approach to measuring success and optimizing marketing investments. To see how unified dashboards are boosting analytics and reporting, explore the latest best practices and innovations driving marketing performance forward.
Real-Time Marketing Intelligence—No More Waiting for Insights
Today’s marketing teams can’t afford to wait days for reports or miss out on emerging trends. TapClicks transforms how agencies, brands, and enterprises access and act on marketing data—making real-time intelligence and automation the new normal.
Here’s How TapClicks Delivers Real-Time Power
1. Continuous Data Flow
- Integrates with 10,000+ marketing and business platforms
- Streams fresh data into unified dashboards, so metrics and KPIs are always up-to-date
- No more siloed spreadsheets or manual data pulls
2. AI Agents Working Behind the Scenes
- SmartPilot automatically analyzes campaign data as it arrives
- Flags anomalies and surfaces actionable recommendations instantly
- Predictive insights help you pivot before issues impact performance
3. Instant, Automated Reporting
- SmartEmail curates and delivers tailored insight summaries to stakeholders
- Keeps teams—whether managing one brand or hundreds of clients—aligned and informed
- Automated alerts for sudden spend spikes, performance drops, or budget pacing issues
What Does This Mean for Your Business?
- Faster Optimization: React to what’s happening now, not last week
- Proactive Risk Management: Get notified before small issues escalate
- Seize Opportunities: Identify and act on emerging trends, channels, or under-utilized budgets
Want to See Real-Time Marketing Automation in Action?
Check out our full guide: Unlocking Real-Time Marketing with Automated Data Collection
With TapClicks, real-time intelligence isn’t just a buzzword—it’s a built-in, scalable advantage that makes every marketing decision smarter and faster.
Choosing the Right Multi-Platform Reporting Software
Selecting the best multi-platform reporting software is critical to maximizing your marketing operations and ensuring long-term scalability. As organizations grow, so do their data needs—making it essential to choose a solution that not only unifies analytics but also adapts to increasing complexity and volume. Here’s what to look for when evaluating your options:
1. Scalability and Performance: Your dashboard should handle thousands of campaigns, clients, or locations without compromising speed. TapClicks stands out in this regard, supporting enterprise-scale deployments and high-volume reporting, where many competitors struggle to keep up.
2. Actionable AI Insights: Look for platforms that go beyond static reporting by delivering automated, AI-driven insights. TapClicks’ SmartPilot and SmartEmail features automatically analyze your data, surface trends, and generate optimization recommendations—moving from simple visualization to true marketing intelligence.
3. Flexibility and Data Integration: The best solutions offer a vast library of data connectors, seamless ETL/ELT pipelines, and the ability to blend, normalize, and export data wherever you need it. TapClicks’ unified marketing operations platform excels here, enabling you to centralize or feed cleaned data into your BI stack (like Tableau or Power BI).
4. Workflow and Collaboration: Choose software that integrates order management and workflow tools, so your analysts, sales teams, and clients can collaborate directly inside the platform. TapClicks’ built-in TapOrders and TapWorkflow modules connect reporting to campaign execution—something most dashboard tools lack.
5. Comparative Strengths: While solutions like Funnel.io, Adverity, and Agency Analytics each offer core reporting or data pipeline features, TapClicks’ unique value lies in its unified scale, AI-powered insights, and embedded workflow capabilities. This combination delivers an all-in-one experience for agencies, brands, and enterprise teams.
Tips for Evaluation:
- Prioritize platforms with proven enterprise deployments and references in your vertical.
- Assess ease of onboarding, dashboard customization, and report automation.
- Consider future needs—will the platform scale as your marketing footprint grows?
- Test AI and automation features to ensure they deliver beyond basic dashboards.
By focusing on these essential criteria—and understanding how TapClicks combines best-in-class data integration, automated insights, and workflow—you’ll be equipped to choose the right multi-channel reporting software for your marketing organization.
Getting Started with TapClicks Analytics Dashboard
Ready to simplify your marketing analytics and bring all your performance data into a single, intuitive view? Getting started with the TapClicks Analytics Dashboard is a straightforward process designed for marketers and analysts of all technical backgrounds. Here’s how to quickly unlock unified insights and put your multi-channel reporting on autopilot:
1. Connect Your Data Sources
Begin by selecting from TapClicks’ library of over 10,000 data connectors, including all major ad platforms, social channels, analytics tools, and CRM systems. With just a few clicks, you can securely link Google Ads, Facebook, LinkedIn, email platforms, and more—no coding required. For unique or proprietary data sources, TapClicks’ Smart Connectors let you easily import custom datasets, ensuring a truly comprehensive marketing view.
2. Automate Data Aggregation and Normalization
Once connected, TapClicks automatically extracts, transforms, and loads your data, blending metrics from disparate channels into a unified format. This means your dashboards will always reflect the latest campaign results, cleaned and normalized for accurate cross-channel analysis—freeing your team from tedious manual imports and error-prone spreadsheets.
3. Build and Customize Your Dashboards
TapClicks’ drag-and-drop interface makes it easy to design dashboards tailored to your needs. Whether you’re tracking performance by channel, visualizing ROI, or monitoring budget pacing, you can customize widgets, charts, and tables to highlight the KPIs that matter most to your business or your clients. Branded dashboards and automated, scheduled reports ensure stakeholders always have the insights they need—delivered in their preferred format.
4. Explore Advanced Features and AI Insights
TapClicks doesn’t stop at data visualization. Leverage AI-powered recommendations, automated insights, and proactive alerts with TapInsights and SmartEmail. These tools analyze your dashboards in real time, surfacing actionable findings and sending curated summaries to your team, so you can make smarter, faster decisions.
5. Take the Next Step
To experience the full potential of automated, integrated reporting, explore our comprehensive guide on automated marketing dashboards. Ready to see TapClicks in action? Visit the TapClicks website to request a personalized demo, or reach out to our team for a tailored walkthrough based on your unique marketing challenges.
With TapClicks, unified analytics isn’t just possible—it’s easy, scalable, and transformative. Start connecting your data, customizing your dashboards, and unlocking deeper marketing intelligence today.
Start Automating Your Marketing Data Today!
No Credit Card Required.

