

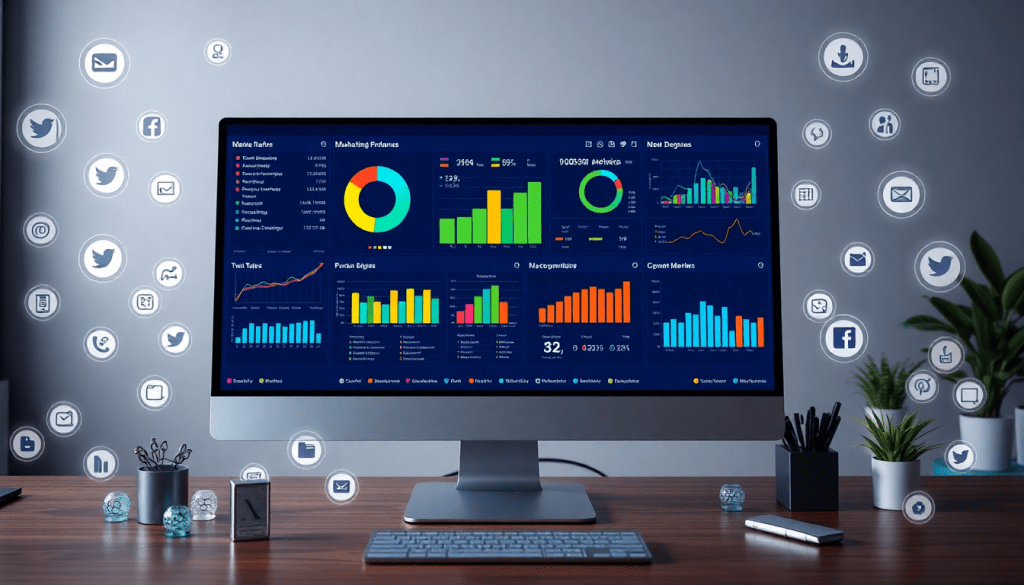
Multi-Channel Analytics Dashboard: Unified Insights for Marketers
Today’s marketing leaders need more than siloed data—they need a complete, unified view of campaign performance across every channel, platform, and audience segment. Multi-channel analytics dashboards bring together fragmented marketing data into a single, actionable hub. This guide covers the essential features, strategic advantages, and real-world uses of a unified reporting platform like the TapClicks analytics dashboard. Learn how automated marketing insights, integrated metrics, and cross-channel reporting drive smarter decisions and measurable ROI.
What Is a Multi-Channel Analytics Dashboard?
A multi-channel analytics dashboard is a centralized platform that aggregates, visualizes, and tracks marketing performance data from multiple channels—such as social media, search, display, email, and more—into a single, unified interface. For today’s marketers, whose campaigns span dozens of platforms and touchpoints, having a holistic view is no longer a luxury; it’s essential for making timely, data-driven decisions that drive ROI.
Unlike single-channel analytics, which provide siloed metrics limited to one platform (think only Facebook Ads or Google Analytics), a multi-channel dashboard offers cross-channel visibility. This means marketers can spot patterns, measure true attribution, and optimize spend across their entire marketing ecosystem, not just in isolated pockets. For example, tracking conversions that start with a paid search click and finish with a retargeting ad on social becomes simple and actionable.
The three core goals of a multi-channel analytics dashboard are:
- Data Aggregation: Seamlessly pull in data from all your marketing sources—ad platforms, CRMs, web analytics, and more—so nothing gets missed.
- Unified Reporting: Present integrated metrics in a single source of truth, eliminating the confusion of conflicting or duplicate reports.
- Performance Tracking: Enable real-time monitoring and historical analysis that reveals what’s working, what isn’t, and where to optimize.
Platforms like the TapClicks analytics dashboard are designed specifically to deliver these capabilities at scale. TapClicks stands out by connecting to thousands of marketing and business data sources, automating data transformation and visualization, and providing both granular and high-level performance insights—all in one place. With a unified reporting platform, marketers can finally move beyond spreadsheets and fragmented analytics to achieve a truly strategic, omnichannel approach.
What Makes a Unified Marketing Reporting Platform Truly Powerful?
A next-generation marketing reporting platform is much more than a fancy spreadsheet or a static set of charts. It’s your control center for real-time, data-driven decision making across every channel—connecting the dots between campaign performance, ROI, and strategy. Here’s what sets advanced solutions like the TapClicks analytics dashboard apart:
Connect All Your Data—Automatically
- No more manual data pulls: Connect to thousands of sources (Google Ads, Facebook, LinkedIn, TikTok, and beyond) with a few clicks.
- Always up to date: Automated aggregation means your dashboards reflect the freshest campaign metrics—no waiting, no errors.
See Results in Real Time
- Instant insights: Live dashboards visualize performance as it happens.
- Spot trends and act fast: Custom widgets and charts turn raw numbers into actionable, at-a-glance intelligence.
Track ROI Across Every Platform
- Cross-channel clarity: Blend data from all your channels to track ROI for campaigns, platforms, or entire client portfolios.
- Ideal for agencies and brands: Manage multi-account, multi-location, or multi-brand reporting in one hub.
Integrate Seamlessly with Your Marketing Stack
- 10,000+ data connectors: Ingest data from ad servers, social networks, CRMs, analytics suites, and more.
- End data silos: A single source of truth that unifies your marketing ecosystem.
Make Dashboards Work for Every Stakeholder
- Fully customizable: Create views and reports tailored for executives, analysts, clients, or partners.
- Automated, AI-powered insights: Let the platform surface top-performing assets, flag underperformers, and even deliver proactive recommendations—no manual digging required.
Quick Comparison Table
| Feature | TapClicks Advantage | Why It Matters |
|---|---|---|
| Data Integration | 10,000+ connectors, automated | No manual data wrangling |
| Real-Time Visualization | Live dashboards | Immediate trend detection |
| Cross-Channel ROI Tracking | Multi-platform, multi-client | True ROI, no siloed reporting |
| Custom Dashboards & AI Insights | Role-based, auto-generated | Relevant, actionable intelligence |
| Ecosystem Integration | Ad, social, CRM, analytics | One platform for all your data |
Why This Matters for Marketers
By replacing fragmented, manual reporting with a unified analytics platform, marketers gain:
- Faster, sharper insights
- Improved collaboration between teams
- Clear, measurable performance gains
Curious about the impact for agencies? Check out how dashboard automation boosts agency reporting efficiency.
When your reporting platform does the heavy lifting, your team is free to focus on what matters most: strategy, creativity, and delivering results.
How Cross-Channel Marketing Analytics Supercharge Your Team
Bringing all your marketing data into a single, unified dashboard isn’t just a “nice-to-have”—it’s a game changer for agencies, brands, and enterprise teams alike. Let’s break down how cross-channel analytics reshape your workflow and boost your results.
No More Siloed Reporting
Instead of juggling logins and spreadsheets for every campaign channel, imagine working from a single, comprehensive interface. Here’s what you get:
- Holistic performance views: Instantly compare search, social, display, email, and more—all side by side.
- Faster insights: Spot what’s working and what’s not across campaigns without switching tabs or consolidating files.
- Smarter optimization: Identify cross-channel trends and act quickly, rather than relying on fragmented data.
Automation That Saves You Hours
Manual reporting is a thing of the past with platforms like TapClicks. Here’s how automation transforms your workflow:
- 1. Automated data pulls: Schedule routine imports from every major ad and analytics platform.
- 2. Data normalization: Clean and blend multi-source data with no manual wrangling.
- 3. Branded, scheduled reports: Generate and send client-ready dashboards automatically.
Fact: Analytics reporting automation benefits can save dozens of hours per analyst each month—freeing up your team for strategy, not spreadsheets.
Better Campaign Optimization & Budgeting
Unified dashboards put all your KPIs in context, making it easy to:
- Spot high- and low-performing channels at a glance.
- Quickly reallocate budgets for maximum ROI.
- Correlate actions: E.g., see how a spike in social engagement impacts paid search conversions.
| Traditional Approach | With Cross-Channel Analytics |
|---|---|
| Siloed channel reports | Unified, holistic dashboards |
| Manual data wrangling | Automated data blending |
| Slow, reactive optimization | Real-time, agile decision-making |
Unlocking True Marketing Intelligence
With omnichannel analytics, your team can:
- Uncover hidden trends across platforms.
- Understand audience behavior at every stage of the funnel.
- Surface actionable insights—not just raw metrics.
By leveraging a solution like the TapClicks analytics dashboard, you turn your data into a strategic advantage. The result? Measurable improvements in efficiency, campaign performance, and ROI—empowering your marketing team to focus on what they do best.
Building and Customizing Your Performance Tracking Dashboard
Setting up a multi-channel analytics dashboard is the foundation for actionable, data-driven marketing. The process begins with selecting the right channels—such as paid search, social media, email, and display advertising—that align with your business goals. Platforms like TapClicks make it simple to integrate these diverse data sources, thanks to their library of 10,000+ connectors spanning major ad networks, social platforms, and analytics tools. Once connected, your marketing data flows into a centralized hub, eliminating manual data pulls and ensuring every metric is up to date.
When it comes to dashboard customization, one size never fits all. Different stakeholders require tailored views: executives may want high-level KPIs and ROI summaries, while digital marketing teams need granular, channel-specific insights. TapClicks allows users to build role-based dashboards, customizing layouts, widgets, and visualization types for each audience. This flexibility ensures everyone—from agency clients to in-house marketing teams—gets the information they need, in the format they prefer.
Best practices for effective dashboard design start with clear goal-setting. Identify the KPIs that matter most—such as cost per acquisition, return on ad spend, or channel attribution—and prioritize them in your layout. Use automated data blending tools to create integrated metrics that reflect true cross-channel performance, breaking down silos and revealing the bigger picture. Visual elements like trend lines, heatmaps, and conversion funnels make it easy to spot patterns, anomalies, and opportunities at a glance.
TapClicks streamlines the entire dashboard creation process with intuitive drag-and-drop functionality, pre-built templates, and automated report scheduling. This means marketers can launch fully customized performance dashboards in minutes—freeing up valuable time to focus on strategy and optimization rather than repetitive reporting tasks. To see how a unified approach accelerates setup and improves analytics, explore the TapClicks analytics dashboard and discover how effortless multi-channel tracking can be.
Automated Marketing Insights and Intelligence Reporting
Traditional analytics dashboards often require marketers to sift through endless spreadsheets and siloed reports, searching for meaningful patterns. In contrast, modern multi-channel dashboards powered by AI and automation transform raw, cross-platform data into actionable insights—without the manual effort. This is where platforms like TapClicks excel, leveraging intelligent algorithms to reveal what’s working, what isn’t, and where opportunities lie.
AI-driven features such as predictive analytics and anomaly detection proactively monitor campaign data across channels, flagging unusual trends and surfacing high-impact recommendations. Whether it’s identifying sudden spikes in cost per acquisition, forecasting which channels will drive the highest ROI, or suggesting budget reallocations, these smart capabilities enable marketers to react in real time and make data-backed decisions faster.
Automated reporting further amplifies this intelligence by delivering recurring, up-to-date insights directly to stakeholders—eliminating the time-consuming process of manual report creation. With tools like TapClicks SmartEmail and customizable dashboards, stakeholders receive timely, relevant performance summaries and recommendations tailored to their needs.
By turning complex data into clear, actionable intelligence, automated insight generation empowers marketing teams to focus less on reporting logistics and more on strategic optimization. For a deeper look at how dashboard automation streamlines analytics reporting and enhances marketing intelligence, see this detailed guide on how dashboard automation streamlines analytics reporting.
Real-World Use Cases: From Agencies to Enterprise Brands
Unified multi-channel analytics dashboards aren’t just a theoretical advantage—they’re transforming the day-to-day operations of agencies, media companies, and enterprise brands. Here’s how organizations across the marketing landscape are leveraging platforms like the TapClicks analytics dashboard for smarter reporting, greater transparency, and measurable business results.
Agencies: Multi-Client Reporting and ROI at Scale
For agencies managing dozens—or even hundreds—of clients, reporting can quickly become an operational bottleneck. By centralizing data from paid search, social, display, and offline channels, a unified dashboard lets agencies automate the entire reporting lifecycle. For example, a full-service digital agency can use TapClicks to:
- Pull campaign data from Google Ads, Facebook, LinkedIn, and programmatic platforms into a single dashboard.
- Build branded, client-specific reports that update automatically.
- Surface cross-channel ROI and attribution insights for each client, enabling transparent conversations about performance and budget allocation.
With dashboard automation boosting agency reporting efficiency, account teams save hours every week—freeing up time for higher-value strategic work instead of manual data wrangling.
In-House Marketing Teams: Budget Oversight and Performance Optimization
Enterprise and multi-location brands face a different challenge: ensuring marketing dollars are spent effectively across regions, product lines, or business units. TapClicks’ unified analytics allows in-house teams to:
- Visualize spend and performance trends across every market, down to individual locations or campaigns.
- Track KPIs, such as cost per lead or return on ad spend, side-by-side across all channels.
- Enable role-based access for regional managers, giving each stakeholder the right level of insight.
This centralized visibility empowers marketing leaders to quickly spot underperforming channels, shift budgets proactively, and justify spend with clear, consolidated reporting.
Case Study: Measurable Marketing Improvements with TapClicks
Consider a national retail chain that adopted TapClicks to unify analytics for its 200+ locations. Before TapClicks, the marketing team spent over 60 hours per month manually compiling reports from disparate ad platforms. After implementation, automated data integration and reporting reduced this workload by over 80%. The team not only gained back valuable time, but also discovered new optimization opportunities—such as reallocating spend from lower-performing social campaigns to high-ROI search ads—thanks to TapClicks’ actionable cross-channel insights.
Whether it’s agency teams delivering client-ready ROI analysis in minutes, or enterprise brands mastering multi-location reporting, unified analytics dashboards are driving efficiency and better outcomes across the marketing spectrum.
Choosing the Right Omnichannel Analytics Solution
Selecting the ideal multi-channel analytics dashboard is a pivotal decision for any marketing team aiming to streamline reporting, optimize campaigns, and drive ROI. With a crowded landscape of platforms, it’s essential to weigh key criteria that ensure both immediate and long-term value.
Key Criteria for Selecting a Multi-Platform Reporting Solution:
-
Scalability: Your platform must handle current needs—and future growth. Look for solutions designed to manage thousands of dashboards, clients, and campaigns simultaneously. This is especially vital for agencies with expanding client rosters or brands with multi-location operations.
-
Integrations: Seamless connections to major ad networks, social platforms, analytics tools, and custom data sources are a must. The best platforms offer extensive connector libraries (like TapClicks’ 10,000+ integrations), enabling true cross-channel visibility without manual data wrangling.
-
Automation: Automate repetitive tasks such as data pulls, report generation, and insights delivery. Automation saves time, reduces errors, and accelerates reporting cycles, freeing your team to focus on strategy and optimization.
-
Support & Training: Responsive support, onboarding, and ongoing training resources help your team maximize platform value and adapt as your needs evolve.
-
Cost: Evaluate total cost—including licensing, onboarding, and potential add-ons—against the time and efficiency gains delivered by the platform.
TapClicks vs. Leading Alternatives
While many platforms—such as Funnel.io, Adverity, Agency Analytics, Datorama, and Supermetrics—offer strong data integration or reporting features, TapClicks stands out for its unified scale, advanced AI insights, and built-in workflow capabilities. Where lighter-weight tools focus primarily on basic dashboards or data piping, TapClicks delivers a true marketing operations platform, unifying analytics, order management, and collaboration in one system.
- Scale: TapClicks is designed to support high-volume agencies and enterprise teams, not just small-scale deployments.
- AI & Insights: TapClicks’ AI-powered insights and SmartEmail deliver proactive, actionable intelligence, not just raw data.
- Workflow Integration: Centralized order management and cross-team collaboration tools are built-in—unique among most reporting solutions.
- Flexibility: Use TapClicks as your single source of marketing truth or as a data hub feeding into existing BI tools (like Tableau, Power BI, or Looker).
Omnichannel Analytics Platform Evaluation Checklist:
- Can it integrate all your key marketing and advertising data sources?
- Does it automate data refreshes, report generation, and insights delivery?
- Is it scalable for your current and future reporting needs?
- Does it offer customizable dashboards and role-based access for different stakeholders?
- Are AI-driven insights and recommendations included?
- Does it support workflow automation (orders, approvals, collaboration)?
- Is onboarding, support, and ongoing training available?
- Does the cost align with your expected efficiency gains and business goals?
The right omnichannel analytics solution should empower your team to act on unified data, not just visualize it. As you evaluate your options, be sure to consider how platforms like TapClicks can deliver not just reporting, but true marketing intelligence at scale.
Getting Started with TapClicks Analytics Dashboard
Implementing a unified analytics dashboard doesn’t have to be complex—especially with a platform purpose-built for marketers at scale like TapClicks. Here’s a straightforward roadmap to launch your own TapClicks analytics dashboard and start unlocking actionable insights:
1. Define Your Measurement Goals:
Begin by identifying the core KPIs, marketing channels, and business objectives you want your dashboard to track. Whether you’re focused on lead generation, campaign ROI, or cross-channel attribution, clarity at this stage sets the foundation for meaningful analytics.
2. Connect Your Marketing Data Sources:
Leverage TapClicks’ vast library of over 10,000 integrations—from Google Ads, Facebook, and LinkedIn to programmatic, CRM, and web analytics platforms. With just a few clicks, you can automatically ingest, blend, and normalize data across every touchpoint, eliminating manual exports and data wrangling.
3. Customize Your Dashboards:
Use TapClicks’ intuitive drag-and-drop interface to build dashboards tailored for each audience—executives, clients, or internal teams. Create real-time visualizations, configure automated reports, and design branded dashboards that spotlight the metrics that matter most.
4. Automate Insights and Reporting:
Tap into AI-powered features like SmartPilot and SmartEmail to surface actionable insights, detect anomalies, and receive automated performance summaries. Schedule recurring reports to keep stakeholders informed—no more chasing down data or building presentations by hand.
5. Monitor, Optimize, and Iterate:
With your dashboards live, continuously monitor performance and leverage TapClicks’ analytics and recommendations to optimize campaigns, reallocate budget, and identify new opportunities. Use the platform’s flexible reporting to adapt as your marketing strategy evolves.
Ready to see unified analytics in action? Request a personalized demo or consultation with a TapClicks expert. With TapClicks as your marketing operations platform, you can streamline reporting, drive smarter decisions, and maximize your marketing ROI—all from a single, scalable hub.
Start Automating Your Marketing Data Today!
No Credit Card Required.

