

Multi-Channel Analytics Dashboard: TapClicks Unified Reporting
Modern marketing teams juggle a dizzying array of platforms, channels, and data streams. Staying on top of performance—and extracting actionable insights—requires more than just spreadsheets and siloed dashboards. TapClicks offers a comprehensive multi-channel analytics dashboard that brings together all your marketing metrics, automates reporting, and empowers you to visualize campaign effectiveness from every angle. Whether you manage dozens of client accounts or need to unify omnichannel analytics for a large brand, TapClicks streamlines cross-channel marketing analytics and gives you a single source of truth for smarter, faster decisions.
What is a Multi-Channel Analytics Dashboard?
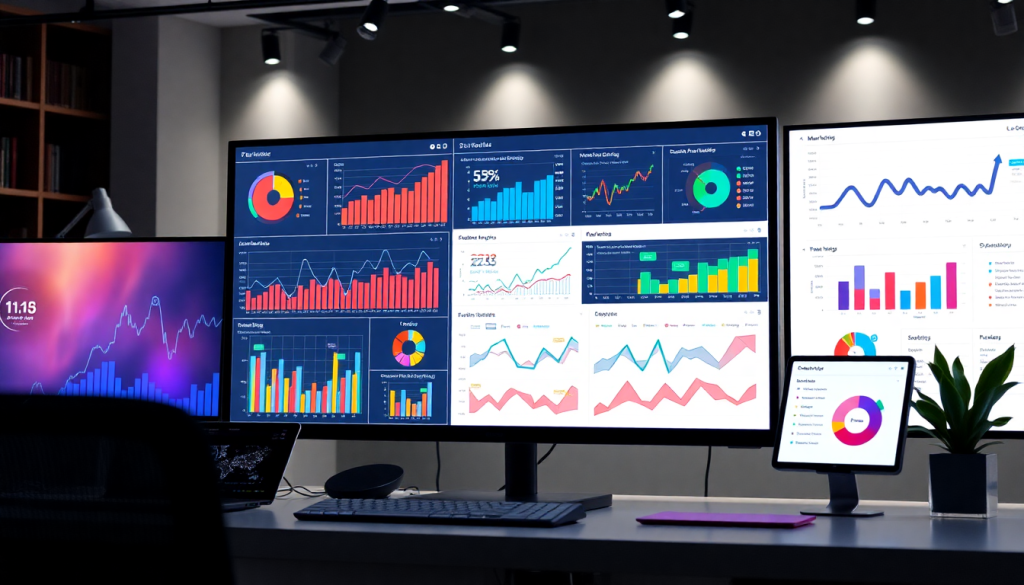
A multi-channel analytics dashboard is a centralized platform designed to aggregate, unify, and visualize marketing data from all your channels—search, social, display, email, video, and more. Rather than toggling between siloed dashboards or wrangling spreadsheets from multiple ad platforms, a true multi-channel dashboard consolidates these disparate data sources into a single, intuitive interface. This enables marketing teams to monitor holistic performance, measure cross-channel impact, and quickly surface trends or anomalies that may otherwise go unnoticed.
Unified reporting is critical in today’s marketing landscape, where campaigns span dozens of touchpoints and customer journeys rarely follow a straight line. Fragmented data leads to missed insights, reporting delays, and an incomplete view of ROI. By contrast, a multi-channel analytics dashboard provides a single source of truth—making it easier to optimize spend, justify budgets, and demonstrate value to stakeholders or clients.
TapClicks stands out as a leading multi-channel analytics dashboard because it goes beyond mere data aggregation. With over 10,000 pre-built data connectors, automated ETL pipelines, and robust visualization tools, TapClicks empowers agencies and brands to streamline reporting, customize dashboards for any audience, and even leverage AI-powered insights for smarter decision-making. It’s a unified platform built for scale, flexibility, and actionable intelligence—whether you’re managing dozens of clients or orchestrating campaigns across hundreds of locations.
To see how automating your dashboard can unlock new efficiencies, check out How Dashboard Automation Boosts Agency Reporting Efficiency.
Why Unified Reporting Matters for Cross-Channel Marketing Analytics
Modern marketers face a data paradox: information is everywhere, but actionable insight is harder to find. Here’s why unified reporting is a game-changer for agencies and brands juggling multiple platforms and campaigns.
The Problem: Fragmented Data, Fragmented Insights
Common challenges:
- Siloed platforms: Each tool (Google Ads, Facebook, programmatic, email, etc.) reports in its own language.
- Manual headaches: Teams waste hours gathering data, reconciling spreadsheets, and chasing down metrics.
- Inconsistent reporting: Different formats and timeframes make “apples to apples” comparisons nearly impossible.
- Missed opportunities: Without a comprehensive view, optimization and ROI tracking suffer.
The Solution: One Dashboard to Rule Them All
A unified reporting platform—like TapClicks—brings everything together:
- Aggregate Every Channel: Connect Google Ads, Facebook, email, programmatic, and 10,000+ others in one place.
- Centralized Dashboards: See all your KPIs and campaign data side-by-side, updated in real time.
- Consistent, Client-Ready Reports: No more manual number crunching or last-minute spreadsheet fixes.
- Holistic Campaign Visibility: Instantly compare performance, track budgets, and spot cross-channel trends.
How Unified Reporting Transforms Your Workflow
| Challenge | With Unified Reporting (TapClicks) |
|---|---|
| Data Silos | All channels in one dashboard |
| Manual Data Handling | Automated data pulls and report generation |
| Inconsistent Metrics | Standardized, apples-to-apples comparisons |
| Slow Response to Trends | Real-time, actionable insights |
| Difficulty Proving ROI | Transparent, up-to-date ROI tracking |
What This Means in Practice
- For Agencies:
Quickly deliver comprehensive reports to hundreds of clients without the reporting scramble. - For Brands:
Get a full, omnichannel picture—track media spend, performance, and budget pacing at a glance. - For Everyone:
More time for strategy, less time wrangling data. Leadership can trust the numbers and make decisions faster.
Deeper Insights, Smarter Marketing
“Automated unified reporting not only increases efficiency but also unlocks deeper marketing intelligence—fueling smarter investments and higher returns.”
— "Boost Analytics Reporting with Automation"
TapClicks: Turning Complexity into Competitive Advantage
With TapClicks, you can:
- Eliminate silos and unify analytics across all channels
- Empower every stakeholder with real-time, transparent data
- Move from manual reporting to actionable insights—at scale
Bottom line: Unified reporting isn’t just about convenience. It’s about unlocking agility, visibility, and marketing results you can prove.
Why Marketers Love the TapClicks Analytics Dashboard
TapClicks isn’t just a dashboard—it’s the command center for unified, automated, and action-ready marketing analytics. Here’s how TapClicks turns data overload into clarity (and time savings):
Effortless Data Aggregation
- Connect to Everything:
- 10,000+ marketing, advertising, and business data connectors.
- Pull in data from major ad networks, social, search, martech platforms, your CRM, web analytics, and more.
- One Dashboard, All Your Metrics:
- Centralize campaign data—no matter how many channels, locations, or clients you manage.
Visualize Performance Instantly
- No More Manual Spreadsheets:
- Drag-and-drop dashboard builder.
- Custom visualizations for KPIs, performance comparisons, and trend spotting.
- Always Up-to-Date:
- Dashboards auto-refresh as new data flows in—so you’re never stuck with last week’s numbers.
AI-Powered Insights, Not Just Reports
- SmartPilot and AI Agents:
- Automatically analyze your data to surface actionable insights and highlight anomalies.
- Get AI-generated summaries and recommendations, ready to share with your team or clients.
- Stop Sifting, Start Optimizing:
- Insights are delivered in plain English—not just raw numbers.
End-to-End ROI Tracking
- Unified ROI Dashboards:
- Blend and normalize data from every channel.
- Track spend, conversions, and results in a single view.
- Full-Funnel Clarity:
- Drill down from high-level campaign overviews to channel, ad group, or creative-level detail.
Automated, Branded Reporting at Scale
- Set It and Forget It:
- Schedule recurring reports for any cadence—daily, weekly, monthly.
- Professional, Consistent Look:
- Branded templates for client-facing presentations.
- Tailor reports by stakeholder or business unit with a few clicks.
Built for Agencies and Enterprise Scale
| TapClicks Advantage | How It Helps |
|---|---|
| Multi-Client Management | Handle hundreds (or thousands) of client dashboards |
| Omnichannel Oversight | Track every campaign across locations/business units |
| Role-Based Access | Collaborate seamlessly across teams and departments |
Why It Matters
With TapClicks, marketers move from data chaos to unified analytics—saving hours, impressing clients, and making smarter decisions faster.
Ready to see what unified analytics can do for your team? Learn more about TapClicks.
Automated Marketing Insights: Getting Beyond the Numbers
Traditional marketing dashboards often stop at presenting data—a parade of graphs and charts that summarize what happened, but not why it happened or what to do next. TapClicks transforms this paradigm by weaving AI and automation into every layer of its analytics dashboard, empowering marketing teams to move from data observation to actionable decision-making.
At the heart of this capability is TapClicks’ SmartPilot, an AI-driven engine designed to do the heavy lifting of analysis for you. Rather than spending hours sifting through spreadsheets or toggling between platforms, SmartPilot automatically scans your dashboards and datasets to surface key insights—whether that’s identifying underperforming campaigns, spotting emerging trends, or highlighting budget pacing anomalies. These proactive recommendations aren’t generic; they’re tailored to your specific goals, channels, and KPIs, so teams can pivot with confidence and optimize campaigns in real time.
TapClicks also leverages automated alerts and predictive models to keep your team ahead of the curve. Imagine receiving an email summary of campaign insights before your morning meeting, complete with AI-curated optimization suggestions and early warnings for campaigns that need immediate attention. With features like SmartEmail, TapClicks delivers these insights directly to your inbox or your clients’, streamlining communication and ensuring that no critical trend goes unnoticed.
The result? Marketers spend less time wrangling data and more time acting on it—improving ROI, reducing wasted spend, and continuously refining strategy. By embedding intelligent automation and insight generation into the core of its platform, TapClicks ensures that your multi-channel analytics dashboard is not just a passive reporting tool, but an active driver of marketing success. To see how automation is revolutionizing analytics, check out "Boost Analytics Reporting with Automation".
Campaign Performance Visualization: Making Data Instantly Understandable
Making sense of marketing data shouldn’t require a data science degree. TapClicks is designed to take the guesswork out of campaign performance—turning raw numbers into clear, actionable insights through intuitive visualization.
Personalize Dashboards for Every Role
With TapClicks, dashboards are never generic. Instead, you can:
- Build custom dashboards with a drag-and-drop interface—no coding required.
- Tailor layouts for each client, campaign, or exec—spotlighting just the KPIs that matter.
- Mix and match widgets to show:
- Channel-level performance (search, social, display, etc.)
- Budget pacing and spend vs. plan
- Creative asset performance
- Conversion funnels and lead flows
Who benefits?
- Agencies: Monitor hundreds of client accounts at a glance.
- Brands: Keep an eye on omnichannel efforts across multiple regions or business units.
Turn Data Into a Visual Story
TapClicks doesn’t just show you the numbers—it reveals the story behind them. Here’s how:
- Interactive charts: Instantly spot spikes, dips, and seasonal trends.
- Heatmaps: Visualize performance by region or demographic.
- Time-series graphs: Analyze campaign lift and performance over time.
- Quick filters: Drill into data by timeframe, channel, or audience segment.
This means you can quickly answer questions like:
- Which channel is outperforming this month?
- Where are we seeing the highest conversions?
- Are there emerging trends we need to act on?
Effortless Sharing and Real-Time Collaboration
Making insights accessible is core to TapClicks. Teams can:
- Export branded reports—ready for clients or execs.
- Share live dashboard links for real-time, interactive access.
- Schedule automated email summaries (say goodbye to manual screenshots).
Stakeholders can:
- Drill down from high-level metrics into campaign specifics.
- Stay engaged with always-up-to-date data—no version confusion.
Clear, Unified Multi-Platform Reporting
Juggling data from dozens of platforms? TapClicks brings it all together:
| Challenge | TapClicks Solution |
|---|---|
| Disparate data in silos | Unified, normalized metrics |
| Clunky spreadsheet consolidation | Visual cross-channel dashboards |
| Difficult trend spotting | At-a-glance patterns & anomalies |
The result? Less time wrangling data, more time optimizing campaigns.
Ready to see how TapClicks can transform your reporting and campaign analysis? Explore the TapClicks platform and discover just how simple—and insightful—performance visualization can be.
ROI Tracking and Integrated Marketing Intelligence Reporting
One of the core challenges in modern marketing is accurately tracking return on investment (ROI) across a growing array of channels. With TapClicks, marketers gain a true end-to-end ROI tracking solution that consolidates performance data—from search and social to display, email, and offline channels—into a single, unified view. This omnichannel visibility is crucial for understanding exactly which tactics are driving business results, helping both agencies and brands make data-backed budget decisions with confidence.
TapClicks stands apart by offering seamless integration capabilities, not only within its platform but also across your broader analytics ecosystem. With over 10,000 built-in data connectors and powerful Smart Connectors, TapClicks automates the extraction, transformation, and loading (ETL) of marketing data. This ensures that ROI calculations are always based on the freshest, most reliable information. Even more, TapClicks supports exporting cleaned and normalized data into popular business intelligence (BI) tools like Tableau, Power BI, and Looker—enabling advanced analysis and reporting within existing analytics stacks.
But TapClicks goes further than just consolidating metrics. Its analytics dashboard delivers integrated marketing intelligence reporting, blending campaign data, spend, attribution, and conversion outcomes into easy-to-understand dashboards. With customizable widgets, marketers can visualize ROI by channel, campaign, region, or client, spotting trends and performance gaps in real time.
This unified approach empowers marketing teams to move beyond simple reporting, enabling long-term intelligence gathering and continuous campaign optimization. Whether you’re running hundreds of client accounts as an agency or managing complex, multi-location campaigns for a major brand, TapClicks ensures your ROI tracking is comprehensive, automated, and actionable. Learn more about how TapClicks delivers integrated analytics and marketing intelligence at tapclicks.com.
How TapClicks Streamlines Agency and Brand Workflows
In today’s fast-paced marketing environment, efficiency isn’t a luxury—it’s a necessity. TapClicks’ unique approach to workflow automation transforms how agencies and brands manage their day-to-day operations, campaign execution, and client communications. By centralizing every step from order intake to reporting, TapClicks eliminates manual bottlenecks and reduces the risk of costly errors.
Workflow Automation, From Start to Finish
TapClicks’ workflow automation tools are designed to streamline the entire marketing operations lifecycle. Campaign orders can be submitted, tracked, and managed from a single platform, ensuring that every stakeholder—from sales to operations to fulfillment—stays in sync. With role-based access controls, agencies can give clients and team members just the right level of visibility, fostering secure collaboration without sacrificing control.
Collaboration and Time Savings for Agencies and Brands
For agencies juggling hundreds of client accounts, TapClicks’ centralized dashboard means no more hopping between spreadsheets and disconnected tools. Routine reporting tasks are automated, dramatically slashing the hours spent on manual data pulls and repetitive updates. For example, a mid-sized agency saw reporting workload drop by over 50 hours per analyst each month after switching to TapClicks. Brands benefit as well: with unified data and streamlined workflows, marketing teams can focus on campaign strategy rather than chasing down performance metrics or reconciling disparate reports.
Reducing Errors, Enhancing Client Service
Automated processes not only save time—they also reduce the risk of human error. Scheduled, branded reports are generated and delivered automatically, ensuring consistency and professionalism across every client interaction. Plus, with built-in collaboration tools, feedback and approvals move faster, leading to quicker turnaround times and happier stakeholders.
To see more on how TapClicks transforms reporting and workflow for agencies and brands, check out "Boost Reporting with TapClicks".
By uniting campaign management, collaboration, and reporting in a single platform, TapClicks empowers marketing organizations to work smarter—not harder—while delivering more value to their clients and stakeholders.
Getting Started with TapClicks: Next Steps and Best Practices
Ready to centralize your marketing data and unlock smarter insights? Getting started with TapClicks is designed to be seamless, whether you’re an agency reporting for hundreds of clients or a brand unifying analytics across multiple locations. Here are the practical steps and best practices to set up your multi-channel analytics dashboard for success:
1. Map Out Your Data Sources
Begin by listing all marketing, advertising, and business platforms you use—everything from Google Ads and Facebook to programmatic platforms and CRM systems. TapClicks supports over 10,000 connectors, so you’ll likely find native integrations for nearly every channel.
2. Streamline Data Integration
Leverage TapClicks’ automated ETL/ELT pipelines to extract, transform, and load your campaign data. Use Smart Connectors to blend and normalize datasets, ensuring cross-channel consistency. This step lays the groundwork for accurate, unified reporting and eliminates manual data wrangling.
3. Customize Your Dashboards
TapClicks offers a drag-and-drop reporting studio, allowing you to build dashboards tailored to your goals—whether that’s tracking ROI, visualizing budget pacing, or monitoring campaign health across clients and channels. Utilize customizable widgets and branded themes to match your agency or brand identity.
4. Automate Reporting and Insights Delivery
Set up scheduled reports for internal teams or clients. With AI-powered features like SmartPilot and SmartEmail, TapClicks can automatically generate insight summaries and deliver them to stakeholders, keeping your team and clients informed without added manual effort.
5. Leverage Onboarding and Support Resources
TapClicks provides robust onboarding support, including personalized training, documentation, and a responsive support team. Take advantage of these resources to accelerate adoption and maximize the platform’s value.
6. Explore Customization and Integration Options
Whether you need to integrate TapClicks with your BI stack (e.g., Tableau, Power BI) or customize workflows to match your internal processes, the platform offers flexibility to adapt to your unique needs.
Take the Next Step
Curious how TapClicks can transform your marketing analytics? Start by exploring a demo or free trial to see the unified dashboard in action. With the right setup and support, your team can move from fragmented reporting to data-driven, omnichannel marketing intelligence—faster and more confidently than ever before.
Start Automating Your Marketing Data Today!
No Credit Card Required.

