

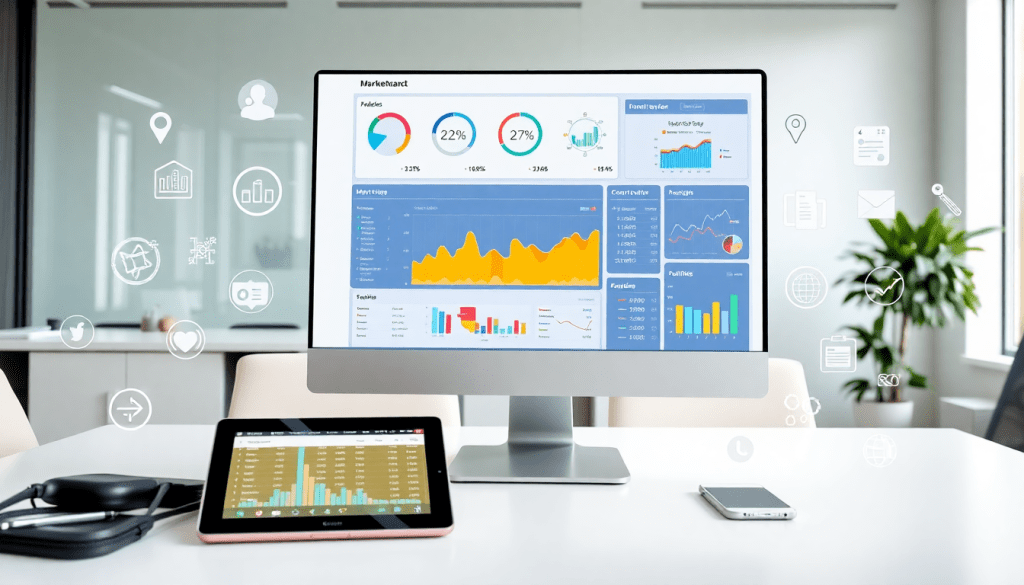
Marketing Dashboard Automation: Real-Time Analytics Made Easy
Manual reporting is a time sink for marketing teams—especially when data lives in different platforms and stakeholders want answers now. Marketing dashboard automation solves this by pulling together real-time analytics, cross-channel data, and campaign results in a single, customizable view. With platforms like the TapClicks marketing dashboard, teams can automate reporting workflows, create AI-powered dashboards, and centralize data for faster, more accurate insights. This guide covers how dashboard automation works, why it matters, and how to choose the right solution for your marketing operations.
What is Marketing Dashboard Automation?
Marketing dashboard automation is the process of using technology to automatically collect, unify, visualize, and report on marketing data across channels—all within a single, customizable dashboard. Unlike traditional manual dashboard building, where teams spend hours downloading spreadsheets, formatting charts, and piecing together performance metrics, automated dashboards streamline the entire process from data integration to insight delivery.
At its core, marketing dashboard automation combines several key components:
- Automated Data Integration: Seamlessly pulls data from multiple marketing, advertising, and business platforms (such as Google Ads, Facebook, email, CRM, and more) using pre-built or custom connectors.
- Data Transformation and Enrichment: Automatically cleans, blends, and normalizes data for accurate cross-channel comparisons and multi-location rollups.
- Dynamic Visualization: Instantly updates visual dashboards and key performance indicators (KPIs) as new data flows in, providing a real-time view of campaign performance.
- Automated Reporting Workflows: Enables scheduled or trigger-based delivery of branded reports to stakeholders, eliminating manual report generation.
- AI-Powered Dashboard Creation: Leverages artificial intelligence to analyze datasets, suggest optimal visualizations, and surface actionable insights—so users can move from data to decisions faster.
This level of automation is a game-changer for marketing teams and agencies. Instead of cobbling together manual reports and risking errors or outdated numbers, teams can focus on interpreting insights and optimizing campaigns. Platforms like TapClicks take this a step further by offering a unified, scalable system that combines data integration, analytics, reporting, and workflow automation under one roof.
For a deeper dive into how TapClicks’ approach to dashboard automation transforms agency reporting efficiency, check out this resource on marketing dashboard automation. By automating the dashboard creation and reporting process, marketing teams can unlock more timely, accurate, and actionable insights—giving them a true competitive edge.
Benefits of Real-Time Marketing Analytics
In today’s fast-paced digital landscape, the ability to access and act on real-time marketing analytics is a game-changer for agencies and in-house teams alike. With real-time insights, marketing professionals can monitor campaign performance as it happens, spot trends early, and make data-driven decisions that keep them ahead of the competition.
Faster Decision-Making and Optimization:
Real-time analytics empower teams to identify what’s working—and what isn’t—without waiting for end-of-week or end-of-month reports. For example, if an ad campaign underperforms on one channel, marketers can reallocate budget or adjust creative elements immediately, rather than losing valuable days or weeks. This agility translates directly into improved ROI and more efficient use of marketing spend.
Increased Efficiency Across Teams:
Automated dashboards eliminate manual data pulls and spreadsheet wrangling, freeing analysts and account managers to focus on strategy and creative problem-solving. With all campaign metrics centralized and updated in real time, teams spend less time chasing down numbers and more time optimizing campaigns. Agencies managing dozens or hundreds of clients see especially strong efficiency gains, as they can surface insights for each account with just a few clicks.
Improved Campaign Performance:
Access to up-to-the-minute analytics means marketers can monitor audience engagement, conversion rates, and budget pacing continuously. This enables rapid experimentation and fine-tuning—whether it’s A/B testing landing pages or adjusting ad targeting on the fly. The result: campaigns that are more responsive to audience behaviors and market conditions, delivering better outcomes for clients and brands.
For a deeper dive into how real-time analytics and automation can transform marketing operations, explore this guide on real-time marketing automation. By embracing real-time marketing analytics, organizations set themselves up for smarter decisions, greater agility, and measurable campaign success.
Multi-Channel Data Aggregation and Centralization
In today’s fragmented digital landscape, marketing teams juggle dozens of platforms—think Google Ads, Facebook, LinkedIn, programmatic DSPs, CRMs, and more. Without a centralized view, critical data remains siloed, making it difficult to understand true campaign performance or optimize spend across channels. That’s why data aggregation and centralization are foundational to modern marketing operations.
Marketing dashboard automation tools act as a cross-platform command center, automatically aggregating data from every source and bringing it into a unified analytics environment. Rather than manually exporting spreadsheets or logging into each platform, teams can use a cross-platform dashboard builder to blend social, search, display, email, and even offline data—all in real time. This centralization eliminates blind spots, ensures consistency in reporting, and enables holistic measurement of multi-channel or multi-location campaigns.
For agencies, centralized data means they can efficiently manage reporting for hundreds of clients, each with unique channel mixes and campaign goals. For multi-location brands, it unlocks granular visibility into performance by region, product line, or franchise—making it easier to compare results and allocate budget where it matters most.
TapClicks excels in this arena, offering over 10,000 marketing and business data connectors—so virtually any platform can feed into a single dashboard. With TapClicks’ data aggregation capabilities, marketers can automatically blend and normalize data, track cross-channel performance, and create a true single source of truth. This empowers teams to move beyond siloed analytics and embrace a unified approach to campaign optimization and strategic planning.
Say Goodbye to Manual Reporting: How Automated Workflows Transform Marketing Ops
Manual reporting is more than just tedious—it’s a productivity drain. Errors, bottlenecks, and endless copy-pasting can swallow hours your team could spend on strategy and optimization. That’s where automated reporting workflows come in, shifting your focus from repetitive tasks to high-impact analysis.
What Does Automated Reporting Really Solve?
- Eliminates manual data exports and formatting
- Reduces risk of reporting errors
- Ensures timely, consistent report delivery
- Frees up analysts for insights and optimization
How TapClicks Makes Automated Reporting Effortless
With TapClicks, you can:
-
Set Recurring Report Schedules
- Schedule weekly campaign updates or monthly executive summaries.
- No more scrambling to pull last-minute numbers for clients or leadership.
-
Automate Delivery to Stakeholders
- Directly email reports to internal teams, clients, or executives.
- Role-based access ensures the right people see the right data.
-
Brand Every Report
- Use customizable templates with your agency’s or brand’s visual identity.
- Deliver polished, professional insights every time.
-
Centralize and Secure Data
- Keep all your dashboards and reports in one place.
- Maintain compliance and data integrity across the organization.
Example: Save Time and Boost Accuracy
| Manual Reporting | Automated with TapClicks |
|---|---|
| Export data from tools | Data pulled automatically |
| Format slides by hand | Branded templates in use |
| Email each stakeholder | Scheduled, automated sends |
| Double-check for errors | Consistent, error-free |
How Much Time Can You Save?
50+ hours per analyst per month
That’s the typical time saved by TapClicks users who automate reporting versus sticking with manual workflows.
Why It Matters
- Stay Aligned: Everyone gets up-to-date, trustworthy data—no more version confusion.
- Focus on What Matters: Spend more time analyzing and optimizing campaigns.
- Impress Clients and Leadership: Deliver insights, not just numbers.
Ready to learn more?
Check out this guide on marketing dashboard automation or visit TapClicks to see how automated reporting can transform your team’s workflow.
How AI Supercharges Dashboard Creation and Insights
AI is revolutionizing how marketers build, analyze, and act on their dashboards. Instead of wrestling with manual setup and static charts, today’s AI-powered platforms—like TapClicks—deliver instant, actionable insights and automate the heavy lifting.
From Manual Dashboards to AI-Powered Automation
Traditional Approach:
- Drag-and-drop every widget
- Manually configure each data source
- Build KPIs one at a time
- Repeat for every campaign and client
With AI-Powered Dashboard Creation:
- AI scans your campaign objectives and historical data
- Automatically selects relevant data sources and KPIs
- Instantly assembles dashboards tailored to your goals and audience
- Eliminates tedious configuration and repetitive setup
What Makes AI-Driven Insights Different?
AI Agents in TapClicks:
- Continuously scan your marketing data in real time
- Surface trends, spot anomalies, and flag optimization opportunities
- Go beyond static charts with proactive, actionable suggestions
Examples of AI Insights You’ll See:
- Alerts about underperforming channels or campaigns
- Recommendations for budget reallocation based on predictive models
- Identification of emerging audience segments or creative winners
| Traditional Reporting | AI-Driven Insights in TapClicks |
|---|---|
| Static, manual reports | Real-time, continuous insight delivery |
| Lagging indicators | Proactive, predictive recommendations |
| Requires manual analysis | Automated, plain-language summaries |
SmartEmail: Insights Delivered, Not Just Displayed
TapClicks’ SmartEmail brings insight delivery to the next level:
- Automated summaries: Campaign performance distilled into easy-to-read updates
- Direct to inbox: Stakeholders get what they need without logging in or waiting for scheduled reports
- No manual analysis required: Free up your team’s time for higher-value work
Why This Matters for Marketing Teams and Agencies
AI-powered dashboards and insight delivery help you:
- Make faster, data-backed decisions
- Optimize campaigns on the fly
- Demonstrate real ROI to clients—proactively, not reactively
With TapClicks, you’re not just reporting on what happened.
You’re shaping what happens next.
Building a Campaign Performance Dashboard
Creating an effective campaign performance dashboard is essential for marketing teams that want to monitor results, optimize strategies, and communicate ROI to stakeholders. Here’s a step-by-step outline to get you started:
1. Identify Your Objectives and Audience
Begin by clarifying the primary goal of your dashboard. Is it for internal optimization, executive updates, or client reporting? Understanding your audience ensures you select the most relevant metrics and visualizations.
2. Choose Key Performance Metrics
Select metrics that align with your campaign goals. For most marketing operations, these include:
- ROI (Return on Investment): Measures the profitability of your campaigns.
- Engagement: Tracks actions like clicks, shares, comments, or video views.
- Spend: Monitors budget allocation and pacing across channels.
- Conversions: Captures leads, purchases, or other desired outcomes.
- Impressions & Reach: Shows how many people have seen your ads.
- Cost per Acquisition (CPA) and Cost per Click (CPC): Highlights efficiency.
3. Aggregate Multi-Channel Data
Use a platform like TapClicks to automatically pull in data from all your marketing and advertising channels—social, search, email, display, and more. This eliminates manual data entry and ensures your dashboard always reflects up-to-date campaign performance.
4. Design Clear, Actionable Visualizations
Map each metric to the best visualization:
- Line graphs for trends over time (e.g., daily conversions)
- Bar charts for channel or campaign comparisons (e.g., spend by channel)
- Pie charts for budget allocation
- Gauges or scorecards for KPIs like ROI and CPA
Ensure your dashboard layout is intuitive, grouping related metrics together for easy scanning.
5. Automate Data Refresh and Reporting
Set up automated data syncs and scheduled dashboard updates so your team and stakeholders always see the latest results. With TapClicks, you can configure dashboards to refresh in real-time and schedule recurring reports for hands-off delivery.
6. Enable Ongoing Optimization
Leverage AI-powered insights to spot performance trends, anomalies, and optimization opportunities directly within your dashboard. For example, TapClicks can surface recommendations for budget reallocation or flag underperforming channels, helping you take action faster.
By following these steps, you’ll build a campaign performance dashboard that not only tracks critical marketing metrics but also empowers your team to make smarter, data-driven decisions—automatically and at scale.
How to Choose the Best Marketing Dashboard Automation Platform
Finding the right marketing dashboard automation software has a big impact on your team’s productivity, reporting accuracy, and ability to scale. Here’s a simple, actionable guide to help you make the smartest decision—plus a quick comparison of TapClicks and other top options.
What Really Matters When Evaluating Dashboard Platforms
Before you dive into demos or sales calls, use this checklist to focus your search on what counts:
- Wide-Ranging Integrations
- Can the platform connect to all your marketing, ad, and business data sources?
- Tip: TapClicks offers 10,000+ built-in connectors, so you’re not stuck with manual data imports.
- Scalability for Growth
- Will it scale as you add more clients, teams, or locations?
- Important for agencies, media companies, and multi-location brands.
- AI Features That Go Beyond Pretty Charts
- Does it deliver automated insights, predictive analytics, and budget recommendations—not just static visuals?
- TapClicks’ AI agents and SmartEmail keep you ahead of the curve.
- User-Friendly Experience
- Are dashboards drag-and-drop? Is report scheduling intuitive?
- A must-have for both analysts and business users.
- Automated & Branded Reporting
- Can it generate recurring, branded reports for stakeholders (internal and client-facing) without manual effort?
- Flexible Data Workflows
- Is it easy to centralize data within the platform—or export clean datasets to BI tools like Tableau, Power BI, or Looker?
How TapClicks Stacks Up Against Other Platforms
Here’s a quick side-by-side snapshot:
| Feature/Capability | TapClicks | Funnel.io / Supermetrics | Agency Analytics / NinjaCat | Datorama (Salesforce) |
|---|---|---|---|---|
| Data Connectors | 10,000+ | 500–1,000 | 60–100 | 300+ |
| AI Insights | Advanced (SmartPilot, SmartEmail, predictive models) | Basic | Minimal | Moderate |
| Workflow Automation | Built-in (orders, workflow) | None | Minimal | None |
| Dashboards & Reporting | Drag-and-drop, white-labeled, scalable | Basic | Good for SMB | Advanced, complex |
| Scalability | Enterprise-grade | Mid-market | SMB | Enterprise |
| Ease of Use | Very user-friendly | User-friendly | User-friendly | Steep learning curve |
| Data Export Options | Native BI tool connectors | CSV, basic API | Limited | Advanced |
In short:
- TapClicks: Best for agencies, media groups, and brands who need unified data, AI-powered insights, and built-in workflow at scale.
- Funnel.io / Supermetrics: Great for pulling data, less so for dashboards or workflow.
- Agency Analytics / NinjaCat: Quick SMB reporting, but lacks depth and scale.
- Datorama: Powerful, but requires heavy IT lift and can be complex to maintain.
Tips for a Smooth Rollout
Set yourself up for success by following these steps:
- Start Small, Then Expand
- Tackle your biggest pain points first—like manual client reports or multi-channel campaign roll-ups.
- Get Everyone Involved Early
- Bring analysts, account managers, and leadership into the pilot phase.
- Lean on Vendor Support
- Use onboarding resources, knowledge bases, and customer success teams to speed up adoption.
- Measure What Matters
- Track reductions in manual work, fewer errors, and faster insight delivery.
- Iterate and Scale Up
- Once you prove the value, roll the platform out to more clients, teams, or locations.
Bottom Line
The right marketing dashboard automation software should do more than just visualize data—it should unify your workflow, automate your reporting, and surface insights you can act on.
TapClicks is built for scale, flexibility, and real, measurable impact. Explore what TapClicks can do for your team: Learn more here.
Getting Started with TapClicks Marketing Dashboard
Ready to leave manual reporting behind and unlock the power of automated, real-time marketing analytics? Here’s a simple checklist to help you implement the TapClicks marketing dashboard and start streamlining your data operations right away:
1. Identify Your Data Sources
List out all platforms and channels you need to integrate—Google Ads, Facebook, programmatic platforms, CRM systems, and any other marketing or business tools. TapClicks offers over 10,000 connectors, so even niche data sources can be unified in one place.
2. Set Up Data Integration
Use TapClicks’ Smart Connectors to bring your data into a centralized dashboard. The automated ETL/ELT pipeline will handle the heavy lifting, cleaning and normalizing your datasets for cross-channel analysis.
3. Customize Your Dashboards
Leverage drag-and-drop dashboard creation to build views tailored for your team, clients, or specific campaigns. TapClicks makes it easy to brand reports and dashboards for a professional look.
4. Automate Reporting Workflows
Schedule recurring reports and set up automated delivery to stakeholders, reducing manual effort and ensuring everyone is kept in the loop with the latest insights.
5. Activate AI Insights
Tap into AI-powered features like SmartPilot and SmartEmail to surface actionable insights, campaign recommendations, and predictive analytics—delivered directly to your inbox or your client’s.
6. Collaborate and Iterate
Grant role-based access to clients or teammates, enable feedback loops, and refine your dashboards as needs evolve. TapClicks supports collaboration at scale, whether you’re an agency managing hundreds of clients or a brand with multi-location operations.
For a deeper dive into best practices and advanced setup, check out this guide to boosting agency reporting efficiency with dashboard automation.
See TapClicks in Action:
Curious how it all comes together? Explore a demo or request a trial to experience the power of automated marketing dashboard analytics for yourself. With TapClicks, you’ll move from data chaos to insight-driven action—faster than ever before.
Start Automating Your Marketing Data Today!
No Credit Card Required.

