

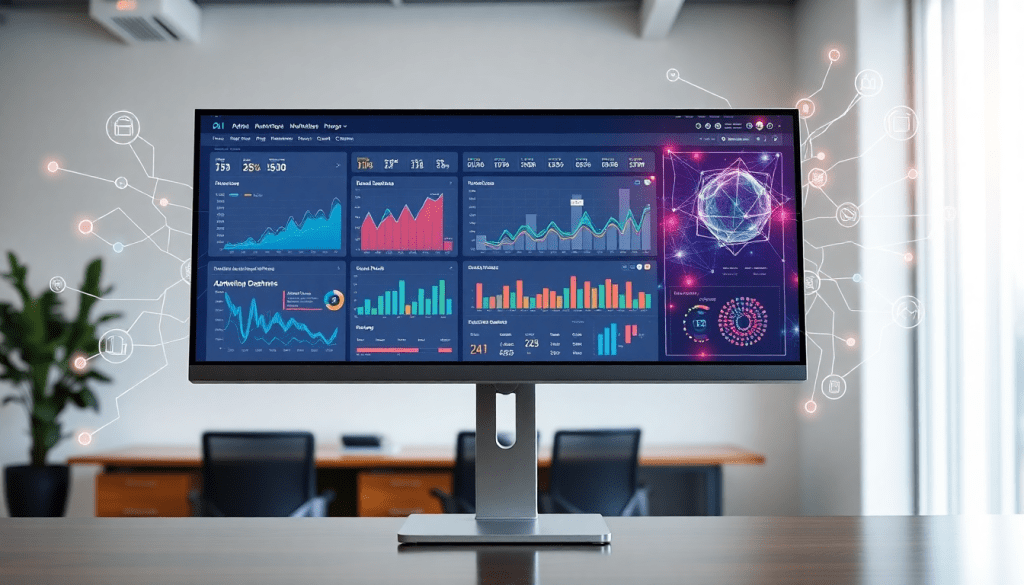
Marketing Dashboard Automation: Real-Time Analytics & AI Tools
Marketing dashboard automation is transforming how agencies, brands, and enterprise teams manage and act on their data. By centralizing marketing analytics, streamlining reporting workflows, and leveraging AI-driven insights, teams can move faster and make smarter decisions across every campaign. This guide explores how automated reporting, AI-powered dashboard creation, and real-time analytics come together in modern platforms like the TapClicks marketing dashboard.
What is Marketing Dashboard Automation?
Marketing dashboard automation is the process of using technology to automatically collect, organize, and visualize marketing data across channels—eliminating manual reporting tasks and enabling real-time analytics. At its core, marketing dashboard automation centralizes campaign performance data from diverse sources, standardizes it for easy comparison, and presents it in customizable dashboards that update automatically. This means marketing teams no longer have to spend hours pulling spreadsheets, formatting charts, or manually creating client reports.
The primary components of marketing dashboard automation include:
- Data Integration: Seamlessly connecting to a wide range of marketing, advertising, and business platforms to gather all relevant metrics.
- Automated ETL (Extract, Transform, Load): Cleaning, blending, and normalizing data so it’s ready for analysis without manual intervention.
- Visualization: Using customizable dashboards and widgets that update in real time as new data flows in.
- Workflow Automation: Scheduling and distributing reports, assigning tasks, and triggering alerts based on campaign performance.
The difference between manual and automated reporting workflows is dramatic. Manual reporting is time-consuming, error-prone, and often outdated by the time it’s delivered. In contrast, automated workflows ensure that stakeholders always have access to the latest insights—freeing analysts and marketers to focus on strategy rather than repetitive data wrangling.
Modern marketing dashboard automation platforms take this a step further by integrating AI-powered dashboard creation and real-time analytics. AI can automatically generate dashboards tailored to specific goals, highlight anomalies, and surface actionable recommendations—helping teams move from raw data to impactful decisions faster than ever.
To learn more about how dashboard automation is changing marketing operations, see TapClicks’ overview of marketing dashboard automation.
Benefits of Automated Reporting Workflows
Automated reporting workflows are a game-changer for marketing teams, agencies, and enterprise organizations that need to turn complex multi-channel data into actionable insights—fast and at scale. By shifting from manual, spreadsheet-heavy processes to automation, teams unlock significant time savings, dramatically reduce human error, and ensure data consistency across every report.
One of the most immediate benefits is the elimination of repetitive data pulls and manual formatting. Automated workflows, like those found in the TapClicks marketing dashboard, allow users to aggregate data from thousands of sources—Google Ads, Facebook, programmatic platforms, CRMs, and more—without ever exporting a CSV. This streamlining means analysts and account managers can reclaim 50+ hours per month previously lost to manual reporting, and instead focus that time on optimizing campaigns or delivering strategic recommendations.
Error reduction is another core advantage. Automation ensures that reports are generated from the same standardized, validated datasets every time, minimizing the risk of copy-paste mistakes or missed updates. This consistency is essential for both internal analytics and client-facing dashboards, where accuracy and trust are paramount.
Automated reporting workflows also excel at multi-channel data aggregation. By pulling campaign performance data from disparate platforms into unified dashboards, teams can instantly see cross-channel results, spot trends, and make better decisions. Whether managing hundreds of client accounts or tracking enterprise-wide campaigns, automation powers a holistic view that manual processes simply can’t match.
Report scheduling automation is the final piece that transforms productivity. With tools like TapClicks, teams can set up recurring reports—daily, weekly, or monthly—that go out automatically to internal stakeholders or clients. No more last-minute scrambles or missed deadlines; insights arrive on time, every time. This not only boosts team efficiency but also elevates the client experience, providing proactive, data-driven updates without manual intervention.
Ultimately, automated reporting workflows streamline the entire analytics lifecycle, enabling organizations to move faster, reduce costs, and deliver smarter results. For a deeper dive on real-time reporting automation and AI-driven insights, check out TapClicks’ real-time reporting with AI.
How AI Is Changing the Dashboard Game
AI is revolutionizing the way marketing teams build, manage, and extract insights from dashboards. Gone are the days of manual data wrangling and static reports—AI-powered tools like TapClicks automate, accelerate, and elevate every step of the analytics process.
Why Manual Dashboards Fall Short
Traditional dashboard creation typically means:
- Manual data pulls from multiple sources
- Custom visualization design for each report
- Time-consuming analysis to find actionable takeaways
This approach is slow, error-prone, and hard to scale—especially when managing dozens (or hundreds) of clients and channels.
How AI Makes Dashboards Smarter
With AI at the center, dashboard creation becomes:
- Automated: Instantly blend and normalize data from paid, owned, and earned channels—no more spreadsheet gymnastics.
- Insightful: AI surfaces trends, outliers, and patterns you might miss on your own.
- Story-driven: Dashboards focus attention on what matters, flagging campaigns that need attention and forecasting big wins.
TapClicks in Action:
TapClicks’ AI-powered reporting features allow users to create drag-and-drop dashboards that don’t just visualize data—they analyze it in real time:
| Feature | What It Does |
|---|---|
| Automated Analysis | Flags underperforming campaigns & suggests fixes |
| Predictive Models | Forecasts results & recommends budget adjustments |
| SmartEmail Summaries | Delivers instant, AI-generated insights to inboxes |
| Anomaly Detection | Alerts teams to unexpected data changes, right away |
Predictive Analytics: Seeing Around Corners
AI’s value goes beyond just reporting what happened. With predictive analytics, you get:
- Budget pacing forecasts: Know if you’ll overspend or underspend before it happens
- Outcome predictions: Estimate campaign performance based on historical trends
- Smart allocation tips: AI suggests shifting budget or tactics to maximize ROI
Automation = More Time for Strategy
With tools like TapClicks SmartEmail and AI agents:
- Stakeholders receive curated summaries—no need to dig for insights
- Less manual reporting means teams can focus on creative and strategic work
The Bottom Line
AI is transforming dashboards from static snapshots into dynamic, proactive engines of marketing success.
Platforms like TapClicks are leading the evolution, empowering agencies, brands, and enterprise teams to get more value from their data—faster and smarter than ever before.
Real-Time Marketing Analytics: Why Speed Matters
In today’s hyper-competitive digital landscape, the ability to access and act on real-time marketing analytics isn’t just a luxury—it’s a necessity for high-performing teams. Real-time analytics enable marketers to monitor campaign performance as it unfolds, making it possible to seize opportunities, mitigate risks, and optimize budgets without delay.
The value of real-time analytics becomes especially clear during time-sensitive campaigns, such as product launches, flash sales, or major events. With instant data refresh, teams can track KPIs like impressions, clicks, conversions, and ROAS as they happen, rather than waiting for daily or weekly reports. This immediacy empowers marketing leaders to make rapid decisions—shifting spend, reallocating resources, or pausing underperforming tactics before they impact overall results.
Budget pacing is another critical use case. Automated, always-on dashboards ensure you can monitor spend across platforms and channels in real time. If a campaign starts to overspend or underdeliver, alerts and AI-driven recommendations can prompt immediate adjustments, preventing wasted budget and maximizing ROI.
A modern cross-platform dashboard builder, such as the TapClicks marketing dashboard, brings all this data together from disparate sources—Google Ads, Meta, LinkedIn, programmatic, and more—into one unified view. This centralization eliminates the need for manual data pulls or spreadsheet wrangling, giving every stakeholder access to always-current analytics. The result: faster decision cycles, more agile marketing, and a measurable edge over competitors still relying on static or outdated reports.
Why Marketing Teams Need a Centralized Data Hub
Modern marketing doesn’t happen on just one channel. Campaigns run across Google, Facebook, LinkedIn, email, programmatic ad networks, and more—each churning out its own reports, metrics, and data quirks. Without a way to bring all this together, it’s easy to lose sight of the big picture.
What Is Multi-Channel Data Aggregation?
Multi-channel data aggregation is all about automatically pulling data from every marketing and advertising platform you use into a single source of truth. Here’s what happens if you skip this step:
- Data stays siloed in individual dashboards
- Teams rely on spreadsheets for manual imports
- Analytics become fragmented and time-consuming
- Opportunities for optimization get lost in the shuffle
Centralizing your marketing data breaks down these barriers and gives everyone—from analysts to executives—a unified, real-time view of what’s working (and what’s not).
What Are the Benefits of Centralizing Marketing Data?
When you aggregate and centralize your data, you can:
-
Compare and benchmark performance
Instantly stack up results across platforms and campaigns. -
Spot cross-channel trends
See how audiences interact across touchpoints and uncover true attribution paths. -
Streamline reporting and analysis
Normalize and enrich data for apples-to-apples comparisons—no more wrangling exports. -
Move faster with strategy
Make confident decisions with unified views of spend, ROI, and budget pacing.
How TapClicks Makes It Easy
Platforms like TapClicks are built for this challenge. TapClicks offers:
| Feature | What It Means for You |
|---|---|
| 10,000+ Data Connectors | Connect to almost any marketing, ad, or business platform—automatically. |
| Automated ETL Pipelines | No more manual uploads; data is always up-to-date and unified. |
| Data Blending & Normalization | Mix metrics from different channels for seamless reporting. |
| Scalable Dashboards | Handle hundreds or thousands of reports without breaking a sweat. |
Real-World Impact
For agencies, brands, and enterprise teams, this centralized approach means:
- Faster, more accurate reporting
- Less manual work for analysts
- Smarter, data-driven decisions across the entire marketing landscape
Multi-channel data aggregation isn’t just a technical upgrade—it’s the foundation for strategic growth and competitive advantage.
Building and Customizing Campaign Performance Dashboards
Creating an effective campaign performance dashboard is both an art and a science. With a modern cross-platform dashboard builder, marketers can assemble real-time views that not only visualize KPIs but also adapt to the unique needs of each client, department, or stakeholder. Here’s how to build a powerful campaign dashboard—plus best practices for customization and automation.
Step 1: Define Your Objectives and Audience
Start by clarifying what the dashboard needs to achieve. Is it for internal optimization, executive summaries, or client-facing transparency? Each audience will have different priorities—such as high-level ROI metrics for executives or granular channel data for campaign managers.
Step 2: Select Key Metrics and Data Sources
Focus on metrics that align with your campaign goals, such as impressions, clicks, conversions, cost-per-acquisition, and ROAS. Use a cross-platform dashboard builder like the TapClicks marketing dashboard to seamlessly aggregate data from dozens (or thousands) of channels—Google Ads, Facebook, programmatic, email, local media, and more.
Step 3: Choose and Customize Widgets
Drag-and-drop widget libraries make it easy to visualize data as charts, tables, funnels, or geographic heatmaps. For best results:
- Prioritize clarity—avoid clutter by displaying only the most actionable data.
- Use color coding and branded themes to match your agency or client identity.
- Group related metrics into logical sections (e.g., Awareness, Engagement, Conversions).
Step 4: Automate Data Refresh and Reporting
Automated reporting workflows ensure that dashboards are always up to date—no more manual data pulls or late-night spreadsheet wrangling. Platforms like TapClicks allow you to schedule data refreshes and automate report delivery, supporting both internal teams and client-facing transparency with minimal effort.
Step 5: Enable Client-Specific Customization
Role-based access and white-labeling ensure each user sees only what’s relevant. With TapClicks, agencies can quickly spin up unique dashboards for each client, location, or brand, complete with custom KPIs, branding, and even language localization. This level of personalization helps drive engagement and trust.
Step 6: Integrate Insights and Recommendations
Leverage AI-driven features that automatically highlight trends, anomalies, or optimization opportunities. TapClicks’ AI tools can surface actionable insights directly in the dashboard or via automated SmartEmails, making it easier for teams and clients to act quickly.
By following these best practices, marketers can deliver campaign performance dashboards that are visually compelling, always accurate, and tailored for maximum impact. Learn more about building custom dashboards and reporting workflows by exploring TapClicks’ solutions for agencies, brands, and enterprise teams.
Report Scheduling Automation: Delivering Insights at Scale
In today’s multi-channel marketing landscape, timely and consistent communication isn’t just nice to have—it’s essential. When campaigns run across dozens of channels, clients, or locations, report scheduling automation transforms how insights are shared and decisions are made.
Why Automate Report Scheduling?
Here’s how automated report scheduling changes the game:
- Timeliness: Stakeholders always get the latest insights—no more outdated spreadsheets or missed deadlines.
- Consistency: Every report follows the same process and format, minimizing errors and manual bottlenecks.
- Efficiency: Analysts and account managers reclaim hours each week for high-value work, instead of repetitive exporting and emailing.
How Does Report Scheduling Automation Work?
Let’s break it down step by step:
- Configure Schedule: Set the cadence—daily, weekly, monthly, or custom.
- Select Recipients: Define who receives which reports (clients, executives, teams).
- Choose Formats: Pick from interactive dashboards, PDFs, or Excel exports.
- Automated Distribution: The system pulls the latest campaign data, updates dashboards, and distributes reports—automatically.
| Step | What Happens |
|---|---|
| Schedule | Choose timing for each report |
| Recipients | Assign tailored lists by client, region, or team |
| Format | Select dashboard, PDF, Excel, or all three |
| Distribution | Send reports automatically—no manual intervention |
Pro Tips for Getting the Most from Automated Reporting
- Tune Frequency: Match report timing to audience needs—executives may want monthly overviews, while account managers or clients might appreciate weekly or daily updates.
- Segment Wisely: Use role-based or client-based distribution lists to avoid clutter and confusion.
- Brand Everything: Leverage customizable templates to ensure every report reflects your agency’s or brand’s identity.
- Support Dynamic Content: Include campaign-specific dashboards and AI-generated summaries for actionable, personalized insights.
What Does TapClicks Bring to the Table?
TapClicks takes scheduled reporting to a whole new level:
- Scale: Automate delivery across hundreds (or thousands) of clients and campaigns.
- Simplicity: Set up recurring reports in just a few clicks—no coding required.
- Personalization: Each recipient gets the data that matters most, thanks to dynamic dashboards and AI-driven summaries.
- Branding: Branded templates ensure every report looks polished and on-message.
- Reliability: Eliminate manual errors and missed sends—TapClicks keeps your stakeholders informed, every time.
Want to see how TapClicks can streamline your reporting workflows and keep everyone in the loop?
Explore TapClicks reporting automation today.
Choosing the Right Marketing Automation Software
Selecting the right marketing automation software is pivotal for maximizing the impact of your analytics and reporting efforts. The ideal platform should offer a robust suite of features that not only address your current needs but also scale as your requirements evolve.
Key Features to Look For:
- Comprehensive Data Connectors: Ensure the software supports integrations with all your critical marketing, advertising, and business platforms. Look for solutions like TapClicks that provide thousands of native connectors, eliminating manual data pulls and reducing time spent on data wrangling.
- AI Capabilities: Modern marketing dashboards should go beyond static visuals. Prioritize platforms with AI-powered features—such as automated insight generation, anomaly detection, and predictive analytics—that can surface actionable recommendations and proactively alert your team to important changes.
- Workflow Automation: From order management to approval workflows, automation is essential for streamlining campaign execution and collaboration between teams. Workflow tools should enable seamless transitions between sales, operations, and fulfillment, reducing bottlenecks and manual errors.
- Customization and Scalability: Look for customizable dashboards, drag-and-drop reporting, and white-label options to meet specific client or brand requirements. At scale, the platform should support hundreds (or thousands) of users, dashboards, and scheduled reports without performance hiccups.
TapClicks vs. Other Dashboard Builders
While many cross-platform dashboard builders offer data visualization or reporting, TapClicks stands out by unifying data integration, advanced analytics, and workflow automation within a single platform. Competitors like Funnel.io and Supermetrics function primarily as data pipes, requiring additional tools for visualization or reporting. Others, such as Agency Analytics or NinjaCat, may handle reporting well but lack deep AI insights or robust workflow features.
TapClicks combines the best of both worlds:
- Unified Data Hub: Aggregate, cleanse, and normalize data from every channel.
- AI-Driven Insights: Leverage features like SmartPilot and SmartEmail to turn raw data into clear, actionable recommendations.
- Scalable Reporting: Automate delivery of branded reports and dashboards at scale, supporting agencies, brands, and enterprise teams.
- Flexible Integration: Use TapClicks as your single source of truth, or pipe enriched data into BI tools like Tableau, Power BI, or Looker.
Delivering Value Across Use Cases
Whether you’re an agency managing hundreds of clients, a brand unifying multi-location performance data, or an enterprise team seeking to feed analytics into broader business intelligence systems, the TapClicks marketing dashboard adapts to your workflow. Its blend of automation, AI, and customization ensures you spend less time on manual reporting and more time on driving marketing outcomes.
By prioritizing these features and evaluating how platforms like TapClicks compare to others in the market, you can confidently select a marketing automation solution that empowers your team and future-proofs your analytics strategy.
Conclusion
Marketing dashboard automation—powered by AI and real-time analytics—is reshaping how organizations of all sizes approach campaign management, reporting, and decision-making. By unifying data across channels, automating time-consuming workflows, and surfacing actionable insights in seconds, teams can move from reactive reporting to proactive, strategic optimization. With platforms like the TapClicks marketing dashboard, agencies, brands, and enterprise teams not only save hours each week but also unlock new opportunities for growth and efficiency.
To truly experience the benefits of modern marketing operations, we encourage you to explore TapClicks’ comprehensive guides on dashboard automation, AI-powered reporting, and real-time analytics. Whether you’re ready to learn more about TapClicks, book a personalized demo, or simply dive deeper into the possibilities with automated dashboards, now is the time to elevate your marketing analytics and reporting to the next level.
Start Automating Your Marketing Data Today!
No Credit Card Required.

