

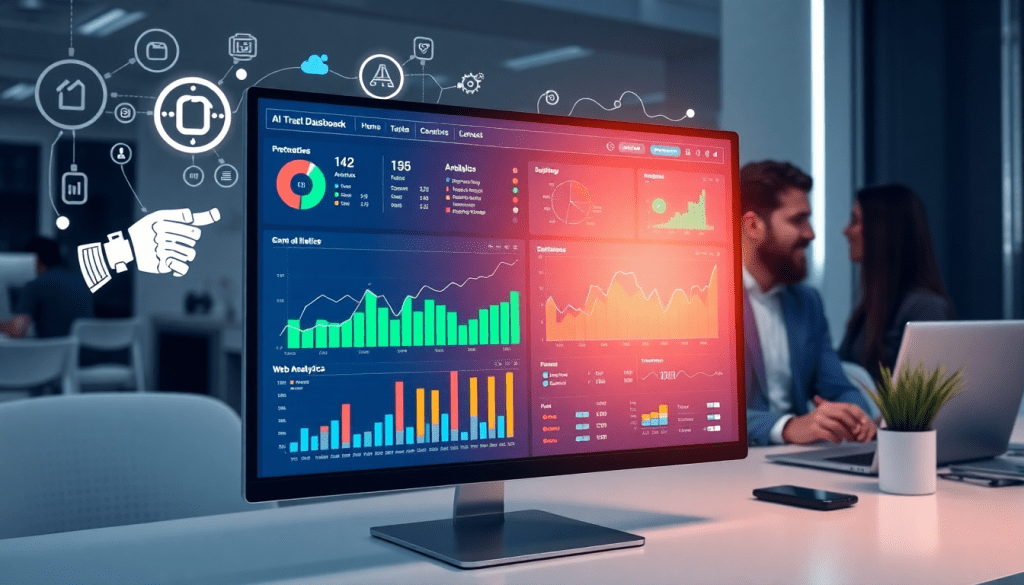
Marketing Dashboard Automation: Real-Time Analytics & AI Tools
Modern marketing teams juggle a constant influx of data from ads, social media, web analytics, and more. Without the right automation, turning that multi-channel data into actionable insights can become overwhelming fast. Marketing dashboard automation—especially with AI and real-time analytics—transforms how teams monitor performance, optimize campaigns, and deliver client-ready reports. This guide explores the power of AI-powered dashboards, automated reporting workflows, and centralized data management, with real-world examples from the TapClicks marketing dashboard.
What is Marketing Dashboard Automation?
Marketing dashboard automation is the process of using software to automatically consolidate, visualize, and report on marketing data from multiple sources—all in a single, unified interface. For data-driven marketing teams, this capability is no longer a luxury but a necessity. With campaigns running across Google Ads, Facebook, email platforms, and more, manually collecting and analyzing performance metrics can be both time-consuming and error-prone.
By automating the flow of data from each channel into intuitive dashboards, teams eliminate the tedious manual tasks of exporting spreadsheets, updating charts, and formatting reports. Instead, marketing dashboard automation tools continuously pull in real-time data, aggregate it, and refresh key performance indicators (KPIs) automatically. This means marketers spend less time wrangling data and more time interpreting results and taking action.
A key driver in the evolution of dashboard automation is the rise of AI-powered technologies. Modern platforms now leverage artificial intelligence to not only build dashboards faster but also to surface insights, flag anomalies, and even recommend optimizations. As a result, marketers gain instant clarity into what’s working, what’s not, and where to focus their efforts—without having to sift through rows of raw data.
Ultimately, marketing dashboard automation streamlines the end-to-end process of data collection, visualization, and reporting. It empowers teams to move at the speed of digital marketing, ensuring stakeholders always have access to the most up-to-date analytics. For a deeper dive into the foundational concepts and best practices, see "What is Marketing Dashboard Automation?".
Why Automated Reporting Workflows Are a Game-Changer
Automated reporting workflows take the pain out of data wrangling and free up your team for what matters: strategy, optimization, and creativity. Let’s break down the real-world advantages that automation brings to marketing teams and agencies.
Save Time and Boost Productivity
- Manual reporting eats up hours: Analysts can spend dozens of hours each month pulling and cleaning data from multiple platforms.
- Automation streamlines the process: Tools like TapClicks automatically extract, normalize, and update dashboards in real time—no more spreadsheet gymnastics.
- Example in action: TapClicks users often reclaim 50+ hours per analyst per month, letting teams redirect energy to higher-value work.
Eliminate Costly Errors
- Human error is inevitable: Copy-paste mishaps, outdated figures, and missed updates can undermine trust.
- Automated pipelines deliver consistency: Data aggregation, transformation, and visualization happen the same way every time.
- Result: Stakeholders get a reliable, single source of truth—vital for multi-channel campaigns and agencies juggling multiple clients.
Deliver the Right Insights, Right on Time
- Stakeholder needs vary: Executives may want daily pulse checks; clients might prefer weekly or monthly deep dives.
- Easy scheduling and customization: Automated workflows let you set up tailored, recurring reports—automatically branded and delivered via email or shared portals.
- Collaboration is built in: No more bottlenecks. Everyone gets the insights they need, when they need them.
Quick Checklist: What Can You Automate with TapClicks?
- Scheduled, branded, and client-ready reports
- Real-time dashboard updates
- Data pulls and normalization from 10,000+ sources
- Internal and external report sharing
- Error-proof aggregation and visualization
Want to take automation even further? See how AI supercharges reporting efficiency in our guide: AI-powered reporting made easy.
Bottom line: Automating your reporting workflow means less grunt work, fewer mistakes, and more timely, actionable insights—giving your team and clients a serious edge in today’s fast-moving digital world.
Real-Time Marketing Analytics: Why Speed Matters
In today’s hyper-competitive marketing landscape, speed isn’t just an advantage—it’s a necessity. Real-time analytics gives marketing teams immediate visibility into campaign performance, enabling them to react to trends and anomalies as they unfold rather than after the fact. This immediacy is crucial for maximizing ad spend, capitalizing on fleeting opportunities, and correcting course before small issues become costly problems.
With real-time data streaming into your dashboards, you can monitor campaign KPIs—such as clicks, conversions, and cost per acquisition—moment by moment. Instead of waiting for daily or weekly reports, marketing leaders and analysts gain instant access to up-to-the-minute results. This empowers teams to pause underperforming ads, reallocate budgets to high-performing channels, and jump on new opportunities before competitors even notice them.
For example, TapClicks users benefit from real-time alerts that flag sudden shifts in campaign performance, such as spikes in spend or drops in engagement rates. Automated budget pacing tools provide ongoing oversight, ensuring that campaigns stay on target without overspending or underserving key channels. Additionally, real-time opportunity detection—powered by AI—helps surface emerging trends, enabling marketers to seize high-impact moments as they happen.
Ultimately, the ability to act on real-time analytics separates agile, data-driven marketers from those left reacting to yesterday’s results. With solutions like TapClicks, teams can monitor, analyze, and optimize campaign performance on the fly—turning speed into a true competitive edge.
Why Centralizing Your Marketing Data Matters
If you’re juggling campaigns across Google Ads, Facebook, LinkedIn, Instagram, and a handful of analytics tools, you know the pain of data silos. Each platform keeps its metrics locked away, making it tough to see the full picture—or even answer basic performance questions without hours of manual work.
Let’s break down the challenges and the solutions:
The Multi-Channel Data Challenge
- Siloed Data: Ad impressions from Google Ads, engagement stats from Facebook and Instagram, conversion stats from Google Analytics or your CRM—all in separate dashboards.
- Manual Data Wrangling: Analysts spend countless hours exporting, cleaning, and merging spreadsheets.
- Risk of Missed Insights: Without a unified view, it’s easy to overlook cross-channel trends or optimization opportunities.
What Happens When You Centralize Data?
Aggregating and normalizing campaign data in one place unlocks:
- Comprehensive Dashboards: See all your marketing efforts—paid, owned, and earned—in a single view.
- Cross-Platform Analysis: Correlate social engagement with ad spend, track conversion paths across web and offline, and compare performance by brand, region, or client.
- Consistent KPIs: Benchmark and report using unified metrics, no matter where the data originates.
How TapClicks Makes Data Centralization Easy
With TapClicks, you can:
-
Connect Everything
- 10,000+ connectors for marketing, advertising, and business platforms
- Pull in data from programmatic ads, email, CRM, web analytics, and more
-
Automate the Heavy Lifting
- ETL/ELT pipeline extracts, transforms, and loads data—no manual exports
- Automated data enrichment aligns naming conventions, KPIs, and attribution models
-
Blend Disparate Data Seamlessly
- Mix Google Ads clicks, Facebook conversions, Salesforce leads, and offline call tracking
- Build multi-source dashboards without spreadsheet gymnastics
| Feature | TapClicks Advantage |
|---|---|
| Data Connectors | 10,000+ out-of-the-box integrations |
| Data Normalization | Automated enrichment and blending |
| Dashboard Scalability | Serve 1 or 1,000+ clients from one platform |
| Granular Reporting | Drill down by channel, client, region, or tactic |
The Payoff
- Save Time: Eliminate manual data pulls and spreadsheet merges.
- See More: Uncover cross-channel trends and optimization opportunities.
- Scale with Confidence: Roll out dashboards and reports for every client or location—without sacrificing accuracy.
When your data foundation is strong, your marketing decisions get sharper.
Curious how TapClicks can transform your multi-channel reporting? See how it works at TapClicks.com.
AI-Powered Dashboard Creation: Smarter Insights, Less Work
AI isn’t just a buzzword in marketing dashboards—it’s a game-changer for how teams uncover insights and drive results. By embedding artificial intelligence directly into dashboard workflows, platforms like TapClicks eliminate the heavy lifting of manual analysis, visualization, and reporting. This means marketers can focus on strategic decisions rather than combing through spreadsheets or building charts from scratch.
With AI-powered dashboard creation, the system automatically analyzes incoming data, identifies trends, and highlights anomalies or opportunities—often before a human would spot them. For example, TapClicks’ SmartPilot AI agent scans campaign performance data and instantly surfaces recommendations, such as which channels are over- or underperforming and where to reallocate budget for maximum impact. It can even deliver predictive analytics, forecasting future outcomes based on historical trends, so teams stay ahead of the curve rather than react to yesterday’s results.
Automated campaign scoring is another area where AI shines. Rather than relying on static metrics, AI models in TapClicks evaluate campaign health, benchmark against industry standards, and assign actionable scores or grades. These insights are surfaced directly within dashboards, so marketers and clients don’t have to dig for answers—they’re delivered front and center.
Perhaps most transformative, TapClicks’ SmartEmail feature leverages AI to generate and deliver executive-ready summaries of campaign performance or key changes—tailored for each stakeholder. Instead of sifting through dashboards or waiting for meetings, teams and clients get instant, digestible insights right in their inbox.
By automating data analysis, visualization, and insight generation, AI-powered dashboard creation unlocks smarter, faster decision-making and frees marketing teams to focus on strategy and creative execution. Explore how TapClicks leverages these AI capabilities to power next-level marketing operations at TapClicks.com.
Report Scheduling Doesn’t Have to Be a Chore
Automating your marketing report delivery can transform how your team works—saving hours, reducing errors, and making sure stakeholders always get the insights they need, when they need them. Here’s how to make the most of automation, especially with TapClicks.
Setting Up Automated Reports: How It Works
Instead of building and sending reports manually every week, use your reporting center (like TapClicks) to set up a schedule once—and let automation do the rest.
The typical workflow looks like this:
- Choose What to Share
- Select dashboards, campaigns, or specific datasets.
- Set the Frequency
- Daily, weekly, monthly, or even on-demand.
- Tailor the cadence for each client or internal team.
- Pick Your Recipients
- Add stakeholders by email.
- Assign reports to role-based groups (e.g., regional managers, executives).
- Decide on File Format
- Excel/CSV
- Interactive online link
Customization: Make Every Report Feel Personal
Automated doesn’t mean generic. With TapClicks, you can:
- Add Branding: Use your agency’s (or client’s) logos and color schemes.
- Audience-Specific Content: Adjust KPIs, charts, or campaign highlights for each recipient type.
- Location & Language: Localize content for multi-location or global brands.
- Role-Based Access: Ensure each client, team, or executive sees only what’s relevant to them.
Next-Level Automation: TapClicks’ SmartEmail
What sets TapClicks apart is SmartEmail—a feature that sends out AI-curated summaries and insights alongside your scheduled reports. This means:
- No more chasing dashboards: Stakeholders get key takeaways right in their inbox, with no login required.
- Faster decisions: Actionable insights are delivered instantly, so teams can respond to opportunities or issues in real time.
- Scale with confidence: Whether you have dozens or thousands of clients, TapClicks ensures no report is ever delayed or missed.
Quick Checklist: Automate Your Report Delivery with TapClicks
- Select your dashboards and data
- Choose recipients and access levels
- Set frequency and delivery times
- Customize branding and content
- Enable SmartEmail for AI-powered insight summaries
Ready to save hours and deliver smarter, more timely reports? Explore the full capabilities of TapClicks.
Building a Campaign Performance Dashboard with TapClicks
Building an effective campaign performance dashboard in TapClicks is a streamlined, intuitive process that empowers marketers to centralize multi-channel data, track KPIs, and extract actionable insights—all within a few clicks. Here’s a step-by-step overview to help you get started:
Step 1: Connect Your Data Sources
Begin by integrating your marketing channels—think Google Ads, Facebook, LinkedIn, CRM, and more—using TapClicks’ extensive library of over 10,000 connectors. This ensures all campaign data flows into one unified platform, saving hours of manual aggregation and eliminating data silos.
Step 2: Define Your Campaign KPIs
Identify the key performance indicators that matter most to your goals or client objectives. Typical metrics include impressions, clicks, conversions, spend, cost per acquisition, and ROI. TapClicks makes it simple to select and customize these KPIs for each dashboard, whether you’re tracking paid media, organic social, or cross-channel performance.
Step 3: Select Widgets and Visualization Types
With your data flowing in, it’s time to visualize results. TapClicks offers a drag-and-drop dashboard builder featuring a wide array of widgets—bar charts, line graphs, geo maps, funnel visualizations, scorecards, and more. Best practice: use scorecards for at-a-glance KPIs, trend lines for performance over time, and pie charts for channel or campaign breakdowns. Mix and match visualizations to make insights easily digestible for your intended audience.
Step 4: Customize Layouts and Drill-Downs
Organize widgets to reflect the narrative of your campaign—top-level summaries at the top, deeper dives below. TapClicks supports dashboard tabs, filters, and drill-down links so users can explore data by channel, date range, or even individual ad sets. Leverage this flexibility to provide both executive summaries and granular details in a single view.
Step 5: Automate Data Refresh & Reporting
Once your dashboard is live, TapClicks continuously pulls and updates data in near real time. Set up scheduled reports—daily, weekly, monthly—or enable on-demand access for clients and stakeholders. With TapClicks’ automated email delivery, you can ensure reports hit inboxes right when decisions need to be made.
Step 6: Add AI-Powered Insights
Unlock deeper value by activating TapClicks’ AI features. The platform can surface anomalies, performance trends, budget pacing alerts, and optimization recommendations directly within your dashboard. These built-in insights help marketers move from raw data to action faster, with less manual analysis.
For a detailed walkthrough showcasing these steps in action—and how AI takes TapClicks dashboards to the next level—check out "Real-time reporting with AI".
By following these best practices, you’ll create campaign dashboards that not only centralize your data, but empower your team to make smarter, faster decisions. To see TapClicks in action or start building your own dashboard, visit TapClicks.
Choosing the Right Marketing Automation Software
Selecting the right marketing dashboard automation software is a strategic decision that can shape your team’s efficiency, insight quality, and scalability as your data landscape grows. Here’s what to prioritize as you compare solutions:
1. Comprehensive Data Connectivity
The foundation of any robust marketing dashboard lies in its ability to connect seamlessly with the platforms you use—think ad networks, social media, web analytics, CRM, and beyond. Look for platforms that offer a wide array of pre-built connectors (ideally thousands), as well as custom integration options, so you’re not limited by your tech stack. TapClicks, for example, stands out with over 10,000 smart connectors, ensuring you can unify virtually any data source without manual wrangling.
2. Automated, Flexible Workflows
Manual data pulls, spreadsheet gymnastics, and repetitive reporting tasks can drain your team’s resources. The best solutions feature automated ETL/ELT pipelines, drag-and-drop dashboard builders, and scheduled report generation. This reduces errors, saves time, and empowers marketers to focus on strategy, not spreadsheet maintenance. Platforms like TapClicks automate the full workflow, from data ingestion to branded report delivery, making it easy to scale reporting across hundreds of clients or locations.
3. AI-Driven Insights & Recommendations
Modern dashboard tools should do more than visualize data—they should help you interpret it. AI-powered features, such as predictive analytics, anomaly detection, and automated campaign scoring, turn raw numbers into actionable guidance. TapClicks’ AI agents, for instance, analyze dashboards to surface optimization opportunities, budget pacing alerts, and performance benchmarks, giving you a competitive edge.
4. Customization & Scalability
Every organization is different. Prioritize tools that let you customize dashboards, reports, and access levels for distinct users—whether internal teams or clients. Scalable platforms like TapClicks are designed to handle thousands of dashboards and users simultaneously, making them ideal for agencies, media companies, and enterprise brands managing complex, multi-channel campaigns.
5. Seamless Data Centralization
Centralizing your marketing data breaks down silos and enables cross-channel analytics. The right software should normalize, blend, and enrich data from different sources, providing a single source of truth for campaign performance and ROI measurement. TapClicks excels here, providing advanced data enrichment and normalization tools for comprehensive, multi-location, and multi-platform reporting.
How TapClicks Compares
While many competitors—such as Funnel.io, Adverity, and Agency Analytics—offer point solutions for data integration or visualization, TapClicks differentiates itself by combining unified scale, powerful AI insights, and end-to-end workflow automation. Lightweight tools may suffice for basic needs, but for agencies and enterprise teams looking to consolidate operations, automate at scale, and unlock AI-driven decision support, TapClicks is a marketing OS built for the future.
In summary, the right marketing dashboard automation software combines deep connectivity, workflow automation, AI-powered insights, and flexible scalability. Prioritizing these features will ensure your team can move faster, deliver more value, and make smarter marketing decisions with every campaign.
Conclusion
Marketing dashboard automation is no longer a luxury—it's an essential driver of success for modern marketing teams. By unifying real-time analytics, AI-powered insights, and automated workflows, teams can make data-driven decisions faster, eliminate manual reporting headaches, and deliver more value to stakeholders. Platforms like the TapClicks marketing dashboard exemplify this transformation, offering a single source of truth for multi-channel campaign performance, predictive analytics, and automated, client-ready reporting at scale.
Whether you manage dozens of clients or oversee campaigns across multiple locations, embracing marketing dashboard automation empowers you to stay agile and ahead of the competition. Ready to see the impact for yourself? Explore the TapClicks platform to discover how real-time analytics and AI can elevate your marketing operations—request a demo or start your free trial today.
Start Automating Your Marketing Data Today!
No Credit Card Required.

