

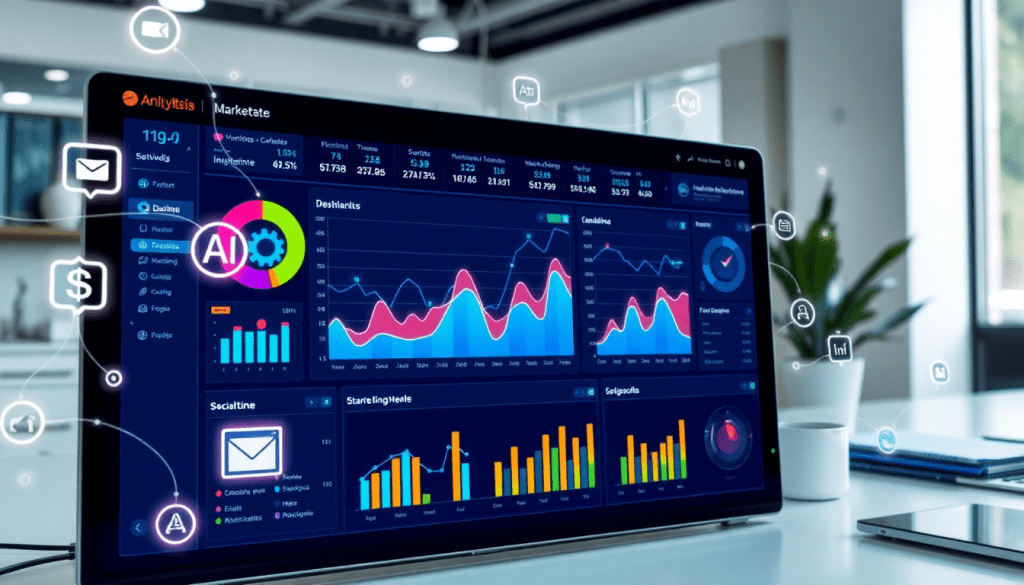
Marketing Dashboard Automation: Real-Time Analytics & AI
For marketers and agencies managing complex campaigns, manual reporting and scattered data can slow down growth and decision-making. Marketing dashboard automation streamlines these processes—centralizing data, enabling real-time analytics, and leveraging AI for smarter, faster insights. With platforms like TapClicks, teams can automate multi-channel reporting, build cross-platform dashboards, and unlock advanced features that save hours while improving campaign performance. This guide explains the fundamentals of marketing dashboard automation and explores how AI-driven solutions make reporting and analytics easier, more actionable, and scalable.
What Is Marketing Dashboard Automation?
Marketing dashboard automation is the process of using technology to automatically collect, unify, and visualize marketing data from multiple sources—eliminating manual spreadsheet updates and enabling real-time, always-on reporting. At its core, it combines automated data integration, ETL/ELT pipelines (Extract, Transform, Load), and customizable dashboards to provide a single source of truth for all marketing activities.
Traditionally, marketers and agencies relied on manual processes: exporting data from platforms like Google Ads, Facebook, or Mailchimp, then copying it into spreadsheets for analysis and reporting. This approach is time-consuming, prone to human error, and makes it hard to deliver timely insights. Marketing dashboard automation transforms this workflow. Modern platforms connect directly to thousands of marketing, advertising, and business tools, pulling in data automatically, normalizing it, and updating dashboards in real time.
The shift from manual reporting to automated, real-time dashboards brings several key benefits:
- Speed and Efficiency: Automated systems eliminate repetitive work, saving teams dozens of hours each month and enabling them to focus on strategy and optimization.
- Accuracy: By reducing manual data entry, the risk of reporting errors drops significantly—improving trust in campaign performance data.
- Scalability: As marketing activities scale across channels, clients, or locations, automated dashboards handle increased complexity without added effort.
- Data Centralization: All campaign, spend, and performance data is unified in one place, giving teams a holistic view and making cross-channel analysis much easier.
To learn more about the fundamentals and real-world advantages of marketing dashboard automation, check out the TapClicks overview of marketing dashboard automation.
Why Centralizing Marketing Data Matters
Modern marketing teams are up against an endless list of platforms and channels—think Google Search, Facebook Ads, programmatic display, email campaigns, influencer networks, and more. Each of these tools churns out its own data, usually in unique formats and separate dashboards. The result? A fragmented data landscape that makes true marketing insights hard to achieve.
Let’s break down why centralizing your marketing data changes the game:
The Headaches of Siloed Data
- Countless hours lost manually collecting, cleaning, and reconciling data from different sources
- Inconsistent metrics across platforms, leading to confusion and reporting errors
- Delayed reporting that slows down optimization and decision-making
- Missed opportunities because marketers are stuck wrangling spreadsheets instead of analyzing results
How Centralization Solves These Problems
When you bring all campaign data into one source of truth, you get:
- Side-by-side channel comparison: Instantly see how search, social, display, email, and other channels stack up
- Reliable analytics: Everyone works from the same numbers—no more “whose report is right?”
- Comprehensive, automated reports: Dashboards and insights, no manual wrangling required
- Elimination of data silos: Reduced errors and smoother collaboration across teams
- Faster, smarter decisions: Spot trends, attribute results, and pivot campaigns quickly
What Centralized Data Actually Enables
Imagine having all your marketing performance in a single dashboard. Here’s what you can do:
| Challenge | With Centralized Data | Without Centralized Data |
|---|---|---|
| Attribution | Connect touchpoints easily | Guesswork and manual mapping |
| Trend Analysis | Spot cross-channel patterns | Siloed, incomplete insights |
| Budget Optimization | See ROI in real time | Lagging, error-prone updates |
| Stakeholder Alignment | One source of truth | Conflicting reports |
TapClicks: Built for Unified Marketing Data
TapClicks is designed to make centralized marketing data a reality at scale. Here’s how:
- 10,000+ data connectors: Seamlessly integrate all your campaign, advertising, and business platforms
- Automated ETL/ELT pipelines: Extract, transform, and load data with zero manual effort
- Dataset blending and normalization: Get cross-channel analytics that actually make sense
- Automated, branded reporting: Deliver polished reports to clients and stakeholders in a fraction of the time
By centralizing data with TapClicks, marketing teams don’t just save time—they gain the full-funnel visibility needed to connect the dots, optimize campaigns on the fly, and clearly demonstrate ROI.
Move faster. See deeper. Deliver results that matter.
Key Features of Automated Reporting Workflows
Modern marketing teams juggle dozens—sometimes hundreds—of data sources, platforms, and campaigns. Automated reporting workflows are the backbone of marketing dashboard automation, providing the structure and intelligence needed to transform tangled data streams into clear, actionable insights. Here are the essential features that define best-in-class automated reporting workflows:
1. Robust Data Connectors and ETL/ELT Automation
The foundation of automated reporting lies in the breadth and depth of data integrations. Platforms like TapClicks offer thousands of pre-built connectors that seamlessly ingest data from advertising, social, search, CRM, and analytics platforms. Automated ETL/ELT (Extract, Transform, Load/Extract, Load, Transform) pipelines ensure that raw data is not only collected, but also cleaned, normalized, and prepared for analysis—without hours of manual spreadsheet work. This process enables marketers to blend cross-channel, multi-location, or multi-client data with consistency and reliability.
2. Automated Report Scheduling and Delivery
Scheduling is a game-changer for time-strapped analysts and agencies. Automated report scheduling lets teams set up recurring, branded reports that are delivered to stakeholders on a daily, weekly, or monthly cadence—no need to rebuild dashboards or export data manually. This not only saves significant time but also minimizes the risk of human error and ensures that decision-makers always have the latest insights at their fingertips.
3. Role-Based Access and Collaboration Tools
As marketing operations scale, secure and flexible access is crucial. Role-based access allows agencies, brands, and enterprise teams to control who can view, edit, or share dashboards and reports. Whether it’s providing clients with self-serve dashboards or enabling collaboration between sales, ops, and fulfillment teams, these permissions streamline workflows and foster transparency.
4. AI-Powered Dashboard Creation and Insights
Automation doesn’t stop at data collection and scheduling—AI now augments every step of the reporting workflow. AI-powered dashboard creation accelerates time-to-insight by recommending visualizations, surfacing anomalies, and even generating narrative summaries. TapClicks, for example, employs AI agents that proactively scan campaign data, flag performance shifts, and send curated SmartEmail insights directly to stakeholders, enabling faster and smarter marketing decisions.
To see how these features work together in a real-world context, check out this guide on real-time reporting and AI automation with TapClicks.
Automated reporting workflows do more than save time—they unlock scalable, intelligent analytics that empower marketers to focus on strategy, not spreadsheets. For organizations looking to elevate their operations, these features are no longer optional; they’re essential building blocks for success in a data-driven landscape.
Real-Time Marketing Analytics: Turning Data into Action
In today’s fast-paced digital landscape, waiting days—or even hours—for campaign data can mean missed opportunities and wasted ad spend. Real-time marketing analytics transform this dynamic, allowing marketers and agencies to monitor performance as it happens and pivot strategies instantly for maximum impact.
With real-time analytics, teams gain immediate visibility into campaign health across every channel: search, social, display, programmatic, email, and more. Instead of relying on static reports or outdated spreadsheets, a live campaign performance dashboard empowers marketers to proactively identify trends, troubleshoot issues, and capitalize on what’s working—before competitors even notice.
For example, TapClicks dashboards feature intuitive visualizations such as time-series graphs for spend and conversions, geo heatmaps for location-based results, and cross-channel performance comparisons. Marketers can drill into metrics like CTR, CPA, ROAS, and customer acquisition cost at any level—global, regional, or even down to individual campaigns—enabling granular optimization.
This level of insight is only possible when your dashboard builder supports true cross-platform integration. TapClicks’ platform lets users combine Google Ads, Facebook, LinkedIn, email, and countless other data sources in a single, customizable view. With real-time data streaming in, marketing teams can set threshold-based alerts, instantly share up-to-date dashboards with stakeholders, and automate recurring performance reviews—all from a unified, interactive interface.
By leveraging real-time analytics, organizations not only stay agile but also foster a culture of continuous improvement—where every decision is data-driven and every campaign is primed for success. To learn more about how TapClicks enables real-time reporting and AI automation, check out their guide on real-time reporting with AI.
AI-Powered Dashboard Creation: Beyond Traditional Reporting
Traditional marketing reporting often means hours spent wrangling spreadsheets, manually pulling data, and struggling to spot trends or outliers before they impact performance. AI-powered dashboard creation, however, fundamentally changes this dynamic—bringing automation, deeper insights, and actionable recommendations right to the marketer’s fingertips.
With platforms like TapClicks, artificial intelligence is woven directly into the dashboard experience. Instead of just visualizing yesterday’s numbers, TapClicks’ AI agents proactively analyze data as it streams in, surfacing meaningful insights without human prompting. For example, AI-driven anomaly detection flags unexpected spikes or drops in campaign metrics, alerting teams to issues or opportunities in real time. This goes hand-in-hand with automated insight generation, which summarizes key findings and trends—turning complex cross-channel data into digestible, client-ready narratives.
TapClicks also elevates campaign optimization with tools like campaign scoring and predictive analytics. The platform’s AI models benchmark performance, identify what’s working (and what isn’t), and recommend budget pacing adjustments to maximize ROI. Instead of reactive, backward-looking reports, marketers and agencies can move to a proactive, data-backed workflow—making changes before minor issues become costly mistakes.
The contrast with manual reporting is stark: where traditional workflows demand constant vigilance and repetitive effort, AI-powered reporting workflows in TapClicks are hands-off and scalable. Automated dashboards update in real time, while AI agents deliver tailored recommendations directly via email or dashboard notifications. This not only saves dozens of hours per month but also empowers marketers to focus on high-value strategy rather than data wrangling.
To see how TapClicks makes AI-powered reporting easy—and how it can transform your marketing analytics—explore their overview of AI-powered reporting tools. The future of marketing dashboard automation isn’t just about reporting faster; it’s about reporting smarter and making better decisions, all with the help of AI.
Building and Customizing Your TapClicks Marketing Dashboard
Setting up a TapClicks marketing dashboard is all about ease, flexibility, and scale—whether you’re supporting hundreds of agency clients or overseeing campaigns across dozens of brand locations. Here’s how to get started and shape your dashboard to fit your needs:
Getting Your Data Connected—Fast
TapClicks makes data integration effortless:
- 10,000+ Connectors: Instantly pull in data from marketing, advertising, and business platforms—no more manual data wrangling.
- Smart Connectors: Need a custom data source? Build your own integrations with a simple point-and-click interface (no code required).
- Automated Data Flow: Ensure every dashboard is powered by up-to-date, unified data—eliminating spreadsheets for good.
Tailoring Dashboards for Every Audience
Personalize dashboards by use case:
| Audience | What to Customize | Key Features |
|---|---|---|
| Clients | White-label branding, KPI-focused views, role-based access | Branded dashboards, client-specific data, granular permissions |
| Internal Teams | Channel, campaign, or regional breakdowns | Custom widgets, grouped insights, operational tracking |
| Campaigns | Goal tracking, budget pacing, real-time performance | Cross-channel views, live updates, alerts for anomalies |
Tips:
- Use drag-and-drop builders to assemble widgets, charts, and tables.
- Group related data for easy scanning.
- Set permissions so everyone sees just what they need.
Jumpstart with Templates and Branding
Save time and stay on brand:
- Pre-Built Templates: Launch dashboards for multi-location, social, or client reporting in minutes.
- Customization: Upload your logo, apply your color palette, and use custom fonts for a seamless stakeholder experience.
- Cross-Platform Data: Blend sources like Google Ads, Meta, programmatic, email, and even offline—side-by-side, at scale.
Scale and Automate Like a Pro
Efficiency at every step:
- Clone Templates: Duplicate dashboards for new clients or campaigns with a click.
- Automated Scheduling: Set dashboards and reports to go out to the right people—no manual follow-up.
- Adapt and Grow: Whether you’re managing ten dashboards or ten thousand, TapClicks scales effortlessly.
Ready to see what you can build?
Visit TapClicks’ official website for more resources, demos, and support.
Use Cases: Marketing Dashboard Automation in Action
Marketing dashboard automation isn’t just a buzzword—it’s a catalyst for transformation across agencies, brands, and enterprise marketing teams. Here’s how organizations are leveraging automated workflows to boost performance, drive client satisfaction, and reclaim valuable hours each month.
Agencies: Scaling Client Reporting with Ease
Agencies managing dozens or even hundreds of clients often struggle with manual reporting, leading to bottlenecks and inconsistencies. By implementing TapClicks, one digital agency unified all their client data across search, social, display, and programmatic channels, creating branded dashboards for each client with automated report scheduling. This shift eliminated more than 60 hours of manual work per analyst per month, allowing the team to focus on campaign optimization instead of spreadsheet wrangling. With TapClicks’ role-based access and customizable dashboards, clients received timely, accurate insights—improving transparency and deepening trust.
Brands: Multi-Location Visibility and Optimization
A multi-location retail brand faced challenges aggregating performance data from dozens of regions and marketing platforms. By centralizing their data in TapClicks, the brand gained a unified view of KPIs across all locations. Automated dashboards enabled marketing leaders to spot underperforming regions in real time and reallocate budgets proactively. The AI-driven insight engine flagged anomalies—such as sudden drops in web traffic or spikes in ad spend—empowering the team to act before minor issues became costly problems. As a result, the brand increased campaign ROI and reduced reporting errors, while shrinking weekly analytics prep from days to hours.
Enterprise Teams: Feeding Data to the Organization
Enterprise marketing teams often need to deliver clean, validated data to business intelligence (BI) tools and executive stakeholders. One Fortune 500 company used TapClicks as their marketing data hub, automatically ingesting data from 50+ sources and pushing normalized, enriched datasets into Tableau and Power BI. Automated workflows ensured that every business unit—and their external agencies—worked from a single source of truth. This eliminated costly reconciliation efforts, reduced the risk of reporting discrepancies, and made cross-channel performance analysis seamless.
Actionable Insights and Client Satisfaction
What unites these use cases is the shift from reactive to proactive marketing. Automated dashboards deliver real-time, actionable insights to the right stakeholders, at the right time. Whether it’s an agency account manager sending AI-curated campaign summaries through SmartEmail, or a brand leader using predictive budget pacing, TapClicks empowers teams to optimize faster and communicate results more clearly. The result? Happier clients, more efficient teams, and better business outcomes.
Explore how your organization can achieve similar results by learning more about TapClicks’ unified marketing operations platform.
Getting Started with Marketing Dashboard Automation
Transitioning to automated marketing dashboards can feel daunting, but the right approach makes implementation smooth and rewarding. Here’s a practical step-by-step guide to help you evaluate, select, and roll out marketing dashboard automation for your organization:
1. Assess Your Needs and Data Sources
Start by mapping out your current reporting workflows. Identify all channels, platforms, and sources of marketing data—think paid search, social, display, email, and offline. Determine which metrics and dashboards are most critical for your teams and clients, and pinpoint where manual processes and data gaps slow you down.
2. Evaluate Automation Platforms
Research solutions that offer robust data integration, flexible dashboarding, and advanced automation. Look for platforms like TapClicks that support a wide range of connectors, automated ETL/ELT, role-based access, and AI-powered insights. Request demos, trial accounts, and customer references to see how each option handles your specific requirements.
3. Plan for Integration and Onboarding
Work with your IT and analytics stakeholders to outline how the platform will ingest, normalize, and centralize your marketing data. Assign owners for key tasks, such as connecting data sources, customizing dashboards, and establishing report automation schedules. TapClicks, for example, offers onboarding support and professional services to accelerate this phase.
4. Train Teams and Align Processes
Ensure all users—analysts, account managers, and clients—are comfortable with the new dashboards and workflows. Provide hands-on training for dashboard customization, automated reporting, and leveraging AI-driven insights. Establish clear policies for user access and report distribution to maximize transparency and efficiency.
5. Customize for Clients and Campaigns
Use templates and branding options to tailor dashboards for each client or business unit. Take advantage of cross-platform integration and visualization tools to present unified, actionable views of campaign performance. With TapClicks, you can easily scale reporting across hundreds of clients or locations.
6. Measure, Iterate, and Expand
Track adoption, user satisfaction, and time savings as you roll out automated dashboards. Gather feedback from stakeholders to refine your processes and expand coverage to new channels or teams. Leverage AI insights and predictive analytics to move beyond reporting and drive proactive marketing optimizations.
Ready to Automate Your Marketing Reporting?
Explore how TapClicks’ unified marketing operations platform can centralize your data, automate complex reporting, and deliver actionable insights at scale. To learn more about best-in-class marketing dashboard automation, visit the TapClicks website and discover how leading agencies and brands streamline their analytics with AI-powered automation.
Start Automating Your Marketing Data Today!
No Credit Card Required.

