

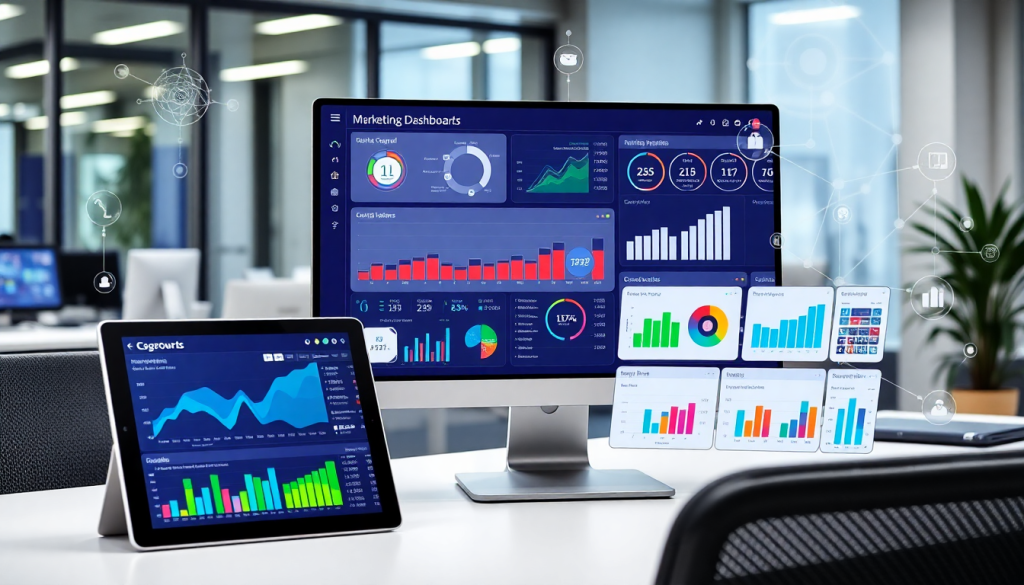
Marketing Dashboard Automation: AI-Powered Reporting Made Easy
Modern marketing teams are managing more channels, data, and campaigns than ever before. Manually building reports or updating dashboards can quickly become overwhelming and error-prone. Marketing dashboard automation—especially when powered by AI—solves these challenges by centralizing data, automating reporting workflows, and delivering real-time, actionable insights across all your channels. This guide explores how businesses can leverage tools like the TapClicks marketing dashboard to streamline analytics, save time, and unlock smarter decision-making.
What Is Marketing Dashboard Automation?
Marketing dashboard automation is the process of using technology to centralize, update, and deliver marketing data and reports without manual intervention. In today’s digital landscape, marketing teams juggle campaigns across countless platforms—social, search, display, email, and more. Manually pulling data from each source, formatting spreadsheets, and building reports not only consumes valuable time but also introduces risk for human error. Automated marketing dashboards eliminate these pain points by acting as a single, always-current source of truth for campaign performance.
At its core, marketing dashboard automation relies on three main components:
1. Data Aggregation: Automated dashboards pull data from multiple channels and platforms into one unified view. This aggregation breaks down silos, ensures consistency, and provides holistic visibility across all marketing efforts.
2. Automated Updates: Instead of relying on manual refreshes or ad-hoc data pulls, automated dashboards continuously ingest new data. This means your reports are always up to date—whether you need a daily snapshot or real-time campaign tracking.
3. Scheduled Delivery: Modern solutions let you schedule report distribution to stakeholders, eliminating the need to compile and send updates manually. Teams, clients, and executives receive timely, relevant insights without chasing down analysts for the latest numbers.
The impact is profound: automated reporting workflows significantly outperform manual processes when it comes to accuracy, time savings, and scalability. For example, with a platform like TapClicks, marketing teams can automate the entire reporting lifecycle—freeing up 50+ hours per analyst each month to focus on strategy and optimization rather than data wrangling.
A major advancement in this space is AI-powered dashboard creation, which leverages artificial intelligence to not just collect and visualize data but also surface insights, spot trends, and recommend next steps. By combining automation with AI, modern marketing dashboards become proactive partners in campaign management—empowering teams to make smarter, faster decisions and maximize ROI.
How AI Transforms Marketing Dashboard Creation
AI-powered marketing dashboards represent a leap forward from traditional, static reporting tools. With artificial intelligence at the core, the dashboard creation process becomes not only faster but also significantly more insightful. Here’s how AI is reshaping the entire lifecycle of dashboard automation—from data ingestion to delivering actionable recommendations.
First, AI streamlines data ingestion and normalization. Instead of manually collecting and cleaning data from dozens of sources, intelligent connectors leverage machine learning to automatically unify campaign, advertising, and sales data. This enables marketing teams to bring together disparate datasets—think Google Ads, Facebook, programmatic, CRM data, and more—without wrestling with inconsistent formats or duplicate entries. The result is a single, trustworthy source of truth that updates in real time.
Once data is aggregated, AI steps in to power smart visualization. Rather than relying on static charts that require manual tweaking, modern dashboards use algorithms to surface the most relevant metrics and trends for each user. For example, AI can automatically highlight which campaigns are underperforming, visualize spend versus ROI over time, or even suggest which KPIs warrant the most attention. This adaptive approach ensures every stakeholder, from executives to analysts, gets a dashboard tailored to their needs—without hours spent on customization.
Even more transformative is the way AI identifies trends, flags anomalies, and generates insights proactively. Instead of waiting for a marketer to dig through reports, AI agents scan campaign data to spot unusual spikes in spend, sudden drops in engagement, or channels outperforming benchmarks. These findings are delivered as plain-language recommendations—sometimes directly to your inbox via tools like SmartEmail—so teams can take action faster and with greater confidence.
Predictive analytics is another area where AI shines. By analyzing historical data and campaign variables, AI models forecast future performance, budget pacing, and potential risks. This empowers teams to make smarter decisions about where to allocate spend, how to optimize campaigns, and what results to expect—before the data even arrives. Such capabilities are particularly valuable in fast-moving, multi-channel environments where early intervention can make or break a campaign.
For a deeper dive into how AI tools enhance dashboard automation, check out these AI tools for dashboard automation. And if you’re looking to bring these benefits to your organization, the TapClicks marketing dashboard offers a comprehensive platform to unify your data, automate workflows, and harness AI for better marketing outcomes.
The Benefits of Multi-Channel Data Aggregation
In today’s fragmented digital landscape, marketing teams juggle campaigns across platforms like Google Ads, Facebook, TikTok, programmatic display, email, and dozens more. Each channel generates valuable data, but when that data is siloed, marketing insights are incomplete and decision-making suffers. This is why marketing data centralization—bringing all your disparate data sources into one unified dashboard—is now essential for modern teams.
Multi-channel data aggregation enables holistic campaign analysis, revealing the true performance of your marketing investments across every touchpoint. Instead of logging into multiple platforms and manually piecing together results, teams can view unified campaign metrics, spot trends, and compare channels side by side. This consolidated approach not only eliminates hours of tedious work, but also reduces errors, ensuring stakeholders always have access to accurate, up-to-date insights.
TapClicks excels as a cross-platform dashboard builder, simplifying the integration process with over 10,000 ready-to-use marketing, advertising, and business data connectors. Whether you’re managing local campaigns for dozens of clients or analyzing enterprise-scale omnichannel initiatives, TapClicks automates data ingestion, normalization, and blending. This means you can track your paid, owned, and earned media all in one place—no more data silos or manual wrangling.
Other marketing automation software, such as Funnel.io and Adverity, also facilitate multi-channel data aggregation, but TapClicks stands out by offering not only robust integrations but also built-in AI-powered analytics, workflow automation, and customizable reporting. This all-in-one approach turns your multi-channel data into a single source of truth, empowering teams to make faster, smarter decisions and demonstrate ROI with clarity.
To see how you can centralize your marketing data and simplify campaign reporting, explore the TapClicks marketing dashboard.
Real-Time Analytics and Automated Reporting Workflows
In the fast-paced world of digital marketing, having access to real-time analytics is no longer a luxury—it’s a necessity for effective campaign optimization. Real-time marketing analytics enable teams to monitor campaign performance as it happens, empowering them to make swift, data-driven decisions that can significantly improve outcomes. Whether it’s adjusting creative, reallocating budget, or spotting an underperforming channel, instant access to up-to-date metrics can be the difference between a missed opportunity and a marketing win.
Automated reporting workflows take this a step further by eliminating the manual drudgery of compiling and distributing reports. Instead of spending hours each week exporting data, updating spreadsheets, and formatting presentations, marketers can set up report scheduling automation to deliver the right insights to the right stakeholders—on time, every time. This not only frees up valuable analyst resources but also ensures that teams and clients are always working with the freshest data possible.
TapClicks streamlines these processes with powerful automation tools designed for scale. Its platform aggregates data from over 10,000 sources, updates dashboards in real time, and enables users to schedule automated report delivery—saving teams dozens of hours each month. Advanced features like AI-driven insights and SmartEmail ensure that users receive not just data, but also actionable recommendations, directly in their inbox or preferred workflow. This level of automation means marketers can shift their focus from tedious manual tasks to strategic decision making.
For a deeper look into how AI enhances real-time reporting and automation, explore real-time reporting with AI. With solutions like TapClicks, marketing teams can achieve true visibility, agility, and efficiency in their analytics and reporting workflows.
Building and Customizing Campaign Performance Dashboards
A well-designed campaign performance dashboard is the backbone of data-driven marketing. Here’s how to create one that delivers real value—and how TapClicks makes it easier than ever.
Step 1: Define Your Dashboard Goals and Audience
Start by clarifying the purpose of your dashboard. Are you tracking high-level KPIs for executives, digging into channel performance for analysts, or providing transparent results for clients? Your audience will shape the data you include and how you visualize it.
Tip: For executives, focus on concise, high-impact metrics like ROI, spend pacing, and top-performing channels. Analysts may need more granular views, such as campaign segmentation or creative-level performance. Clients often appreciate visual summaries with clear results and actionable recommendations.
Step 2: Connect and Aggregate Data Sources
Next, unify your marketing data. With TapClicks, you can leverage 10,000+ built-in connectors to instantly pull in data from ad platforms, social media, web analytics, CRM tools, and more. This eliminates manual data wrangling, ensuring your dashboard is always up to date and comprehensive.
Step 3: Build with Drag-and-Drop Simplicity
TapClicks’ drag-and-drop dashboard builder lets you assemble charts, tables, and widgets in minutes—no coding required. Select the data points that matter, arrange them intuitively, and apply your brand’s colors and logos for a polished look. For agencies and brands managing multiple clients or locations, you can easily clone templates and customize views for each audience.
Step 4: Customize for Role-Based Access
Set up role-based permissions so each stakeholder sees what’s most relevant to them. Executives can access a high-level overview; operations teams can drill into workflow data; clients can view only their own campaign results. This tailored access ensures clarity and security.
Step 5: Visualize for Clarity and Action
Effective dashboards don’t just show data—they tell a story. Use TapClicks’ visualization tools to highlight trends, flag anomalies, and spotlight wins or areas for optimization. Incorporate performance tracking widgets—such as budget pacing, goal progress, and conversion funnels—to keep teams focused on what matters.
Best Practice: Limit each dashboard to the most actionable metrics. Use color coding, benchmarks, and annotations to make insights pop. Schedule automated reports so stakeholders get updates without hunting for information.
Step 6: Iterate and Optimize
Campaign dashboards should evolve alongside your goals. Review usage patterns and stakeholder feedback regularly. With TapClicks, you can adjust data sources, add new KPIs, or refine visualizations on the fly—empowering your team to stay agile and data-driven.
To see these capabilities in action, visit TapClicks and discover how easy it is to build, brand, and automate campaign dashboards that drive results.
What Really Matters When Choosing Marketing Automation Software
Finding the right marketing automation platform isn’t about chasing the latest buzzwords—it’s about identifying features that will help your team operate at scale, automate reporting, and deliver real results. Here’s a breakdown of the capabilities that make a difference, especially for agencies, media companies, and multi-location brands.
Must-Have Features (and Why They Matter)
1. Connect to Everything—No More Manual Data Wrangling
- Look for:
- Extensive library of pre-built data connectors
- Automated data pulls from all major marketing, advertising, and business sources
- Why it matters:
The more native connectors, the less time you spend on tedious manual imports. - TapClicks Example:
- 10,000+ marketing and business data connectors
- Ingests campaign data from virtually any platform automatically
2. Dashboards That Tell Your Story—Visually and Clearly
- Look for:
- Drag-and-drop dashboard builders
- Branding and customization options
- Role-specific views (executive, analyst, client, etc.)
- Why it matters:
You need dashboards that resonate with every audience, from CMOs to clients to your own ops team. - TapClicks Example:
- Intuitive dashboard studio
- Rich visualization libraries and branded templates
3. Safe, Smart Access for Everyone
- Look for:
- Role-based access controls
- Granular permissions for agencies, brands, and clients
- Why it matters:
Secure collaboration is key, especially when managing dozens or hundreds of clients. - TapClicks Example:
- Fine-grained sharing, so users only see what’s relevant
4. Scalable Performance—Ready for Growth
- Look for:
- Ability to handle thousands of dashboards and users
- Reliable automation for reports and data updates
- Why it matters:
Your tool should grow with you—no slowdowns as you scale up. - TapClicks Example:
- Built for high-volume, multi-client operations
5. Unified, Cross-Channel Insights
- Look for:
- Cross-platform dashboard building
- Ability to blend data from paid, organic, offline, and more
- Why it matters:
Marketing is multi-channel. Your reporting should be, too. - TapClicks Example:
- All-in-one dashboards for holistic campaign analysis
6. Automate the Busywork—Focus on Strategy
- Look for:
- Automated reporting and data refresh scheduling
- Workflow tools for campaign and order management
- Why it matters:
Free up your analysts to focus on optimization, not manual report generation. - TapClicks Example:
- Scheduled, automated reports and dashboards
How TapClicks Sets Itself Apart
| Feature | TapClicks | Funnel.io | Agency Analytics | Supermetrics |
|---|---|---|---|---|
| Data Connectors | 10,000+ | 500+ | 70+ | 100+ |
| Dashboard Customization | Full/Branded | Moderate | Basic | Limited |
| Role-Based Permissions | Advanced | Basic | Moderate | None |
| Scalability | Enterprise-Grade | SMB/Enterprise | SMB | SMB |
| Automated Workflows | Yes | Limited | Limited | No |
| AI-Powered Insights | Yes | No | No | No |
Quick Checklist Before You Decide
- Does it connect directly to all your key marketing and business platforms?
- Can you tailor dashboards for every audience—internal and client-facing?
- Is there robust access control for secure, scalable collaboration?
- Will it keep up as your team, clients, and data volumes grow?
- Does it blend multi-channel data into unified, actionable views?
- Does it automate report delivery, so you can focus on strategy?
For a deeper look at how TapClicks delivers on every front, check out the TapClicks website. Choosing a platform with these capabilities sets your team up for smarter, faster, and more strategic marketing operations.
Overcoming Common Challenges in Dashboard Automation
While marketing dashboard automation offers transformative benefits, many organizations encounter roadblocks on the path to seamless reporting. The most common hurdles include data silos, integration headaches, and inconsistent metrics—each of which can derail the promise of unified, actionable insights. Fortunately, with the right strategies and tools, these challenges can be effectively managed.
Breaking Down Data Silos:
A major obstacle for many marketing teams is fragmented data spread across platforms (think Google Ads, Facebook, CRM systems, and more). These silos prevent teams from seeing the full picture and can lead to duplicated or conflicting information. To overcome this, prioritize solutions—like TapClicks—that offer extensive data connectors and automated data enrichment. By blending disparate datasets into a single source of truth, TapClicks ensures all channels contribute to holistic campaign analysis.
Simplifying Integrations:
Integrating dozens (or even hundreds) of marketing data sources can be overwhelming, especially when APIs change or platforms update their schemas. Look for platforms that provide plug-and-play connectors and "smart" ETL pipelines that adapt to changing data structures. TapClicks’ Smart Connectors, for example, automatically map and normalize incoming data, reducing manual intervention and minimizing breakages.
Ensuring Consistent Metrics:
Discrepancies in metric definitions—such as what counts as a conversion or how engagement is measured—can undermine dashboard trust. To maintain consistency, establish clear metric definitions across teams, and use dashboard tools that allow centralized mapping and standardization. TapClicks’ data enrichment features help normalize metrics, so everyone—from analysts to clients—operates with the same reliable data.
Troubleshooting Automated Reporting Workflows:
Automated report scheduling can sometimes fail due to data refresh lags, permission issues, or integration outages. To troubleshoot, regularly audit scheduled reports for completeness and timeliness. Utilize notification systems that alert you to automation errors, and maintain clear documentation for resolving common issues—such as reconnecting data sources or adjusting report filters after platform updates.
Best Practices for Reliable Dashboards:
- Schedule regular data audits to catch inconsistencies early.
- Assign clear data ownership for each integration point.
- Document all metric definitions and dashboard structures.
- Leverage platform support resources and communities to stay ahead of changes.
By proactively addressing these common issues, marketing teams can ensure their dashboard automation delivers on its promise: accurate, up-to-date, and actionable insights that drive smarter decisions. For a deeper dive into real-time reporting best practices and troubleshooting, explore real-time reporting with AI.
Getting Started with TapClicks Marketing Dashboard
Ready to transform your marketing operations with automated, AI-powered dashboards? Getting started with the TapClicks marketing dashboard is a straightforward process designed to deliver value from day one—whether you’re an agency managing hundreds of clients or an enterprise brand centralizing multi-channel data. Here’s how to hit the ground running:
Step 1: Set Up Your TapClicks Account
Begin by signing up for a TapClicks account. TapClicks offers guided onboarding to help you tailor the platform to your specific needs, from data sources to reporting preferences. Once logged in, you’ll access a unified dashboard that serves as your central command center.
Step 2: Connect Your Data Sources
TapClicks makes it easy to integrate your marketing, advertising, and business data with over 10,000 out-of-the-box connectors. Use the intuitive Smart Connectors to link platforms like Google Ads, Facebook, programmatic platforms, CRM systems, and more. For custom data sources, TapClicks supports flexible ETL/ELT pipelines and enrichment tools—ensuring all your data is unified and campaign-ready.
Step 3: Migrate Existing Reports and Dashboards
If you’re transitioning from spreadsheets or another reporting tool, TapClicks streamlines migration. Import historical data and reports, then leverage the drag-and-drop dashboard builder to recreate or enhance your existing views. Branded templates and customizable widgets make it easy to tailor dashboards for executives, analysts, or clients without starting from scratch.
Step 4: Automate Reporting and Insights
Set up automated report scheduling to deliver timely updates to stakeholders—whether weekly, monthly, or in real time. TapClicks’ AI-powered features, like SmartEmail and TapInsights, can generate and send insight summaries directly to your team or clients, keeping everyone informed with minimal manual effort.
Step 5: Explore Resources and Request a Demo
TapClicks provides a robust library of support articles, video tutorials, and best practices to help you maximize the platform’s potential. For a hands-on walkthrough, you can request a personalized demo directly from TapClicks. The TapClicks team will guide you through advanced features like performance benchmarking, AI-driven recommendations, and workflow automation.
For deeper insights, success stories, and the latest updates on marketing dashboard automation, be sure to visit the TapClicks blog.
By following these steps, you’ll quickly move from siloed data and manual reporting to streamlined, scalable, and insight-driven marketing operations—all powered by TapClicks.
Start Automating Your Marketing Data Today!
No Credit Card Required.

