

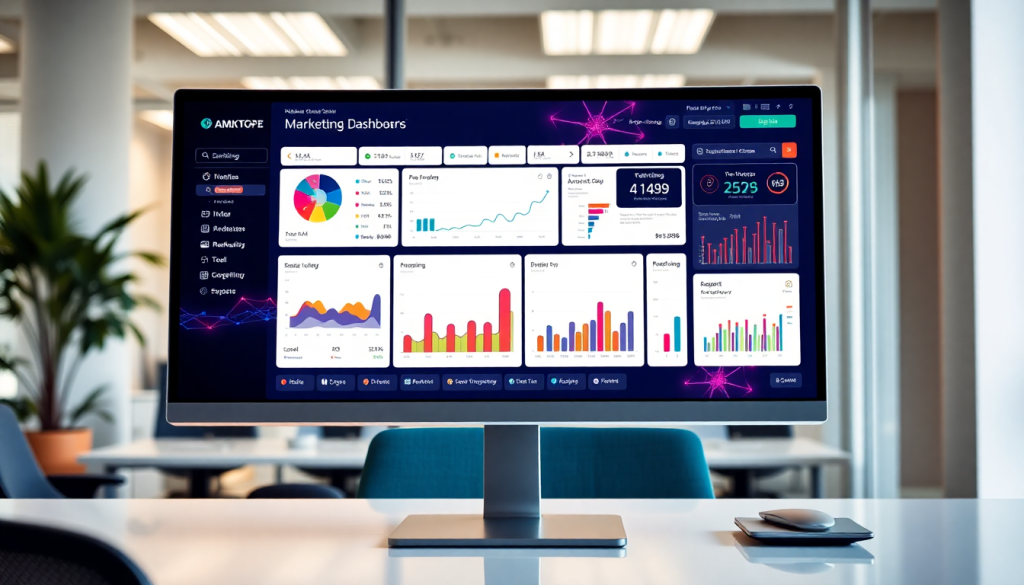
Marketing Dashboard Automation: AI-Powered Reporting Made Easy
TapClicks marketing dashboard automation is redefining how marketers manage, visualize, and act on their data—with AI-powered workflows, cross-platform data aggregation, and real-time analytics all in one place. This guide walks you through the benefits, features, and practical applications of automated reporting workflows, giving you a clear path from data chaos to actionable insights. Whether you’re an agency, brand, or enterprise team, discover how marketing dashboard automation can revolutionize your reporting, optimize campaign performance, and free your team to focus on strategy.
What Is Marketing Dashboard Automation?
Marketing dashboard automation is the process of streamlining how marketing data is collected, aggregated, reported, and visualized through dynamic, customizable dashboards—all with minimal manual intervention. At its core, this automation leverages software to connect disparate data sources (like Google Ads, Facebook, CRMs, and more), transform and normalize the data, and present it in real-time dashboards that update automatically. Key components include data integration tools, automated ETL (extract, transform, load) pipelines, AI-driven analytics engines, and intuitive dashboard builders.
By automating these processes, marketing teams eliminate tedious manual tasks such as downloading campaign reports, formatting spreadsheets, or building charts from scratch. Instead, data flows seamlessly from source to dashboard, enabling instant access to current metrics and insights. This not only accelerates reporting cycles but also ensures greater accuracy by reducing human error and data lag.
TapClicks is a leading solution in this space, offering a unified platform that brings together over 10,000 data integrations, powerful AI agents, and robust automated reporting. For a detailed look at how TapClicks powers marketing dashboard automation and AI-powered reporting, check out this in-depth overview.
The primary benefits of marketing dashboard automation are compelling:
- Significant time savings: Automated data pulls and scheduled reporting can save analysts dozens of hours each month.
- Reduced manual work: Teams can focus on strategy and optimization rather than repetitive data tasks.
- Improved accuracy and consistency: Automation minimizes the risk of human error and ensures stakeholders always see the most up-to-date information.
In short, marketing dashboard automation transforms raw, fragmented data into actionable insights—empowering agencies, brands, and enterprises to make smarter, faster decisions.
How AI-Powered Dashboard Creation Works
Artificial intelligence is rapidly transforming the way marketing dashboards are built, customized, and optimized. Traditional dashboard setup often involves hours of manual configuration—selecting metrics, designing layouts, and building widgets from scratch. With AI-powered dashboard automation, this labor-intensive process is dramatically accelerated and simplified.
At the core, AI-driven dashboard creation uses machine learning algorithms to analyze your connected data sources—whether that’s ad platforms, social channels, CRMs, or analytics tools—and intelligently recommend the most relevant widgets and visualizations for your needs. Instead of starting with a blank canvas, marketers are presented with automated widget suggestions tailored to their industry, campaign objectives, and historical performance. This means faster time-to-insight and less guesswork when choosing KPIs.
Smart templates are another game-changer. AI platforms like TapClicks offer pre-built dashboard layouts optimized for specific use cases (e.g., multi-channel campaign tracking, eCommerce performance, or agency client reporting). These templates adapt dynamically: as your campaigns evolve or new channels are added, the AI can recommend new widgets, remove obsolete ones, and even adjust visualizations for optimal clarity.
Perhaps most powerful is the role of predictive analytics and adaptive intelligence. AI continuously monitors your dashboard usage, campaign data, and reporting patterns. If it detects a sudden spike in spend, a drop in conversions, or new trends in audience engagement, it can proactively surface insights or prompt you to add relevant widgets. Over time, the dashboard becomes smarter—adapting to your changing priorities and highlighting optimization opportunities you might otherwise miss.
For practical examples of this in action, see these AI integration examples, which illustrate how marketers are using AI to automate dashboard setup, generate actionable insights, and drive campaign success.
By leveraging AI for dashboard creation, marketers not only save hours of manual work, but also ensure their analytics evolve in step with their business needs—empowering teams to focus on strategy, not spreadsheet wrangling. To learn more about TapClicks’ AI-powered dashboard solutions, visit TapClicks.
Real-Time Marketing Analytics: From Data to Insight
In today’s fast-moving digital landscape, the difference between winning and losing a campaign can come down to how quickly you act on your data. Real-time marketing analytics empower teams to move beyond static, historical reporting and instead access live, always-fresh insights. This capability allows marketers to pivot strategies, optimize campaigns on the fly, and capitalize on new opportunities as they emerge—without waiting for the next reporting cycle.
TapClicks stands out by making real-time analytics both accessible and actionable. With instant data refreshes and live campaign tracking, TapClicks ensures that marketers always have the latest performance metrics at their fingertips—whether it’s monitoring ad spend, conversion rates, or audience engagement across multiple channels. The platform’s unified dashboards aggregate data streams from all your marketing platforms, updating them in real time so you can spot trends, diagnose issues, and make informed decisions in the moment.
The advantage of real-time analytics isn’t just about speed; it’s about smarter, more agile decision-making. When you can see how your campaigns are performing minute by minute, you can quickly identify what's working, double down on high-performing channels, and reallocate budget away from underperformers. This rapid feedback loop enables continuous optimization—a key differentiator for agencies and brands aiming to maximize ROI and stay ahead of the competition.
For a deeper dive into how real-time analytics are transforming marketing dashboard automation, explore these real-world use cases. With the right tools and workflows, your team can move from data chaos to actionable insights—with the confidence that every decision is backed by the most current information available.
Multi-Channel Data Aggregation and Centralization
Modern marketing rarely lives in a single channel. Campaigns run simultaneously across paid search, social media, email, display ads, programmatic, and more—each producing its own data set in its own silo. The challenge? Turning this fragmented data into a single source of truth. That’s where marketing automation software like TapClicks truly shines.
Seamless Data Consolidation Across Platforms
TapClicks consolidates data from over 10,000 marketing, advertising, and business sources, including social platforms, search engines, CRMs, and even offline channels. With robust data connectors, you can pull in campaign data from Google Ads, Facebook, LinkedIn, Salesforce, Mailchimp, and dozens of other platforms automatically—no more manual downloads or spreadsheet wrangling. The result: all your performance metrics are available in one unified dashboard, updated in real time.
Cross-Platform Dashboard Builders
With TapClicks, cross-channel dashboards become easy to build and even easier to customize. Drag-and-drop dashboard builders let you blend and visualize data from multiple sources, whether you’re tracking the impact of a multi-channel campaign or reporting results for hundreds of clients. Advanced enrichment and normalization tools ensure your metrics are apples-to-apples, so you can compare, benchmark, and analyze campaign performance holistically.
Why Data Centralization Matters for Agencies and Brands
For agencies, centralizing marketing data means you can deliver unified, branded reports to clients—no matter where their campaigns run. It streamlines internal workflows, reduces reporting turnaround times, and ensures accuracy at scale. For multi-location brands or enterprise marketing teams, centralized dashboards enable granular, location-level analysis while preserving a high-level executive view. This empowers faster decisions, tighter budget control, and the ability to spot cross-channel trends or underperformers instantly.
Want to see how centralized data aggregation powers smarter marketing? Explore more about TapClicks’ unified data capabilities at TapClicks.com.
Automated Reporting Workflows and Scheduling
Automated reporting workflows are transforming how marketing teams communicate performance, both internally and with clients. Instead of spending hours each week manually compiling, formatting, and distributing reports, marketers can now set up powerful automations that take care of these repetitive tasks—accurately and on schedule.
How Automated Report Generation Works
Leading platforms like TapClicks allow you to define exactly what data needs to be included, how it should be visualized, and who should receive the report. Once configured, TapClicks automatically pulls in the latest data from all connected sources, generates the report in your preferred format (dashboard, PDF, spreadsheet, etc.), and delivers it via email or direct link to the right stakeholders. This end-to-end automation ensures that everyone—from clients to executives—receives fresh, reliable insights without delay.
Customization Options for Every Audience
A key benefit of modern reporting automation is deep customization. With TapClicks, you can create branded exports featuring your agency’s logo and colors, build interactive dashboards for internal teams, or craft client-facing reports tailored to each account’s unique KPIs. Flexible permissions and role-based access controls let you decide exactly what information each person sees, ensuring data privacy and relevance.
Consistency, Accuracy, and Reduced Errors
By eliminating manual data entry and repetitive formatting, automation dramatically reduces the risk of human error. Reports are generated the same way every time, guaranteeing consistency across accounts and over time. Scheduled delivery also ensures no deadlines are missed—whether you need daily campaign roll-ups, weekly performance digests, or monthly executive summaries.
Setting Up Automated Reporting in Practice
Getting started is simpler than you might think. Here are a few tips to maximize your reporting automation:
- Map Your Stakeholders: Identify who needs what data and how often—clients may prefer high-level summaries, while internal teams might need granular, real-time dashboards.
- Standardize Templates: Develop report templates for common use cases (e.g., campaign performance, budget pacing, multi-channel overviews) to ensure consistency and save setup time.
- Schedule Smartly: Use TapClicks’ scheduling tools to automate delivery at optimal times (e.g., Monday mornings for weekly recaps, end-of-month for executive reviews).
- Leverage Dynamic Content: Incorporate dynamic widgets and charts that update in real time, so your reports reflect the latest available data.
- Test and Iterate: Periodically review automated reports for accuracy and relevance, and refine templates as your business needs evolve.
With TapClicks marketing dashboard automation, you can reclaim hours each week, deliver a superior reporting experience, and empower your team to focus on strategy—not spreadsheets.
Building a Campaign Performance Dashboard
Creating an effective campaign performance dashboard with TapClicks is a straightforward process that empowers marketers to monitor results, identify trends, and drive optimization decisions—all within a single, intuitive interface. Here’s how to get started and maximize your dashboard’s impact:
Step 1: Connect Your Data Sources
Begin by linking all relevant marketing platforms—such as Google Ads, Facebook, LinkedIn, email platforms, CRMs, and display networks—using TapClicks’ robust library of over 10,000 data connectors. With automated ETL/ELT pipelines, your campaign data is extracted, cleaned, and updated in real time, ensuring your dashboard always reflects the latest performance metrics.
Step 2: Select Essential Widgets and KPIs
A high-impact campaign performance dashboard centers on the metrics that matter most. TapClicks makes it easy to drag and drop widgets for core KPIs, including:
- Impressions: Track total views across channels to gauge reach.
- Clicks: Monitor engagement and compare click-through rates.
- Conversions: Attribute leads, purchases, or other key actions to specific campaigns.
- Spend: Visualize budget allocation and pacing.
- ROI: Calculate cost efficiency and overall campaign effectiveness.
You can further customize with additional metrics—like cost per acquisition (CPA), conversion rate, or multi-channel attribution—tailored to your unique goals.
Step 3: Leverage AI-Powered Recommendations
TapClicks’ AI Agents and SmartPilot bring a new dimension to your dashboard by automatically surfacing insights and optimization suggestions. For example, AI can flag campaigns underperforming against benchmarks, suggest budget reallocations, or highlight high-performing creative variations—all without manual analysis. These recommendations appear directly in your dashboard, helping you act on opportunities in real time.
Step 4: Apply Dashboard Design Best Practices
To maximize clarity and impact:
- Prioritize Readability: Organize widgets by funnel stage or channel, and use consistent color coding.
- Highlight Key Takeaways: Use summary widgets or annotations to call out wins, trends, or areas needing attention.
- Automate Visualizations: Enable AI-driven widgets to dynamically update as new data arrives.
- Brand It: TapClicks allows full customization—add your logo, use brand colors, and tailor exports for client-facing or internal audiences.
Step 5: Automate Sharing and Collaboration
Set up automated report scheduling so dashboards are delivered to stakeholders—whether clients, executives, or team members—at the cadence you choose. With role-based access, everyone gets the insights they need without clutter or confusion.
For a deeper look at building smarter dashboards, explore the TapClicks marketing operations platform and see how unified data, AI, and workflow tools can elevate your campaign reporting from data collection to actionable insight.
Choosing the Right Marketing Automation Software
Selecting the right marketing dashboard automation software is a pivotal decision that can define your team’s efficiency, data accuracy, and growth trajectory. With a crowded landscape of dashboard tools, it’s essential to weigh your options using a strategic set of criteria:
1. Integration Capabilities
A robust marketing dashboard platform should seamlessly connect to all your data sources—social, search, display, CRM, and more. Look for a solution that offers a wide range of native data connectors and supports custom integrations. For example, TapClicks boasts over 10,000 connectors, enabling effortless aggregation of data across platforms and channels.
2. Scalability and Flexibility
As your client list or locations grow, your dashboard solution must scale with you. Consider whether the platform can handle high dashboard volumes, multiple user types, and complex multi-client or multi-location reporting structures. TapClicks is designed for agencies and enterprises managing hundreds or even thousands of campaigns—far beyond the limits of many point solutions.
3. AI and Automation Features
Modern marketing demands more than static reporting. Evaluate each platform’s AI capabilities: Does it offer automated insight generation, predictive analytics, or performance recommendations? TapClicks stands out with AI-powered agents, SmartEmail for automated insights distribution, and dynamic dashboard adaptation based on campaign performance.
4. Customization and Branding
Your dashboard tool should allow for custom widgets, templates, and branded exports tailored to each client or internal stakeholder. Ensure you can automate report delivery on your schedule and maintain full control over presentation.
5. Support and Onboarding
Look for a partner, not just a platform. Responsive support, in-depth onboarding, and ongoing training resources make a significant difference—especially when rolling out to large teams or clients with varied needs.
TapClicks vs. Other Leading Solutions
While many competitors—like Funnel.io, Adverity, and Agency Analytics—offer data integration and dashboarding, TapClicks sets itself apart through unified operations, AI-driven insights, and workflow automation. Lightweight tools may suffice for small teams, but agencies and enterprises often outgrow their capabilities. On the other hand, pure data pipes lack the workflow, reporting, and insight automation found in TapClicks.
Customer Success in Action
Agencies and brands consistently report measurable time savings and improved client satisfaction after switching to TapClicks. For instance, a multi-location retail brand reduced manual reporting time by over 80% and gained real-time visibility into campaign ROI—enabling rapid optimization and budget reallocation.
In Summary:
When evaluating marketing dashboard automation platforms, prioritize integration breadth, scalability, AI-powered insights, customization, and support. TapClicks delivers on all fronts, empowering marketers to unify data, automate reporting, and focus on what matters most: strategy and growth.
Ready to see how TapClicks can revolutionize your marketing operations? Visit TapClicks to learn more.
Getting Started with TapClicks Marketing Dashboard
Ready to transform your marketing reporting with automation and AI? Getting started with TapClicks is straightforward, whether you’re an agency managing hundreds of clients or a brand looking to unify multi-channel analytics. Here’s a step-by-step outline to guide your onboarding and initial setup:
1. Sign Up and Access Your TapClicks Workspace
Begin by signing up for a TapClicks account. Once you’re in, you’ll land in a centralized workspace designed for intuitive navigation and collaboration.
2. Connect Your Data Sources
Use TapClicks’ extensive library of 10,000+ marketing, advertising, and business connectors to bring in data from social, search, display, CRM, and more. The Smart Connector framework allows you to easily integrate both standard and custom sources, ensuring a single source of truth for all your campaigns.
3. Configure Your Dashboards
Leverage drag-and-drop dashboard builders to set up reporting views tailored to your needs. TapClicks’ AI features suggest relevant widgets, KPIs, and smart templates based on your connected data and campaign objectives, speeding up dashboard creation and customization.
4. Automate Reporting and Scheduling
Set up automated workflows for scheduled reporting. Customize branded exports for clients or internal dashboards for your team, ensuring consistent and error-free delivery. With TapClicks, you can easily manage report frequency, recipients, and formats—all from a single platform.
5. Explore AI-Powered Insights
Activate TapClicks’ AI Agents and SmartEmail functionality to automatically surface actionable insights, optimization recommendations, and budget pacing alerts. These tools help you move from data to decisions faster than ever.
6. Collaborate and Share Access
Assign role-based permissions for team members, clients, or partners. TapClicks supports collaborative workflows, so everyone stays aligned and informed throughout the campaign lifecycle.
7. Optimize and Iterate
Once your dashboards are live, use real-time analytics and AI-driven insights to monitor performance and continuously optimize your campaigns.
Ready to see TapClicks in action? Explore a demo or free trial to experience the full power of automated marketing dashboard reporting. For in-depth learning, best practices, and ongoing support, visit the TapClicks resources and blog.
With TapClicks, you can unify your data, automate your reporting, and empower your team to focus on what matters most—strategy and growth.
Start Automating Your Marketing Data Today!
No Credit Card Required.

