

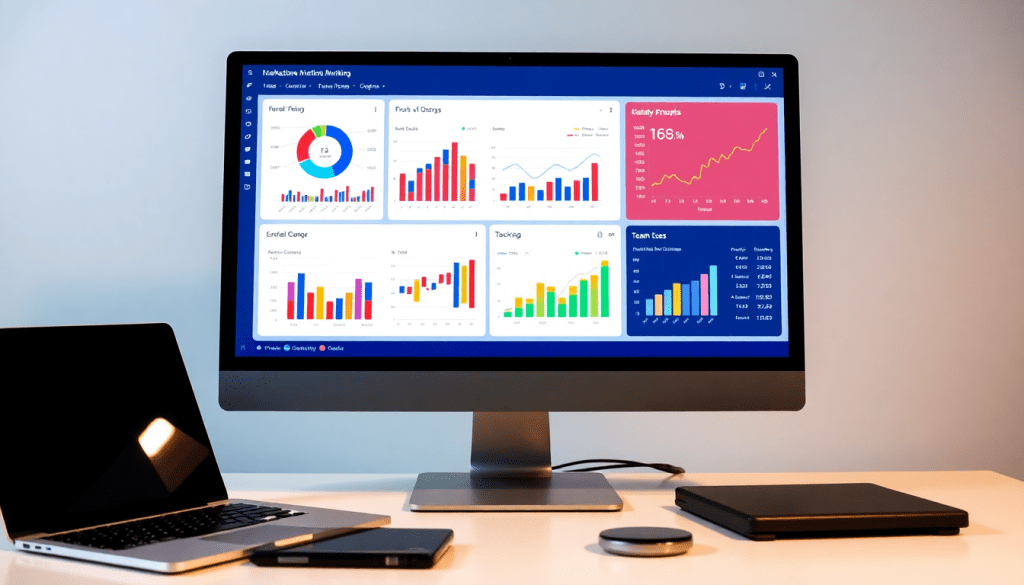
Digital Marketing KPI Dashboard: Visualize Metrics & Track ROI
A digital marketing KPI dashboard brings together all your essential campaign metrics into one interactive, easy-to-understand view. With real-time data visualization, automated reporting, and cross-channel analytics, these dashboards empower marketers, agencies, and brands to make confident, data-driven decisions. Whether you’re aiming to optimize campaigns, showcase results to stakeholders, or save time on tedious reporting tasks, the right dashboard will transform the way you track ROI and prove the value of your marketing efforts.
What is a Digital Marketing KPI Dashboard?
A digital marketing KPI dashboard is an interactive platform that consolidates and visualizes your most important marketing metrics—such as website traffic, conversions, cost per acquisition (CPA), return on ad spend (ROAS), and more—into a single, easy-to-navigate view. Unlike static spreadsheets or scattered reports, a KPI dashboard provides real-time insights across all your active campaigns and channels, empowering marketers, agencies, and brands to monitor performance, identify trends, and make agile, data-driven decisions.
Why does this matter? Today’s marketing landscape is complex and fast-paced. Teams juggle multiple platforms (Google Ads, Facebook, email, SEO, and more), which means data is often siloed in different tools. Without a centralized solution, it’s easy to lose sight of overall performance and miss valuable optimization opportunities. A digital marketing KPI dashboard brings everything together, offering a unified picture that saves time and reduces errors.
Typically, these dashboards track a range of key performance indicators (KPIs)—from high-level metrics like ROI and lead generation to granular stats such as click-through rates (CTR), average order value, and engagement rates. By aggregating both paid and organic campaign data, dashboards enable users to drill down into what’s working and what needs improvement.
The need for automation is especially critical for modern marketers. Manually pulling and compiling data is both time-consuming and prone to mistakes. That’s why dashboard automation is a game-changer: it streamlines the reporting process, updates metrics in real time, and frees up your team to focus on strategy and creative execution. In short, a digital marketing KPI dashboard is not just a reporting tool—it’s the command center for maximizing marketing ROI and demonstrating value to stakeholders.
Core Features of an Effective KPI Dashboard
The best digital marketing KPI dashboards are designed to simplify complexity, empower data-driven decisions, and scale alongside your business. To achieve these goals, there are several must-have features to look for:
1. Real-Time Metrics:
Instant access to up-to-date performance data is essential for agile marketing. Real-time dashboards ensure you’re always seeing the latest metrics—whether it’s website traffic spikes, campaign conversions, or sudden dips in engagement—so you can respond quickly and optimize on the fly.
2. Cross-Channel Data Integration:
Modern marketing rarely happens in a single channel. Your dashboard should seamlessly integrate data from all your platforms—think Google Ads, Facebook, LinkedIn, programmatic, email, and more. By connecting disparate sources, you get a unified view of performance, eliminating silos and manual reporting headaches.
3. Filterable Views and Customizable Widgets:
Not every stakeholder needs the same data. Effective dashboards let you filter by campaign, channel, region, or time period, and customize widgets to highlight the KPIs that matter most to each user. This flexibility helps everyone, from analysts to executives, focus on the insights relevant to their goals.
4. Automated Report Generation:
Manual reporting is time-consuming and error-prone. A robust KPI dashboard automates scheduled reports, delivering tailored performance summaries straight to your inbox or client portals. With dashboard automation, teams can reclaim valuable hours each month and ensure accuracy across every report.
5. Interactive Performance Visualizations:
Static spreadsheets can’t compete with interactive dashboards. Drill-down charts, dynamic graphs, and at-a-glance scorecards make it easy to spot trends, compare channels, and uncover opportunities for optimization. Interactivity also encourages exploration, helping marketers ask better questions and find deeper insights.
6. AI-Driven Insights:
Today’s top dashboards go beyond tracking—they help you act. AI-powered marketing dashboards analyze your data to surface actionable insights, flag anomalies, and even recommend optimizations. Whether it’s predicting campaign outcomes or identifying budget inefficiencies, AI lifts the dashboard from a reporting tool to a strategic advisor.
By bringing these features together, a modern KPI dashboard becomes a central hub for performance management—powering smarter decisions, saving time, and helping marketers prove the ROI of every campaign. To see how these capabilities come together in practice, explore TapClicks’ unified marketing operations platform, which is built to deliver scale, automation, and actionable insights for agencies and brands alike.
Essential Marketing Metrics for ROI Tracking
Selecting the right marketing metrics is the foundation of effective ROI tracking—and it’s what separates impactful analytics from wasted effort. While the digital landscape offers an overwhelming variety of data points, the most successful marketers focus on KPIs that directly align with their business goals and bottom line.
Key Metrics for Campaign KPI Monitoring
When building your dashboard, prioritize metrics that provide real insight into performance and efficiency. Some of the most critical include:
- Click-Through Rate (CTR): Measures the percentage of users who click on a specific ad or link. A strong CTR often indicates compelling creative and audience targeting.
- Cost Per Click (CPC): Shows how much you pay each time someone clicks your ad. Monitoring CPC helps optimize spend across channels.
- Cost Per Acquisition (CPA): Tracks the cost to acquire a new customer or lead, providing a direct view into campaign efficiency.
- Return on Ad Spend (ROAS): Calculates the revenue earned for every dollar spent on advertising. This is a core indicator of marketing profitability.
- Engagement Rates: Analyzes how users interact with your content—likes, shares, comments, and time on page—giving you insight into brand resonance and audience intent.
- Conversion Rate: Reveals the percentage of visitors who complete a desired action, such as filling out a form or making a purchase.
Align Metrics to Business Objectives
Not every metric matters equally for every business. Start by clarifying your primary objectives: are you growing brand awareness, driving sales, or generating leads? Choose KPIs that map directly to these goals. For example, a B2B agency might focus on cost per lead and pipeline value, while an eCommerce brand prioritizes ROAS and average order value.
Avoiding Vanity Metrics
It’s tempting to highlight big numbers like impressions or page views, but these “vanity metrics” rarely provide actionable insight. Instead, concentrate on metrics that reflect genuine progress toward ROI—those that measure actions, cost efficiency, and revenue impact. A well-designed dashboard will spotlight these performance indicators, helping you cut through the noise and make smarter decisions.
By tracking meaningful KPIs, marketers ensure their dashboard isn’t just a collection of charts—it’s a strategic tool for growth. For more on building dashboards that spotlight what truly matters, explore TapClicks’ solutions.
Building a Performance Tracking Dashboard: Step-by-Step
Creating a performance dashboard shouldn’t be intimidating. With the right approach, you can turn scattered data into actionable insights that drive better decisions, faster. Here’s how to make it happen:
1. Bring All Your Data Together
Start by unifying your marketing data.
Check off these integration essentials:
- Connect all major channels (Google Ads, Facebook, LinkedIn, etc.)
- Integrate CRM and email platforms
- Use a platform like TapClicks for 10,000+ pre-built connectors and real-time sync
- Eliminate manual data entry
2. Choose the Right KPIs (Not Just More Metrics)
Keep your dashboard focused and meaningful:
- Identify metrics that map to campaign and business goals
Examples: conversion rates, CPA, ROAS, engagement rates - Avoid vanity metrics that don’t prove value
- Prioritize KPIs that directly impact ROI
3. Visualize for Clarity—Not Confusion
Design your dashboard to be instantly understandable:
- Use intuitive charts, graphs, and tables
- Group related KPIs together for context
- Apply color coding to highlight trends
- Enable filterable views for deeper analysis
- Leverage drag-and-drop widgets to tailor views for executives, clients, or campaign leads
4. Automate Everything You Can
Take manual work out of the equation:
- Schedule automated data pulls to keep dashboards current
- Set up recurring report distributions to key stakeholders
- Ensure everyone always has access to the latest insights
- Reduce risk of human error
5. Review, Refine, Repeat
Maximize the dashboard’s impact by iterating:
- Collect feedback from users regularly
- Analyze which visualizations deliver the most value
- Update your dashboard as business needs evolve
- Strive to make data even simpler and more actionable
Pro Tip
For a hands-on guide and more best practices, explore this TapClicks guide on dashboard automation.
At a Glance: Dashboard Essentials
| Step | What to Do | Tools/Features |
|---|---|---|
| Data Integration | Connect every source, automate sync | TapClicks Smart Connectors |
| KPI Selection | Focus on what matters for ROI | Custom Metrics |
| Visualization | Clarify with charts, group KPIs, filter | Drag-and-Drop Dashboards |
| Automation | Schedule updates, auto-reporting | Automated Scheduling |
| Ongoing Optimization | Review, get feedback, improve clarity | User Feedback & Analytics |
With the right setup, your KPI dashboard becomes a powerhouse for tracking, optimizing, and demonstrating marketing ROI—all with less manual effort and more strategic impact.
See the Full Story: Why Cross-Channel Analytics Matter
Modern marketing happens everywhere—search, social, display, email, and beyond. Each channel generates its own metrics, reporting formats, and data quirks. If you’re manually piecing this together, you’re chasing a moving target and missing the big picture.
The Challenge: Data Silos and Fragmented Reporting
When data lives in separate platforms:
- Silos form: Valuable information gets trapped in single-channel reports.
- ROI is unclear: It’s hard to know what’s truly driving conversions.
- Manual work piles up: Teams spend hours compiling and cross-referencing spreadsheets instead of analyzing.
The Solution: A Unified Analytics Dashboard
A cross-channel analytics dashboard brings everything together. Here’s how:
- One dashboard, all your data: See results from search, social, display, email, and more—side by side.
- Holistic campaign performance: Spot trends, compare channels, and see how touchpoints interact along the customer journey.
- Smarter budget decisions: Allocate spend based on true, up-to-date performance, not guesswork.
What Does This Unlock for Your Team?
| Role | Benefit |
|---|---|
| Marketing Leads | A single source of truth for ROI and strategy |
| Agencies | Fast, clear client reporting—no more juggling logins |
| Analysts | Consistent, accurate metrics for deep dives |
| Executives | Simplified, high-level performance snapshots |
Why Integration Is the Hard Part
With hundreds of platforms and APIs out there, manually syncing and normalizing data is a recipe for errors and wasted time.
TapClicks Makes It Simple
- 10,000+ Connectors: Pull in data from virtually any marketing source.
- Automated ETL/ELT: Extract, transform, and load with zero manual steps.
- Data Normalization: Blend multi-location, multi-client, and cross-channel data seamlessly.
The Takeaway
When you break down silos and unify analytics, you empower every stakeholder—from analysts to execs—to act on insights, not just information. With TapClicks, your team can stop wrangling data and start driving results.
Automating KPI Reports for Efficiency and Accuracy
Manual reporting is one of the most time-consuming and error-prone aspects of digital marketing analytics. Automating your KPI reports not only eliminates repetitive tasks but also ensures consistency, reliability, and speed across your organization’s reporting workflows. By leveraging automated KPI dashboards, marketers can reclaim countless hours each month, drastically reduce manual errors, and deliver timely insights to stakeholders without the scramble of last-minute data pulls.
With automated KPI reporting, agencies and brands can schedule recurring delivery of campaign performance summaries, executive dashboards, or client-facing reports—whether daily, weekly, or monthly. This means teams can maintain a real-time pulse on marketing performance without lifting a finger. For example, platforms like TapClicks enable users to set up scheduled reports that are not only branded for each client but also dynamically populated with the latest cross-channel data, ensuring every stakeholder always has the most current and complete picture.
Additionally, automation ensures accuracy by removing the risk of copy-paste mistakes or outdated metrics that can happen when building reports manually. Features like smart alerts and AI-powered insights further enhance reporting, surfacing anomalies or optimization opportunities automatically, so teams are always a step ahead.
To further streamline your analytics and reporting workflows, explore more automation tips, including how to set up automated delivery, leverage insights, and maximize the impact of your KPI dashboards. By embracing automation, your team will spend less time wrangling data—and more time acting on it.
Demonstrating Marketing Impact with Interactive Dashboards
Interactive dashboards have become indispensable for marketers who need to communicate value and ROI to stakeholders with clarity and precision. Unlike static spreadsheets or one-off slide decks, interactive dashboards bring data to life—enabling users to drill down into metrics, filter by campaign or region, and instantly uncover trends that might otherwise go unnoticed.
The power of visualization in these dashboards cannot be overstated. By translating complex campaign data into intuitive charts, graphs, and heatmaps, marketers can craft a compelling narrative around their results. Visual storytelling transforms raw numbers into actionable insights, making it easier for both internal teams and clients to grasp the true impact of marketing initiatives. For example, instead of simply stating that a campaign achieved a 20% increase in conversions, a dashboard can visually demonstrate how that uptick correlates with shifts in budget allocation or changes in audience targeting over time.
Moreover, interactive dashboards make reporting more collaborative and dynamic. Marketers can present live dashboards in meetings, allowing stakeholders to ask questions and explore different data slices on the spot. This real-time interactivity fosters transparency and builds trust, as decision-makers see firsthand how marketing activities contribute to business objectives. Sharing strategies can include setting up automated, scheduled dashboard snapshots for executives or embedding live dashboards in client portals for ongoing visibility.
With platforms like TapClicks, marketers can take these presentations to the next level—leveraging drag-and-drop customization, branded visuals, and AI-powered insights that not only tell the story of performance but also recommend next steps. Ultimately, interactive dashboards go far beyond reporting; they become a strategic asset for proving ROI, aligning teams, and driving smarter marketing decisions across the organization.
Choosing the Right Digital Marketing KPI Dashboard Solution
Selecting the best digital marketing KPI dashboard isn’t just about picking a tool with pretty charts—it’s about finding a platform that meets your organization’s needs today and scales with your ambitions tomorrow. Here are the key factors to keep in mind:
1. Scalability and Performance
As your campaigns grow and your client list expands, your dashboard must be able to handle more data, more users, and more complex reporting without slowing down. Look for solutions designed for high-volume environments, especially if you’re an agency or a multi-location brand managing hundreds of campaigns simultaneously.
2. Integration Options
Seamless integration is non-negotiable. The right dashboard should unify data from all your marketing, advertising, and business sources—across social, search, CRM, and more—without tedious manual uploads. Platforms like TapClicks stand out here, offering 10,000+ marketing and business data connectors and robust enrichment tools for blending and normalizing datasets. This ensures your dashboards always reflect the complete picture.
3. Customization and Flexibility
Every organization has unique KPIs and reporting requirements. Prioritize dashboards that allow you to customize views, widgets, and reports to fit your specific goals. Drag-and-drop interfaces, white-labeling options, and the ability to automate scheduled reporting are especially valuable for agencies serving multiple clients or brands with varied internal stakeholders.
4. AI Insights and Automation
The best dashboards don’t just display data—they help you interpret it. Advanced platforms leverage AI to surface actionable insights, recommend optimizations, and even generate automated email summaries of campaign performance. This not only saves time but also empowers your team to focus on strategy, not spreadsheet wrangling.
5. Support and Security
Strong customer support, onboarding, and training resources are crucial for ensuring a smooth rollout and ongoing success. In addition, enterprise-grade security and compliance features protect your sensitive marketing and client data.
Comparing Solutions: Why TapClicks Leads the Pack
While many dashboard tools offer basic data visualization or simple integrations, TapClicks is purpose-built for scale, automation, and actionable intelligence. Its unified platform brings together reporting, analytics, workflow, and even order management—removing the need for multiple point solutions. Agencies and brands can tailor TapClicks to serve as either their “single source of truth” or as a flexible data hub that feeds into existing BI stacks like Tableau and Power BI.
For a deeper dive into how TapClicks compares to other solutions and to explore its robust features firsthand, visit the TapClicks website.
By weighing these considerations and aligning your dashboard choice to your strategic goals, you’ll set your marketing team up for smarter decisions, better ROI visibility, and long-term growth.
Start Automating Your Marketing Data Today!
No Credit Card Required.

