

Digital Marketing KPI Dashboard: Visualize Metrics & Track ROI
A digital marketing KPI dashboard brings clarity to campaign performance by transforming scattered data into actionable, visual insights. For marketers and agencies juggling multiple channels, clients, and platforms, a centralized dashboard streamlines campaign KPI monitoring, ROI tracking, and reporting—all in real time. From automated KPI reports to interactive performance tracking, the right dashboard doesn’t just display numbers; it empowers teams to make faster, smarter decisions, spot opportunities, and communicate value to stakeholders with confidence.
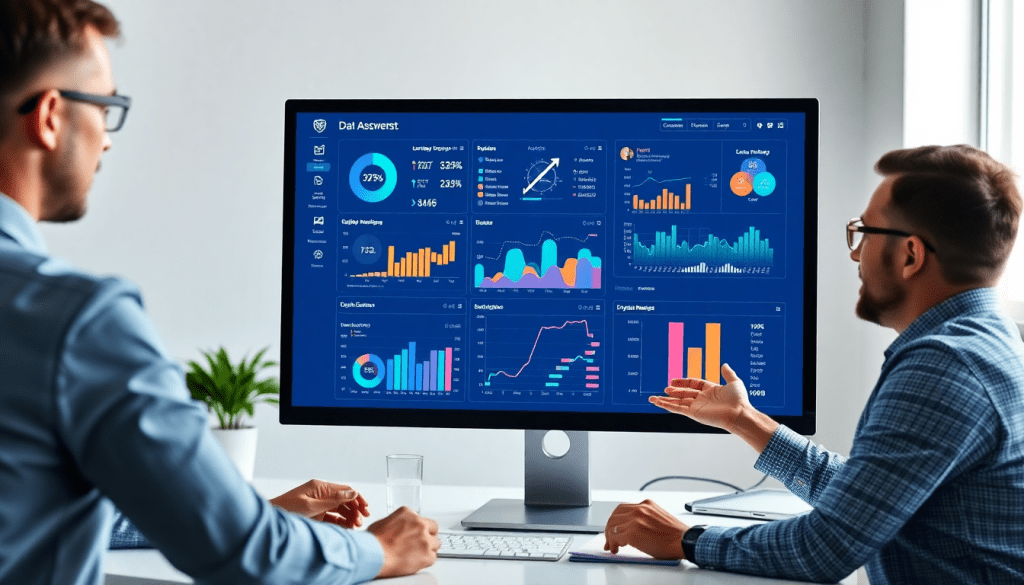
What Is a Digital Marketing KPI Dashboard?
A digital marketing KPI dashboard is your command center for marketing data—a single, interactive hub that brings together essential metrics from every channel you care about, in real time.
Why Use a KPI Dashboard?
Instead of hopping between spreadsheets and platforms, marketers and agencies use KPI dashboards to:
-
Visualize Performance Instantly:
See impressions, clicks, conversions, ROI, and more—displayed as clear charts, graphs, and scorecards. -
Unify Cross-Channel Analytics:
Pull live data from search, social, display, email, and other platforms into one holistic view. No more copy-paste headaches or siloed reporting. -
Monitor Campaign KPIs in Real Time:
Set goals, benchmark progress, and receive instant alerts about what’s working—and what needs attention—before small issues become big problems.
How Is a KPI Dashboard Different from Spreadsheets or Static Reports?
| Traditional Spreadsheets | Static Reports | Digital KPI Dashboards |
|---|---|---|
| Manual data updates | Quickly outdated | Syncs automatically with live data |
| Errors and version confusion | Limited interactivity | Interactive, customizable, shareable |
| Time-consuming to maintain | Hard to personalize | Stakeholder-specific customization |
What Makes Dashboards So Valuable?
- Always Up-to-Date:
Automatic syncing means your team and clients see the latest numbers—no more stale data. - Easy Customization:
Highlight the metrics that matter for each client, team, or executive. - Automated Reporting:
Schedule and send branded, tailored reports with zero manual effort. - Deeper Exploration:
Dive into trends, filter by channel, or identify underperforming campaigns in seconds.
Want to see dashboard automation in action?
Check out our guide to digital marketing dashboard automation for practical tips and examples.
A great KPI dashboard isn’t just about pretty visuals—it’s about turning complex data into clarity and speed, so your team can make smarter decisions and deliver measurable results.
Why Marketers Need KPI Dashboards: Benefits & Use Cases
Modern marketing teams face a relentless stream of data from dozens of channels—social media, search, display, email, and more. Without a centralized way to visualize and interpret these metrics, marketers risk missing critical insights, wasting time on manual reporting, and struggling to prove ROI. This is where digital marketing KPI dashboards shine, delivering a host of benefits that drive efficiency, transparency, and smarter decision-making.
Time Savings and Increased Efficiency:
Automated dashboards eliminate the need to wrangle spreadsheets or compile static reports by hand. With all key performance indicators (KPIs) aggregated in one place, teams can shift their focus from data collection to strategy and optimization. This is particularly powerful for agencies managing multiple clients or brands with complex, multi-location campaigns, where manual reporting can consume dozens of hours each month.
Enhanced Transparency and Stakeholder Confidence:
Dashboards provide a single source of truth, ensuring everyone—from marketing analysts to executives and clients—sees the same up-to-date numbers. This transparency builds trust, streamlines communication, and enables agencies to demonstrate the tangible value they deliver. For example, automated dashboards allow agencies to create client-facing portals with real-time access to campaign performance, eliminating the “black box” effect and strengthening client relationships.
Smarter, Faster Decision-Making:
Instead of waiting for month-end reports, marketers can spot trends, anomalies, and opportunities as they emerge. Dashboards with interactive visualizations and AI-powered insights surface actionable information—like underperforming channels, budget pacing issues, or unexpected spikes in engagement—so teams can pivot quickly and maximize ROI.
Key Use Cases:
- Multi-Channel Campaign Tracking: View cross-channel performance side-by-side, compare metrics, and pinpoint what’s driving results.
- Agency Client Reporting: Deliver branded, automated reports for dozens or even hundreds of clients, customized by campaign, location, or service line.
- Enterprise Marketing Analytics: Consolidate data from disparate platforms (CRM, ad networks, web analytics) for unified executive reporting and strategic planning.
Supporting ROI Tracking:
Perhaps the most important benefit is the ability to tie marketing activity directly to business outcomes. By connecting spend, conversions, and revenue across channels, dashboards empower marketers to prove and improve return on investment, justify budgets, and align efforts with organizational goals.
TapClicks: Purpose-Built for Scale:
TapClicks stands out as a leading solution for agencies, brands, and enterprise teams that need scalable, flexible dashboards. With over 10,000 data connectors, automated reporting workflows, and AI-driven insights, TapClicks enables users to unify marketing data, track KPIs in real time, and deliver actionable reports at any scale—freeing up precious time and supporting data-driven growth.
What Marketing Metrics Should You Really Be Tracking?
Building an insightful marketing dashboard isn’t just about collecting numbers—it’s about surfacing the data that truly drives action. Here’s how to focus on the metrics that matter most for agencies, brands, and media teams.
The Metrics Every Marketer Needs on Their Dashboard
Start with these essential KPIs to measure campaign health and ROI:
-
Impressions
How many times was your ad or content displayed? This is your baseline for brand visibility and reach. -
Clicks
Track how often users engage by clicking your ads or links. This helps you gauge creative and targeting effectiveness. -
Conversions
Whether it’s a purchase, form submission, or app install, conversions reveal the direct impact of your marketing. -
Cost Per Acquisition (CPA)
See exactly how much you’re spending, on average, to acquire a customer. A key metric for budget efficiency. -
Return on Ad Spend (ROAS)
Measure the revenue earned versus the dollars spent. High ROAS = high campaign profitability. -
Engagement Metrics
Monitor likes, shares, comments, and time-on-site. These metrics show how your audience is interacting with your content.
Mix and Match: Building a Holistic View
A great dashboard isn’t one-dimensional. Combine metrics across different categories for a complete picture:
| Brand Awareness | Performance & ROI | Channel-Specific |
|---|---|---|
| Impressions | CPA | Email Open Rates |
| Reach | ROAS | Social Followers |
| Share of Voice | Conversions | Click-through Rate |
This approach connects the dots from discovery (top-of-funnel) to conversion, and lets you pinpoint what’s working on each platform—be it paid search, social, email, or display.
Tailor Your Metrics: Customization and Segmentation
Not all stakeholders want the same details. Consider:
-
Custom Metrics:
- Franchise owners may need location-based performance.
- Executives might just want a high-level ROI snapshot by campaign.
-
Segmentation:
Break down performance by audience, device, or campaign type to sharpen your insights and reporting.
Pro Tip: Use TapClicks’ automated dashboards and reporting tools to create customized, stakeholder-ready views in just a few clicks.
Turn Metrics Into Action—Not Just Reports
Tracking is just the beginning. The real value comes from transforming those metrics into actionable insights:
- Visualize trends and anomalies quickly.
- Automate recurring reports for efficiency.
- Use TapClicks’ AI-driven recommendations to optimize spend and creative based on real performance data.
Ready to see how the right metrics—and the right platform—can drive your marketing forward? Explore TapClicks’ analytics and reporting tools to get started.
Key Features of an Effective Performance Tracking Dashboard
An effective performance tracking dashboard isn’t just a visualization tool—it’s a centralized command center that empowers marketing teams to act with speed, clarity, and confidence. Here’s what distinguishes best-in-class dashboards:
1. Real-Time Updates and Automated KPI Reports
In today’s fast-moving digital landscape, static reports quickly become obsolete. The most valuable dashboards offer real-time updates, ensuring that marketers and stakeholders always have the latest performance data at their fingertips. Automated KPI reporting not only eliminates manual data pulls but also enables teams to schedule recurring reports, keeping everyone aligned with minimal effort.
2. Flexible Data Connectors for Comprehensive Insights
With campaigns running across dozens of platforms, dashboards must seamlessly integrate data from all major marketing, advertising, and business channels. Flexible data connectors—like those provided by TapClicks—make it easy to unify social, search, display, CRM, and e-commerce data into a single, holistic view. This cross-channel visibility is essential for accurate ROI tracking and campaign optimization.
3. Interactive Performance Metrics and Custom Visualizations
The ability to drill down into metrics, filter by time periods, or segment by channel or audience is crucial for uncovering insights. Leading dashboards feature interactive elements—such as dynamic charts, graphs, scorecards, and heatmaps—that help users visualize trends, compare results, and quickly spot anomalies. Customizable layouts allow each team or client to see what matters most to them.
4. AI-Powered Insights and Smart Alerts
Modern dashboards go beyond displaying data—they leverage AI to surface actionable insights. Features like anomaly detection, performance scoring, and smart alerts proactively notify users of significant changes or optimization opportunities. TapClicks’ AI-powered agents, for example, analyze dashboards in real time and can automatically email tailored summaries and recommendations to relevant stakeholders, accelerating data-driven decision-making.
5. User-Friendly Design for Broad Adoption
No matter how powerful the backend, a dashboard’s value depends on its usability. The best solutions offer intuitive drag-and-drop interfaces, clear navigation, and robust support for role-based access so that everyone—from analysts to executives—can easily interact with the data. A user-friendly design encourages adoption across marketing, sales, and client teams, making performance reporting a collaborative, organization-wide practice.
For organizations seeking a comprehensive platform that checks all these boxes, TapClicks stands out by combining scalable data integration, automated reporting, and AI-powered insights within a highly customizable and accessible dashboard environment.
Setting Up Your Digital Campaign Reporting Dashboard
Launching an effective digital marketing KPI dashboard starts with a clear plan and the right tools. Here’s a step-by-step guide for marketers and agencies looking to turn fragmented data into cohesive, actionable insights:
1. Connect Your Data Sources
Begin by linking all relevant marketing channels and platforms—think Google Ads, Facebook, LinkedIn, email services, and any other sources your campaigns rely on. With a unified platform like TapClicks, you can instantly integrate thousands of data connectors, ensuring no vital campaign metrics are left behind.
2. Select and Prioritize Your KPIs
Choose key performance indicators that align with your goals. For most digital campaigns, this includes impressions, clicks, conversions, CPA, ROAS, and engagement metrics. Don’t forget to tailor KPIs for different stakeholders—executives may need high-level ROI figures, while account managers might track channel-specific performance.
3. Customize Dashboard Layouts for Clarity
Design your dashboard so that insights are intuitive at a glance. Use drag-and-drop interfaces to group related metrics, add branded elements, and organize data by channel, campaign, or client. A clean, visually appealing layout speeds up analysis and helps stakeholders focus on what matters most.
4. Schedule Automated Reports
Set up recurring, automated reports to keep teams and clients in the loop—daily, weekly, or monthly. This eliminates manual reporting, reduces errors, and ensures everyone receives up-to-date performance insights on time. Interactive dashboards allow stakeholders to dive deeper into the data when needed.
5. Enable Cross-Channel Analytics
Avoid reporting gaps by ensuring your dashboard pulls data from all relevant sources. Cross-channel analytics help marketers spot trends, attribute results accurately, and optimize spend across platforms. Smart connectors and ETL tools like those in TapClicks make this process seamless, eliminating data silos.
6. Implement Role-Based Access and Branding
Protect sensitive data and streamline collaboration by setting role-based permissions. Agencies can give clients access to their specific dashboards, while internal teams see only what’s relevant to their roles. Apply client-ready branding—logos, color schemes, and custom domains—to reinforce professionalism and trust.
By following these steps, you’ll set up a digital marketing KPI dashboard that not only visualizes performance but also empowers your team to act on real-time insights. With the right foundation, you’re ready to move from data chaos to marketing clarity.
Best Practices for Automated KPI Reports & Actionable Insights
Automating your KPI reporting workflow is a game-changer for modern marketers. By streamlining recurring reporting tasks, teams can save valuable hours each month, minimize manual errors, and ensure consistent delivery of campaign insights to stakeholders. Here’s how to make your automated reports both efficient and impactful:
Automate with Purpose: Start by identifying which reports are most frequently needed—such as weekly performance summaries, monthly client recaps, or cross-channel trend analyses. Use dashboard tools that support scheduled delivery, so stakeholders receive timely updates without the need for manual intervention.
Leverage Trend Analysis & Benchmarking: Automated reports shouldn’t just reiterate raw numbers. Incorporate trend lines, period-over-period comparisons, and industry benchmarks to contextualize performance. This approach helps surface patterns, anomalies, and opportunities that might otherwise go unnoticed in static spreadsheets.
Transform Data into Actionable Insights: The true value of automation lies in translating data into recommendations. Layer in AI-powered features—like TapClicks’ Smart Insights and SmartEmail—to automatically flag campaign outliers, pacing issues, or high-performing channels. Automation should empower marketers to pivot strategies quickly, not just observe lagging results.
Customize for Stakeholder Relevance: Tailor automated reports by audience—executives may want big-picture ROI and budget pacing, while channel managers need granular metrics. Use customizable templates and segmentation to ensure each recipient sees the most relevant KPIs, reducing noise and driving focused action.
Continuous Improvement: Regularly review your automated reports and dashboards to refine KPIs, update benchmarks, and enhance data visualizations. Schedule periodic audits to align reporting outputs with evolving business goals and campaign strategies.
For inspiration on how to structure powerful, automated marketing analytics reports, check out these marketing analytics report examples, which showcase how leading teams turn data into actionable stories.
By following these best practices, your marketing team can unlock faster, smarter, and more impactful decision-making—no matter how complex your campaign landscape.
TapClicks: The Ultimate AI Marketing Dashboard Solution
Marketers and agencies seeking a comprehensive, scalable solution for digital campaign reporting will find a powerful ally in TapClicks. As an all-in-one marketing operations platform, TapClicks unifies data integration, KPI dashboards, and reporting—eliminating the chaos of juggling multiple point tools and manual processes.
TapClicks stands out with its ability to connect to 10,000+ marketing, advertising, and business data sources. This means marketers can automatically aggregate campaign performance across every channel—search, social, programmatic, email, and more—without tedious manual exports or spreadsheet wrangling. The platform’s intuitive dashboard builder enables teams to visualize and monitor essential KPIs in real time, delivering both high-level overviews and granular views for campaign optimization.
Where TapClicks truly excels is in its use of AI to elevate performance tracking and decision-making. TapClicks’ AI Agents and SmartPilot analyze dashboards and datasets to surface predictive insights, smart recommendations, and budget pacing alerts—empowering teams to spot opportunities and address issues before they impact ROI. With features like SmartEmail, TapClicks can even generate and deliver automated, AI-curated insight summaries directly to stakeholders or clients, keeping everyone informed without extra reporting effort.
Agencies and brands using TapClicks routinely report dramatic time savings—often reclaiming 50+ hours per analyst, per month—thanks to automated data pulls, scheduled KPI reports, and streamlined workflow management. This operational efficiency translates into improved ROI tracking, faster optimization cycles, and more transparent client communications. The platform’s robust role-based access and white-label options ensure that every dashboard is both secure and client-ready.
For marketing teams managing hundreds of campaigns or clients, TapClicks delivers the scale, flexibility, and intelligence needed to thrive in today’s data-driven landscape. To see how TapClicks can transform your approach to digital marketing KPI dashboards, explore the platform and discover a smarter way to drive results.
Wrapping Up: Why Dashboards Matter More Than Ever
In today’s fast-moving, data-saturated marketing world, having a digital marketing KPI dashboard isn’t just nice to have—it’s absolutely essential. Here’s why top-performing marketers and agencies rely on dashboards to stay ahead:
- Get All Your Data in One Place: No more juggling multiple spreadsheets or logging in to countless platforms.
- See What Matters Most: Instantly visualize your most important KPIs, from campaign performance to budget pacing.
- Automate Tedious Reporting: Save time and reduce manual errors by letting your dashboard handle scheduled and ad hoc reports.
- Make Confident Decisions: Use real-time, centralized insights to optimize campaigns, justify spend, and prove ROI to stakeholders.
Questions to Ask Yourself
Before you leave, take a moment to consider:
- Are your current tools giving your team the clarity and real-time analytics you need?
- Do you struggle with siloed data or missing metrics that slow down your reporting?
- Is your reporting process fast and efficient, or does it feel outdated and manual?
Ready to Level Up?
If you’re nodding “yes” to any of the questions above, it’s time to explore a more unified, scalable solution. TapClicks offers:
| Benefit | What You Get with TapClicks |
|---|---|
| Unified Data | 10,000+ connectors for all your marketing data |
| Automated Reporting | Scheduled, branded, and client-ready outputs |
| AI-Powered Insights | Smart recommendations and campaign scoring |
| Scalable Workflows | Order management and team collaboration tools |
Embrace a dashboard-driven approach, and you’ll unlock greater transparency, agility, and impact across every marketing initiative. With TapClicks, you’re not just keeping up—you’re setting the pace.
Start Automating Your Marketing Data Today!
No Credit Card Required.

