

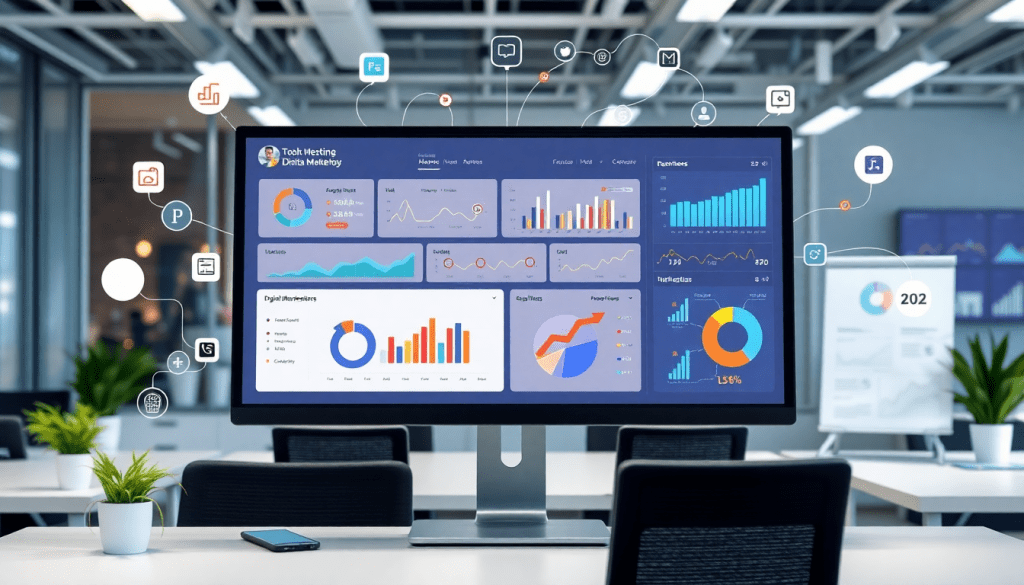
Digital Marketing KPI Dashboard: Visualize Metrics & Track Performance
A digital marketing KPI dashboard brings your most important marketing data into clear view—making it easy to monitor campaign performance, spot trends, and measure ROI across all your channels. With the right dashboard, teams can move beyond manual spreadsheets and static reports to interactive, automated visualizations that reveal real-time insights. This guide explores how a digital marketing KPI dashboard empowers marketers to make smarter, faster decisions, and shows you how to choose and use the best tools for your goals.
What Is a Digital Marketing KPI Dashboard?
A digital marketing KPI dashboard is a centralized, interactive tool that visualizes your most critical marketing metrics—known as key performance indicators (KPIs)—in a single, easy-to-understand view. Unlike static reports, which provide fixed snapshots of data at a particular point in time, a digital marketing dashboard offers real-time access to dynamic data, allowing marketers to monitor campaign performance, spot emerging trends, and make data-driven decisions as circumstances evolve.
At its core, the purpose of a KPI dashboard is to transform raw marketing data from multiple sources into actionable insights. By aggregating data from channels like paid search, social media, display advertising, email, and more, these dashboards enable teams to track performance against goals, identify what’s working, and quickly address underperforming areas. The ability to drill down into specific metrics or campaigns—rather than sifting through endless spreadsheets—saves time and ensures that decision-makers always have the most up-to-date information at their fingertips.
Real-time visualization is especially valuable for today’s marketers, who need to pivot strategies quickly in response to campaign performance. Interactive dashboards automatically refresh as new data comes in, eliminating guesswork and manual updates. This immediacy helps teams react faster, optimize budgets, and report results to stakeholders with confidence.
For a deeper look at how modern dashboards can streamline your analytics and reporting workflows, check out this guide on streamlining analytics reporting. With the right digital marketing KPI dashboard, your team can focus less on wrangling data and more on driving results.
Essential Marketing Metrics to Track
A digital marketing KPI dashboard is only as powerful as the metrics it brings into focus. Choosing the right key performance indicators (KPIs) is critical for marketers to truly understand campaign effectiveness, optimize spend, and demonstrate ROI. Here are some of the most important marketing metrics commonly tracked in high-performing dashboards:
- Impressions: This metric measures how often your ads or content are displayed to users. Impressions help gauge the reach and visibility of your campaigns across channels.
- Clicks: Tracking clicks reveals how many users engage with your ads, links, or calls-to-action. High click volume indicates strong audience interest and effective creative messaging.
- Conversions: Conversions capture the number of users who complete desired actions—such as making a purchase, filling out a form, or subscribing to a newsletter. This is a direct measure of campaign success.
- Cost Per Lead (CPL): CPL shows how much you’re spending to acquire each new lead. Monitoring CPL helps marketers control acquisition costs and allocate budget efficiently.
- Return on Ad Spend (ROAS): ROAS calculates the revenue generated for every dollar spent on advertising. It’s a core metric for assessing whether your marketing investment is delivering profitable returns.
Each of these KPIs provides a unique lens into campaign performance. For example, a dashboard that pairs impressions with clicks uncovers where your audience is seeing your ads but not acting, while comparing conversions with CPL and ROAS surfaces the most cost-effective channels and strategies.
A well-designed dashboard enables marketers to visualize and compare these metrics side by side—often in real time—empowering quick decisions and more agile campaign optimization. Instead of piecing together spreadsheets from multiple platforms, teams can instantly see which channels are outperforming, where budgets might be reallocated, and how trends are shifting over time. With marketing metrics brought together in one dashboard, marketers gain the clarity they need for proactive and data-driven management of every campaign.
Benefits of KPI Dashboards for Performance Tracking
A digital marketing KPI dashboard isn’t just a pretty interface—it’s a powerful tool that transforms how marketing teams track, analyze, and act on performance data. The advantages ripple across every stage of campaign management, delivering tangible improvements in efficiency, accuracy, and results.
Time Savings Through Automation
Manual data collection and report building can eat up hours each week—time that’s better spent on strategy and creative work. KPI dashboards automate the collection, normalization, and visualization of data from all your sources. For example, platforms like TapClicks have helped teams reclaim 50+ hours per analyst per month by seamlessly aggregating data and generating reports automatically. This automation reduces repetitive tasks and frees teams to focus on optimizing campaigns.
Centralized Data, Unified View
Instead of juggling dozens of spreadsheets or logging into multiple platforms, dashboards pull everything into one centralized hub. This single source of truth eliminates data silos, making it easy to see how all your channels, campaigns, and tactics are performing in real time. Centralization is especially valuable for agencies managing multiple clients or brands with many locations, allowing users to monitor performance at both macro and granular levels.
Improved Accuracy and Data Integrity
Manual reporting is prone to human error—missed numbers, copy-paste mistakes, or outdated figures. Automated KPI dashboards ensure your metrics are always up to date and accurately reflect what’s happening across channels. With consistent data flows and built-in validation, marketers can trust the numbers they see and confidently share reports with stakeholders.
Faster, Actionable Insights
With live data visualizations and interactive dashboards, marketers can instantly spot trends, outliers, or underperforming campaigns. This real-time visibility enables faster, data-backed decisions—whether that’s reallocating budget, pausing an ad set, or doubling down on what’s working. Advanced dashboards even highlight anomalies and recommend actions, so you’re always one step ahead.
Dashboards in Action: Real-World Impact
Consider an agency managing dozens of client campaigns. With a performance tracking dashboard, they can monitor impressions, clicks, conversions, and ROAS for every account from a single interface. If a campaign’s cost per lead spikes, the dashboard flags the issue immediately, allowing the team to investigate and optimize before it impacts ROI. Similarly, a multi-location brand can compare store-by-store performance and quickly identify regions that need attention.
In short, a marketing KPI dashboard turns raw data into a strategic asset—streamlining performance tracking, supporting smarter decisions, and ultimately driving better campaign outcomes. To see how these benefits play out in real-world scenarios, explore TapClicks’ unified dashboard solution and how it empowers data-driven marketing teams.
Why Seeing the Whole Marketing Picture Matters
In today’s digital world, marketing happens everywhere—across search, social, email, and more. To truly measure success, you need to see how all these channels work together. That’s where cross-channel analytics dashboards come in. They give you a unified view of your marketing performance, so you’re not left guessing which campaigns are delivering results.
What Does a Cross-Channel Dashboard Bring Together?
- Paid Channels: Google Ads, Facebook Ads, LinkedIn Ads, and more
- Owned Channels: Website analytics, email campaigns, blog traffic
- Earned Channels: Social shares, influencer mentions, organic reviews
With everything in one place, you can finally see how your efforts interact and where your real ROI lives.
The Headaches of Siloed Data
Trying to analyze disconnected data sets? Here’s what often happens:
- Manual Exporting: Endless downloading from multiple platforms
- Spreadsheet Overload: Reconciling columns and formats by hand
- Reporting Blind Spots: Missing how channels influence each other
- Duplicated Effort: Teams waste time on repetitive, manual work
- Inconsistent Metrics: Different platforms, different definitions—hard to compare apples to apples
How a Unified Dashboard Solves It All
A cross-channel analytics dashboard—like TapClicks—brings relief by:
- Auto-pulling data from every source
- Normalizing metrics so you can compare channels side by side
- Visualizing trends instantly to catch what’s working (and what’s not)
- Eliminating manual reporting—save dozens of hours every month
Result:
You get accurate, holistic insights to optimize spend, spot opportunities, and drive smarter strategy.
Get More from Your Analytics with TapClicks
TapClicks makes cross-channel reporting simple:
| Challenge | TapClicks Solution |
|---|---|
| Siloed data | 10,000+ data connectors unify every channel |
| Manual data wrangling | Automated ETL pipelines—no more spreadsheets |
| Inconsistent reporting | Normalized, side-by-side metrics in one dashboard |
| Time-consuming updates | Scheduled reports for clients and teams |
Want to see how unified dashboards can boost analytics reporting efficiency?
Check out real-world use cases and best practices to unlock the true potential of your campaigns.
Automated KPI Reports: Save Time and Reduce Errors
Manual marketing reporting is notorious for being time-consuming and error-prone. Analysts and marketing teams often spend hours (or even days) digging through disparate data sources, exporting spreadsheets, and building static reports—only for those reports to be outdated the moment they’re sent. Automated KPI reporting revolutionizes this process, enabling teams to deliver accurate, up-to-date insights with a fraction of the effort.
With automated KPI report generation, dashboards pull data directly from all your marketing channels—social, search, email, display, and more—on a scheduled basis. This means your reports are always current, and marketers can focus on analysis and strategy rather than repetitive data entry. Automation also dramatically reduces the risk of human error, ensuring data integrity and consistency across every report.
Platforms like TapClicks excel at automating KPI reporting. TapClicks connects with over 10,000 marketing, advertising, and business data sources, automatically extracting and transforming your data into branded dashboards and reports. With TapClicks, you can schedule recurring reports for internal teams or clients, set up smart email delivery, and leverage AI-powered summaries for instant understanding of campaign performance. This not only accelerates the reporting cycle but also enhances decision-making with real-time, trustworthy data.
Switching from manual to automated reporting can save analysts and agencies over 50 hours per month—time that can be reinvested into campaign optimization and client strategy. For a closer look at how automation can boost analytics reporting, check out this guide on automation boosting analytics reporting.
Ultimately, automated KPI dashboards empower marketing teams to move faster, reduce errors, and deliver more value from their data—all while ensuring stakeholders always have the most up-to-date metrics at their fingertips.
Interactive Performance Metrics & Data Visualization
The power of a digital marketing KPI dashboard lies in its interactivity—transforming raw data into actionable insights through dynamic visualizations. Unlike static reports, interactive dashboards allow marketers to drill down into campaign performance, uncover trends at a granular level, and instantly adapt their view based on current needs.
Best practices for marketing metrics visualization start with choosing the right chart types for each KPI. Time-series line graphs are ideal for tracking trends in impressions or conversions over weeks or months, while bar charts can quickly reveal top-performing channels or campaigns. Pie charts help visualize share of spend or conversion distribution, and heatmaps can surface patterns in user engagement or ad performance by time of day. Custom views and report layouts let teams tailor dashboards to showcase the metrics that matter most to their goals.
Interactivity takes these visualizations further. With advanced dashboards, users can filter by channel, date range, campaign, or audience segment—instantly updating graphs and tables to focus on relevant data slices. Want to compare the ROI of your paid search versus social campaigns? Simply toggle the appropriate filters. Need to monitor performance across multiple regions or clients? Customizable dashboards make multi-location and multi-client reporting seamless.
TapClicks empowers users with highly interactive dashboards, enabling deep dives into every layer of campaign data. Marketers can segment KPIs by source, drill into specific conversion paths, and schedule role-based reports that deliver the right insights to each stakeholder. This level of flexibility transforms reporting from a static chore into a strategic advantage, equipping teams to identify opportunities, respond to challenges faster, and continuously optimize campaign performance.
To explore how interactive dashboards can revolutionize your marketing analytics, visit TapClicks.
Leveraging AI for Deeper Marketing Data Insights
Modern digital marketing KPI dashboards are no longer just static repositories for data—they’re becoming intelligent, proactive partners in performance optimization, thanks to artificial intelligence. AI-powered marketing dashboards go beyond displaying metrics: they automatically surface actionable insights, identify trends, and even recommend optimizations, freeing marketers from hours of manual analysis.
One of the most transformative abilities of AI in marketing dashboards is predictive analytics. By analyzing historical campaign data and ongoing trends, AI models can forecast outcomes such as future conversions, budget pacing, or potential return on ad spend (ROAS). This empowers marketers to adjust strategies proactively, allocate budgets more efficiently, and set realistic performance benchmarks.
Anomaly detection is another game-changer. AI agents continuously scan dashboards for outliers—like sudden spikes in cost-per-lead (CPL) or unexpected drops in click-through rates (CTR)—and flag them in real time. Instead of wading through mountains of data, teams are immediately alerted to issues or opportunities, accelerating response times and minimizing wasted spend.
Beyond identifying problems, AI-driven dashboards also deliver actionable recommendations. Solutions like TapClicks’ AI Agents automatically analyze campaign data, suggest targeting adjustments, and highlight underperforming channels. Features such as SmartEmail can generate and send concise, AI-curated summaries of performance insights to stakeholders, ensuring everyone is aligned and empowered to act quickly.
By embedding predictive analytics, anomaly detection, and automated recommendations directly into your KPI dashboard, you transform reporting from a rear-view exercise into a forward-looking, strategic advantage. AI doesn’t just make dashboards smarter—it enables marketers to work faster, optimize campaigns with confidence, and unlock deeper value from their marketing data.
Choosing the Right Digital Marketing KPI Dashboard
Selecting the best digital marketing KPI dashboard for your organization is more than just a feature checklist—it’s about finding a platform that will scale with your growth, integrate seamlessly with your data sources, and empower all your teams to act on insights, not just data. Here’s how to navigate your options and make the right choice:
Key Factors to Consider
1. Scalability
Whether you’re managing a handful of campaigns or reporting across thousands of clients and locations, your dashboard must handle growth effortlessly. Look for solutions that support bulk reporting, high-volume data ingestion, and multi-tenant environments to ensure you won’t outgrow your platform.
2. Integrations
A truly unified view of marketing performance depends on robust integrations. The ideal dashboard will connect with all your key marketing, advertising, and business platforms—think Google Ads, Facebook, CRMs, analytics tools, and more. TapClicks stands out here with over 10,000+ ready-made data connectors and custom Smart Connectors, making it easy to bring in data from virtually any source.
3. Ease of Use
Your dashboard should be intuitive for both technical and non-technical users. Drag-and-drop interfaces, customizable templates, and built-in visualization tools are essential for fast adoption. TapClicks, for example, offers a user-friendly reporting studio and dashboard builder designed for marketers of all skill levels.
4. Customization & Flexibility
Every organization’s KPIs and workflows are unique. Choose a dashboard that allows you to tailor visualizations, set up custom metrics, automate reporting schedules, and brand reports for internal or client-facing needs.
5. Support & Training
Onboarding and ongoing support are critical, especially for enterprise or agency teams. Look for providers with responsive customer service, onboarding resources, and training to help your team get the most from the platform.
TapClicks vs. Other Dashboard Solutions
When comparing dashboard solutions like Funnel.io, Adverity, Datorama, Agency Analytics, and Supermetrics, it’s important to weigh each platform’s strengths:
- TapClicks offers unified scale, extensive integrations, workflow automation, and AI-driven insights—all in one platform. Its unique advantage is supporting thousands of dashboards and clients simultaneously, making it ideal for agencies, media companies, and enterprise brands with complex needs.
- Funnel.io and Supermetrics are strong on data extraction and transfer, but lack the built-in reporting, workflow, and AI insight features of TapClicks.
- Agency Analytics and NinjaCat are user-friendly for smaller agencies but may not scale for multi-location brands or larger teams.
- Datorama (Salesforce) is powerful for enterprise but can be complex and costly to implement.
For a detailed comparison and to see how TapClicks streamlines cross-channel reporting, check out this guide on boosting analytics reporting efficiency.
Implementation Steps
- Assess Your Needs: List your must-have integrations, user roles, and reporting requirements.
- Request a Demo: See the dashboard in action with your use cases. Providers like TapClicks offer tailored walkthroughs.
- Pilot with a Team: Roll out the platform with a core group to refine your setup.
- Customize & Automate: Build templates, automate data pulls, and set up recurring reports.
- Train & Roll Out: Leverage onboarding resources and training to maximize adoption across all users.
With the right digital marketing KPI dashboard, you can transform how your teams visualize, report on, and act upon your marketing data—driving smarter decisions and better results at every level.
Conclusion
A powerful digital marketing KPI dashboard is more than just a tool—it’s a game changer for marketers who want to make data-driven decisions, optimize campaigns, and clearly demonstrate ROI. By consolidating metrics from all channels and automating both reporting and visualization, these dashboards eliminate the headaches of manual reporting and data silos. The result? Marketers spend less time wrangling spreadsheets and more time interpreting insights and driving performance improvements.
Embracing an automated, cross-channel dashboard solution empowers teams to act on real-time data, spot opportunities, and respond to challenges faster than ever. With advanced features like AI-driven insights, predictive analytics, and customizable views, platforms like TapClicks are setting the new standard for marketing analytics—making it easier to unify data, collaborate, and scale success.
Ready to upgrade your marketing analytics? Take the next step by exploring TapClicks or requesting a personalized demo to see how a digital marketing KPI dashboard can transform your reporting, insights, and results.
Start Automating Your Marketing Data Today!
No Credit Card Required.

