

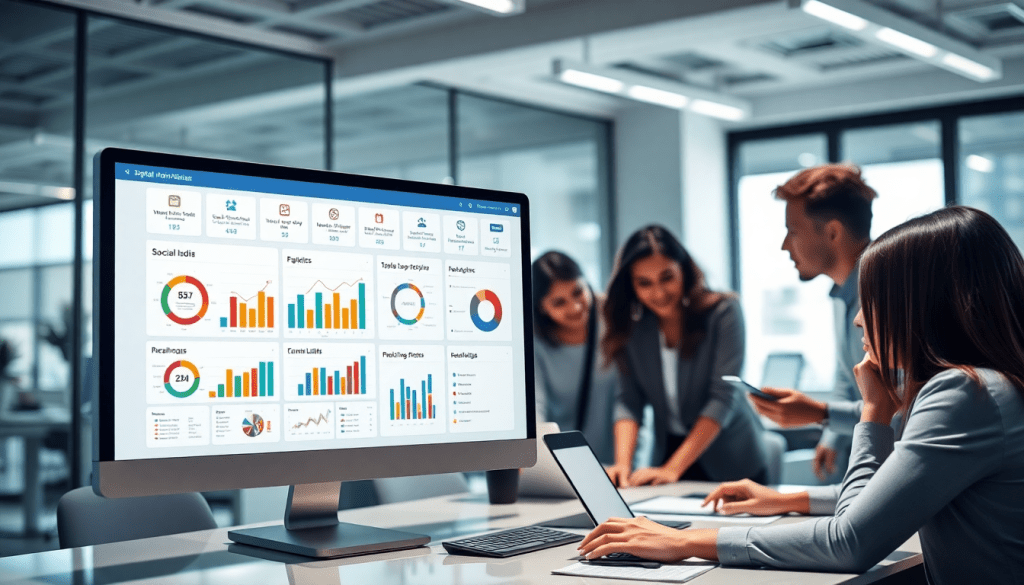
Digital Marketing KPI Dashboard: Visualize Metrics & ROI Fast
A digital marketing KPI dashboard gives marketers a single, real-time view of campaign performance across every channel—making it dramatically easier to spot trends, optimize spend, and share results with stakeholders. By automating reporting and consolidating marketing data, these dashboards provide teams with instant access to critical KPIs, ROI figures, and actionable insights. Whether you’re working in-house or at an agency, building the right dashboard is the key to making smarter, faster decisions that drive growth.
Why a Digital Marketing KPI Dashboard Is a Game-Changer
A digital marketing KPI dashboard does more than just display numbers—it transforms how teams monitor, analyze, and act on campaign performance. Here’s how it works and why it matters.
What Is a Digital Marketing KPI Dashboard?
Think of it as your marketing command center:
A digital marketing KPI dashboard is a centralized, interactive tool that automatically pulls together crucial metrics from all your campaigns—across every channel—and presents them in real time.
Key Features:
- Automated Data Aggregation: Pulls live data from multiple platforms (ad networks, web analytics, CRM, etc.).
- Visual Insights: Presents information using interactive charts, graphs, and tables.
- Unified View: Combines all your KPIs—like impressions, clicks, conversions, and ROI—on one screen.
- Real-Time Monitoring: Updates automatically, so you’re never working with outdated info.
Why Use a KPI Dashboard Instead of Spreadsheets?
| Traditional Reports/Spreadsheets | Digital Marketing KPI Dashboard | |
|---|---|---|
| Updates | Manual, often outdated | Automatic, always real-time |
| Data Sources | Siloed, needs manual merging | Unified, pulls from multiple sources |
| Visualization | Static tables/charts | Interactive, customizable views |
| Error Risk | Higher, due to manual entry | Lower, automation reduces mistakes |
| Decision-Making | Slower, requires extra analysis | Faster, actionable at a glance |
How Does a KPI Dashboard Help Marketers?
- Instant Clarity: No more tab-hopping or sifting through lengthy reports—see campaign health at a glance.
- Faster Optimization: Real-time data lets you spot trends, catch issues, and pivot strategy on the fly.
- Efficiency Gains: Automates reporting, reducing manual effort and freeing up time for analysis and action.
- Error Reduction: Automated pulls and calculations minimize human mistakes.
- Strategic Focus: With data overload tamed, teams can prioritize optimization and results.
Who Benefits Most?
- In-House Marketing Teams: Get a live snapshot of all channels for agile decision-making.
- Agencies: Manage multiple clients with consistent, branded reporting.
- Multi-Location Brands: Consolidate performance across regions, franchises, or business units.
Ready to Dive Deeper?
See examples, best practices, and real dashboards in action:
What is a Digital Marketing KPI Dashboard?
Essential Marketing Metrics to Track
To maximize the impact of your digital marketing efforts, it’s essential to focus on the right key performance indicators (KPIs). A well-designed KPI dashboard brings these metrics together in one place, giving marketers the clarity needed to drive results and optimize campaigns. Here are the top digital marketing KPIs every team should track—and why they matter:
1. Impressions:
Impressions measure how often your ads or content are displayed, regardless of whether they’re clicked. This metric helps gauge your brand’s visibility and reach across platforms. High impressions signal broad awareness, but must be paired with other metrics to measure true engagement.
2. Clicks and Click-Through Rate (CTR):
Clicks indicate how many times users interact with your ads or links. CTR (clicks divided by impressions) is crucial for understanding engagement and the effectiveness of your creatives and messaging. A high CTR means your content resonates with viewers; a low CTR can highlight areas for improvement.
3. Conversions:
Conversions represent completed actions that align with your campaign goals—such as form submissions, purchases, or downloads. Tracking conversions is vital for measuring the business impact of your marketing and understanding which channels or tactics deliver results.
4. Cost Per Acquisition (CPA):
CPA reveals how much you spend, on average, to acquire a new customer or lead. By monitoring CPA, marketers can optimize budgets, shift resources to high-performing channels, and ensure campaigns remain cost-effective.
5. Return on Investment (ROI):
ROI is the ultimate measure of marketing effectiveness, showing the financial return generated by your campaigns relative to their cost. A clear view of ROI helps justify spend, prioritize investments, and demonstrate value to stakeholders.
A digital marketing KPI dashboard simplifies the process of tracking these essential metrics—especially when campaigns span multiple channels like search, social, display, and email. Instead of manually collecting data from each platform, marketers can monitor all KPIs in real time from a single interface. This unified view not only saves hours of reporting work, but also makes it easier to spot trends, compare channel performance, and act quickly when opportunities or issues arise.
For organizations managing dozens or even hundreds of campaigns, a dashboard solution like TapClicks empowers teams to blend, normalize, and visualize metrics at scale—ensuring that every decision is backed by timely, actionable data.
Benefits of Automated KPI Reports
Automated KPI reports are a game-changer for marketing teams and agencies seeking both efficiency and impact. Unlike manual reporting—which often involves tedious data pulls, copy-pasting into spreadsheets, and last-minute formatting—automation delivers scheduled, accurate reports straight to your team or clients, freeing up hours every week. This not only streamlines the reporting process but also ensures stakeholders always have the most up-to-date performance metrics at their fingertips.
The advantages are clear: first, automation dramatically reduces the risk of human error. By connecting directly to your marketing platforms and pulling in data automatically, you eliminate manual data entry mistakes and inconsistencies. Second, automated reporting accelerates decision-making. Marketers can spot trends, optimize spend, and respond to campaign changes in real time, rather than waiting for monthly wrap-ups.
For agencies, automated KPI reports enhance client satisfaction by providing consistent, professional, and branded updates—often with customizable dashboards that reflect each client’s priorities. For in-house teams, automation means less time building reports and more time focusing on strategy and creative work.
Most importantly, automated reporting empowers data-driven decisions. With reliable, objective metrics delivered on schedule, organizations can benchmark performance, justify marketing spend, and quickly pivot strategies based on what the numbers reveal. To dive deeper into how automated reports and ROI tracking supercharge marketing operations, check out this guide on "Automated KPI Reports and ROI Tracking".
Visualizing Performance: Dashboard Features that Matter
A great digital marketing KPI dashboard does more than just compile numbers—it transforms raw data into intuitive, actionable stories. The best dashboards are built with features that make it simple for every user, from the CMO to the campaign analyst, to spot what’s working and where to focus next.
Drag-and-drop widgets are a must-have for flexible dashboard creation. With these, marketers can quickly assemble custom views that highlight the most relevant KPIs for each stakeholder. Whether you want to monitor website conversions, paid social spend, or email engagement side-by-side, drag-and-drop tools make it possible—no coding required.
Custom views let users personalize their dashboards for specific campaigns, clients, or reporting periods. For instance, an agency might create a high-level executive summary dashboard for clients, while analysts use detailed, channel-specific dashboards to dig into performance drivers. This tailoring ensures everyone gets the insights they need, without information overload.
Interactive charts and drill-downs turn static numbers into dynamic stories. Need to see why conversions spiked last week? With interactive elements, you can click on a metric to break it down by channel, creative, or audience segment in seconds. This empowers teams to explore the “why” behind the numbers, uncovering actionable insights that drive optimization.
For different roles, these visualization features are game-changers. CMOs and executives can scan high-level trends and ROI at a glance, making quick strategic decisions. Analysts get the granularity they need to identify bottlenecks or hidden opportunities. Clients, meanwhile, appreciate transparent, visually engaging reports that clearly show the impact of their investment.
Examples in action: Imagine a dashboard showing a real-time multi-channel funnel: the user can hover over each stage to see spend, conversion rate, and cost per acquisition by source. Or, a campaign performance heatmap highlights top and bottom-performing regions, with the option to drill down into individual locations for hyper-local optimization.
A platform like TapClicks brings all these features together in one unified solution, empowering marketing teams to visualize, understand, and act on their data—fast. By prioritizing intuitive visualization and interactivity, you not only make reporting easier, but unlock the full value of your marketing metrics.
Cross-Channel Analytics for Smarter Insights
In today’s fragmented marketing landscape, your audience isn’t just on one channel—they’re everywhere. That’s why consolidating data from multiple platforms like Google Ads, Facebook, email campaigns, and SEO tools is essential for a truly accurate picture of performance. A cross-channel analytics dashboard brings all your marketing data streams together, breaking down silos and revealing the bigger story behind your numbers.
By unifying disparate data sources, marketers can quickly spot patterns and attribution opportunities that would otherwise remain hidden. For example, you might discover that a spike in paid search clicks coincides with a successful email blast, or that organic social engagement is driving unexpected conversions in a different region. With a holistic view, you can finally answer tough questions: Which channels really drive ROI? Where are campaigns cannibalizing each other? Where can budgets be reallocated for maximum impact?
The real power of cross-channel dashboards lies in actionable, side-by-side comparisons. Interactive visualizations help you see how each channel contributes to overall goals, while drill-down capabilities let you explore performance at the campaign, ad group, or even individual creative level. This makes it much easier to optimize spend, attribute revenue, and report unified results to stakeholders without manual data wrangling.
To dive deeper into how cross-channel metrics can transform your marketing strategy, check out "Cross-Channel Metrics and Dashboards". Or, if you’re ready to see a unified analytics platform in action, explore the capabilities of TapClicks—built to make cross-channel insights accessible, scalable, and actionable for teams of any size.
Using AI for Marketing Data Insights
Artificial intelligence is transforming the way marketers analyze and act on campaign data. Today’s AI-powered dashboards do far more than display numbers—they proactively surface key trends, benchmarks, and optimization opportunities that might otherwise go unnoticed.
Smarter Trend Detection & Anomaly Alerts
With AI integrated into your marketing KPI dashboard, you no longer have to pore over spreadsheets to spot unusual spikes or drops. These platforms automatically scan your data in real time, flagging anomalies such as unexpected surges in CPC, dips in conversion rates, or sudden changes in channel performance. For example, TapClicks’ AI agents can send automated alerts when certain metrics deviate from historical norms, enabling teams to respond to issues or capitalize on new opportunities instantly.
Predictive Analysis for Forward-Looking Decisions
AI doesn’t just look backward—it helps you plan ahead. Predictive models analyze historical campaign data to forecast future outcomes, such as anticipated lead volume, spend pacing, or projected ROI. This enables marketers to make data-backed decisions about budget allocation and campaign tweaks before issues arise. Imagine receiving recommendations to reallocate budget mid-month to maximize conversions, all based on predictive insights generated automatically by your dashboard.
Automated Insights & Smart Recommendations
Modern AI marketing dashboards go beyond raw data by providing actionable, plain-language summaries and optimization tips. For instance, features like TapClicks’ SmartEmail can automatically generate and deliver custom insight summaries to stakeholders—saving hours of manual analysis and ensuring everyone is aligned on performance drivers. These AI-powered insights can include campaign scoring, channel mix suggestions, and even personalized to-do lists for campaign managers.
Proactive, Data-Driven Decision-Making
The biggest advantage of AI in dashboarding is how it empowers marketers to act faster and smarter. Instead of waiting for end-of-month reports, teams can respond to trends and recommendations in real time. This means more agile campaigns, better budget efficiency, and the ability to prove ROI with confidence.
To learn more about how AI is elevating marketing analytics, check out the TapClicks platform—where automated insights and smart recommendations are built into every dashboard.
Customizing Dashboards for Stakeholders
Building a digital marketing KPI dashboard is only half the battle—true impact comes from tailoring your dashboards to the unique needs of each stakeholder. Executives, marketing managers, and clients all have different priorities and levels of data fluency, so customization is crucial for clarity and engagement.
For executive teams, focus on high-level overviews: ROI, budget pacing, and strategic KPIs that align with business objectives. Dashboards for this audience should be streamlined, visually compelling, and highlight only the most critical metrics. Incorporate summary widgets, top-line trend graphs, and automated insight highlights so decision-makers can grasp performance at a glance.
Marketing managers need the ability to dig deeper. Provide interactive charts, drill-down options, and campaign-level breakdowns to help them identify optimization opportunities and troubleshoot quickly. Features like filterable views, channel comparisons, and cohort analyses empower managers to make fast, informed adjustments.
Clients—especially those served by agencies—expect transparency and clear communication. Role-based access and branded client portals ensure each client sees only their own data in a secure, on-brand environment. Automated, scheduled reports and custom dashboards can be tailored to client goals, whether that’s lead generation, e-commerce sales, or brand awareness. Simple visualizations, annotated highlights, and contextual explanations go a long way in demystifying complex analytics for non-technical stakeholders.
When customizing dashboards, keep these best practices in mind:
- Prioritize clarity: Avoid data overload by surfacing only what’s relevant for each user.
- Leverage branded templates: Use consistent colors, logos, and report formats for professionalism and trust.
- Enable self-service: Allow stakeholders to interact with their dashboards—filtering by date, channel, or campaign—so they can find answers independently.
- Tell a story: Guide viewers through the data with clear headings, summaries, and visual cues that spotlight wins and areas for improvement.
The TapClicks platform makes customizing dashboards simple with role-based permissions, white-label branding, and flexible reporting options. By delivering the right insights to the right people, you not only build trust but also drive smarter, faster marketing decisions for every stakeholder.
Choosing the Right Digital Marketing KPI Dashboard Solution
Selecting the ideal digital marketing KPI dashboard is a crucial decision that can shape the effectiveness of your marketing operations. With countless options on the market, it’s important to focus on solutions that deliver on the fundamentals—while offering the flexibility and scale you’ll need as your data grows.
Key Criteria to Consider:
- Data Integrations: Look for a platform with robust native integrations across ad networks, social media, analytics, CRM, and eCommerce tools. The more sources you can unify, the more complete your insights will be.
- Scalability: Whether you’re managing a handful of campaigns or thousands of clients, your dashboard platform should handle high data volumes, complex hierarchies, and multi-location reporting with ease.
- Ease of Use: Drag-and-drop interfaces, intuitive navigation, and customizable widgets ensure that everyone—from analysts to executives—can access and understand the data they need.
- Automation: Automated ETL, scheduled reporting, and AI-powered insights are must-haves for saving time, reducing manual errors, and surfacing actionable recommendations.
- Support and Customization: Responsive support, onboarding resources, and the ability to tailor dashboards for different stakeholders (e.g., clients, managers, execs) all contribute to a smoother experience.
Popular Platforms at a Glance:
While tools like Funnel.io, Adverity, and Agency Analytics offer data pipelines or lightweight reporting, comprehensive platforms such as TapClicks set themselves apart by combining deep data integration, powerful AI insights, and end-to-end workflow management. With over 10,000 connectors, automated reporting, and scalable client management, TapClicks unifies everything marketers need into a single, customizable hub.
Take the Next Step:
Before committing, assess your team's specific needs—considering scale, reporting complexity, and integration requirements. Most leading platforms, including TapClicks, offer demos or free trials, allowing you to experience firsthand how a unified dashboard can transform your marketing performance.
Choosing wisely now ensures you’re equipped to drive results—and ROI—well into the future.
Conclusion
A digital marketing KPI dashboard is more than a reporting tool—it’s your team’s competitive edge for driving smarter strategy, faster optimization, and stronger ROI. By automating data collection and visualization, dashboards give marketers at every level a clear, real-time view of what’s working and where to focus next. Whether you’re managing campaigns across dozens of channels or reporting to multiple stakeholders, a unified dashboard streamlines analytics, reduces manual effort, and empowers data-driven decisions that fuel growth.
Embracing a modern KPI dashboard transforms how teams measure success by making performance metrics instantly accessible, actionable, and easy to understand. The result? Better collaboration, quicker pivots, and greater confidence in your marketing investments.
Ready to unlock the full value of your marketing data? Dive deeper into how digital marketing KPI dashboards can accelerate your ROI or explore the TapClicks platform to see how unified dashboards, automation, and AI-powered insights can elevate your marketing operations.
Start Automating Your Marketing Data Today!
No Credit Card Required.

