

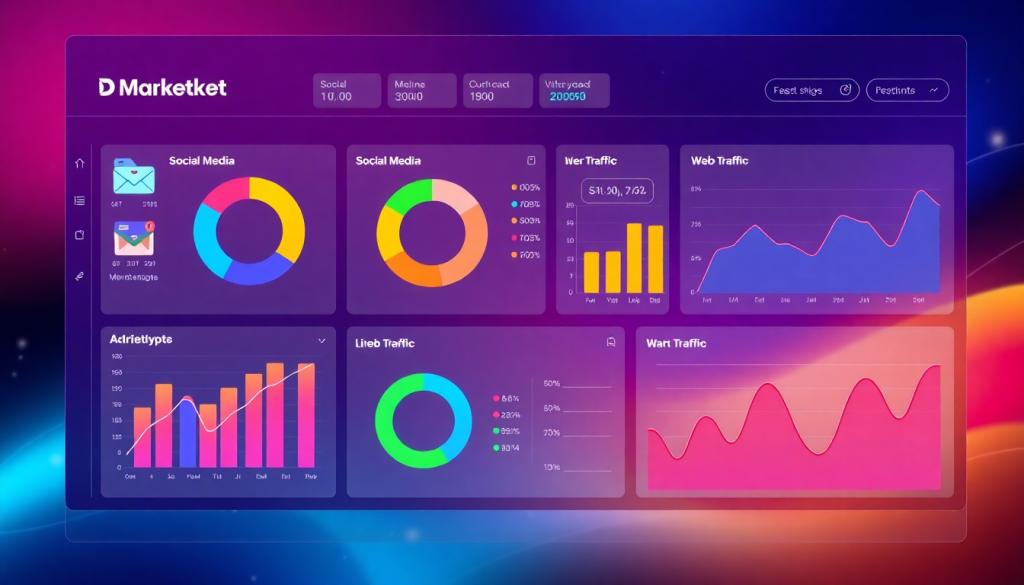
Digital Marketing KPI Dashboard: Visualize Metrics & ROI Fast
Effective marketing hinges on understanding which efforts drive results—and being able to visualize those outcomes in real time. A digital marketing KPI dashboard brings all your campaigns, channels, and key performance indicators (KPIs) into one unified view, making it easy to spot trends, measure ROI, and optimize strategy. With advances like AI insights, automated KPI reports, and interactive cross-channel analytics, marketers now have powerful tools to turn data into action. Let’s explore how a modern dashboard can transform the way you track, analyze, and report on digital marketing performance.
What is a Digital Marketing KPI Dashboard?
A digital marketing KPI dashboard is a centralized, interactive interface that brings together all your key performance indicators (KPIs) and campaign metrics across digital channels—think paid search, social media, email, SEO, and beyond—into a single, easy-to-understand view. At its core, this dashboard functions as your marketing command center: it continuously gathers data from multiple platforms, visualizes real-time performance, and helps you pinpoint what’s driving results (and what isn’t).
For marketing teams and agencies, the importance of real-time metric visualization can’t be overstated. Rather than toggling between dozens of tools or waiting for manual reports, a KPI dashboard provides instant access to up-to-date insights. This not only speeds up decision-making but also enhances transparency for clients and stakeholders, who can see campaign progress and ROI unfold as it happens.
By centralizing performance tracking, digital marketing KPI dashboards eliminate data silos and help unify reporting. Whether you’re managing hundreds of campaigns or multiple brands, a dashboard makes it possible to monitor everything from impressions and clicks to conversions and revenue in one place. The result: you’re empowered to quickly identify trends, spot anomalies, and optimize strategies on the fly.
For a deeper dive into what defines a digital marketing KPI dashboard and why it’s essential, check out What is a Digital Marketing KPI Dashboard?
Essential Metrics: What Should You Track?
The foundation of any digital marketing KPI dashboard is the set of metrics it tracks. But with a vast universe of possible data points, how do you focus on what matters most? The answer: choose KPIs that align directly with your business goals—and tailor them to each marketing channel.
Key Marketing KPIs by Channel
- Paid Media (PPC, Display, Social Ads): Impressions, clicks, click-through rate (CTR), cost per click (CPC), cost per conversion, conversion rate, and return on ad spend (ROAS) are critical for evaluating the impact and efficiency of paid campaigns.
- Organic Search: Track keyword rankings, organic sessions, bounce rate, time on site, and conversions from organic traffic to measure SEO effectiveness.
- Social Media: Engagement rate (likes, shares, comments), follower growth, reach, impressions, and social-driven conversions help gauge brand visibility and audience interaction.
- Email Marketing: Open rates, click-through rates, unsubscribe rates, and email-attributed conversions offer a direct view into campaign relevance and recipient engagement.
- Website & Content: Pageviews, unique visitors, average session duration, goal completions, and content shares indicate how well your site and assets attract and convert users.
Selecting KPIs That Serve Your Objectives
Not all KPIs are created equal. The most effective dashboards focus on metrics that tie back to your specific business objectives—whether that’s driving leads, increasing online sales, or boosting brand awareness. For example, a B2B company prioritizing lead generation may focus on form submissions and qualified leads, while an e-commerce brand might zero in on add-to-cart rates and revenue per visitor.
Examples of High-Impact Metrics
- ROI Tracking: ROAS, cost per acquisition (CPA), and customer lifetime value (CLTV) demonstrate the bottom-line impact of your efforts.
- Engagement: Metrics like average engagement rate or session duration highlight how well your content resonates.
- Conversions: Track total conversions and conversion rates at every funnel stage—from landing page signups to final purchases—to identify bottlenecks and opportunities.
The Value of Campaign KPI Monitoring
Continuous campaign KPI monitoring enables marketers to spot emerging trends, quickly identify underperforming tactics, and pivot strategies proactively. A well-built dashboard doesn’t just collect data—it transforms it into actionable digital campaign reporting, helping teams and clients understand exactly what’s working, what’s not, and where to invest next.
With a unified approach to KPI selection and monitoring, your dashboard becomes a strategic command center, turning raw numbers into clear, goal-driven insights. To see how a robust KPI dashboard can centralize your metrics and accelerate reporting, learn more at TapClicks.
Cross-Channel Analytics: See the Whole Story, Not Just the Highlights
Today’s marketers juggle dozens of platforms—Google Ads, Facebook, programmatic, SEO, email, even offline channels. Looking at results in isolation just doesn’t cut it anymore. That’s where cross-channel analytics dashboards come in, bringing your entire marketing story into one, unified view.
Why Cross-Channel Dashboards Matter
With a holistic dashboard, you can:
- Blend all your data: Paid, owned, earned media, and offline touchpoints—all in one place.
- Spot trends and patterns: See how different campaigns and channels influence each other.
- Uncover true attribution: Map out the full customer journey, not just the last click.
- Find optimization opportunities: Quickly identify what’s working, what’s stalling, and where to invest next.
Imagine This:
| Channels Integrated | What You Discover |
|---|---|
| Google Ads + Facebook Ads | Which ad platform truly drives conversions |
| SEO + Paid Search | How organic and paid traffic complement each other |
| Email + Social + Offline | Where multi-touch journeys boost ROI |
| All Channels Unified | Where customers drop off or convert in the funnel |
How TapClicks Makes It Seamless
Platforms like TapClicks take the heavy lifting out of cross-channel analytics:
- Automated Data Integration: No more copy-paste or endless spreadsheets.
- Data Enrichment & Normalization: Metrics are standardized—apples to apples, every time.
- Real-Time Visualization: Instantly see campaign performance, without dashboard hopping.
- One-Click Reporting: Share insights with stakeholders in seconds.
Real-World Results
With TapClicks, marketers can:
- Save hours (even days) on manual reporting
- Make faster, data-driven decisions for budget reallocation or creative tweaks
- Clearly demonstrate ROI and campaign value to clients or execs
Want to see what a unified dashboard looks like?
Check out this guide: Visualize & Track Metrics Across Channels
With cross-channel analytics, you’re not just collecting data—you’re connecting the dots for smarter strategy and better results.
Automation & AI: Smarter Reporting, Less Manual Work
Manual reporting is a notorious time sink for marketing teams, often leading to delays, inconsistencies, and missed insights. Automation and AI are transforming this landscape, empowering marketers to focus on strategy rather than spreadsheet wrangling.
Automated KPI reports eliminate repetitive tasks by continuously pulling data from every marketing channel—social, paid search, email, and more—into a single dashboard. This not only ensures that your reports are always up to date, but also dramatically reduces the risk of human error. With tools like TapClicks, you can schedule branded, client-ready reports to run automatically, freeing up 50+ hours per analyst each month to focus on higher-impact initiatives.
But automation is just the beginning. Modern marketing dashboards leverage AI to go beyond basic reporting with features like predictive analytics, anomaly detection, and automated insight generation. For example, AI-powered agents within a dashboard can scan your campaign data, surface unexpected spikes or drops, and even suggest optimization actions—helping you catch issues or capitalize on trends before your competitors do.
Interactive performance metrics further elevate your analysis. Rather than static charts, marketers can drill down into campaign results, compare segments, or test different attribution windows on the fly. AI-driven recommendations and scorecards highlight what’s working and where to pivot, so your team can make faster, smarter decisions.
In short, automation and AI don’t just save time—they unlock a new level of accuracy, agility, and competitive advantage in digital marketing KPI tracking.
Designing a Performance Tracking Dashboard that Works
A well-designed performance tracking dashboard isn't just attractive—it’s an indispensable tool for marketers to drive results, make better decisions, and communicate value to stakeholders. To maximize its impact, focus on three key areas: clarity, customization, and real-time updates.
Clarity Above All
The best dashboards cut through the noise. Prioritize essential KPIs and use clear visualizations (like bar charts, line graphs, or scorecards) that make trends and anomalies obvious at a glance. Group related metrics together and maintain consistent color-coding to help users interpret data quickly. Avoid overwhelming users with too many widgets or unnecessary detail; instead, provide drill-down options for deeper exploration when needed.
Customization for Every Stakeholder
Every team—whether executive, marketing, or sales—needs different insights. Tailor dashboards so each audience sees the metrics most relevant to their goals. For example, agency clients may want high-level ROI and campaign highlights, while analysts need granular, channel-level data. Platforms like TapClicks make this easy with role-based access, allowing you to create different views, automate client reporting, and ensure secure data segmentation.
Real-Time Updates to Drive Action
Dashboards are most powerful when they reflect the latest performance. Automate your data integrations so dashboards update in real time or on a frequent schedule. This enables teams to spot trends, react to issues, and seize opportunities without delay. Make sure your dashboard tools can aggregate data from all your sources—paid media, social, email, web analytics, and more—for a truly unified view.
Make Dashboards Interactive and Actionable
Add filters, date ranges, and segmentation options so users can slice data by campaign, region, or audience. Interactive dashboards empower users to answer questions on the fly, without waiting for a new report. Include annotations or AI-generated insights to provide context, highlight anomalies, or suggest next steps—turning raw metrics into actionable intelligence.
Avoid Common Pitfalls
Resist the urge to track every possible metric. Data clutter leads to confusion and obscures what matters. Instead, revisit your dashboard regularly to ensure every widget earns its place. Always provide context: compare performance to benchmarks, goals, or previous periods so users understand what “good” looks like. And double-check that all data is accurate and timely—nothing erodes trust faster than outdated or incorrect reports.
By following these best practices, your digital marketing KPI dashboard will become a strategic command center—enabling your team to focus, adapt, and deliver measurable impact.
ROI Tracking for Marketers: Measuring What Matters
For marketers, the ultimate question behind every campaign is: “Are we getting a return on our investment?” Accurate ROI tracking is crucial—not just for proving value to stakeholders, but for guiding smarter budget allocation and campaign optimization. A digital marketing KPI dashboard makes measuring ROI both accessible and actionable by unifying spend, performance, and revenue data in a single, intuitive view.
Gone are the days of chasing fragmented reports from disparate ad platforms or manually stitching spreadsheets together. Modern dashboards connect directly to your marketing data sources—across paid, organic, social, email, and beyond—automating the process of tracking costs versus outcomes. This means you can instantly see which channels deliver the highest ROI, where conversions are happening, and how each dollar spent impacts your bottom line.
What sets a robust marketing dashboard apart is its ability to tie campaign spend directly to conversions and revenue. By connecting ad costs, clicks, leads, and sales data, marketers gain a holistic view of performance. For example, instead of just tracking click-through rates, you can visualize the full journey from impression to purchase—and understand the true cost per acquisition or return on ad spend (ROAS) for every initiative.
Dashboards also empower marketers to optimize budgets in real time. With up-to-date ROI metrics, you can quickly identify underperforming campaigns and reallocate spend to the channels or tactics driving the most value. This agile resource management not only maximizes impact but helps prevent wasted investment.
If you’re ready to take the guesswork out of marketing ROI, explore how unified dashboards can help you visualize metrics and track ROI. With the right solution, you’ll have the clarity needed to prove—and improve—the impact of your digital marketing efforts.
Transforming Raw Data into Real Marketing Wins
A digital marketing KPI dashboard is only as valuable as the actions it inspires. Instead of treating dashboards as static reports, leading marketing teams leverage them as engines for real-time decision-making, rapid optimization, and organizational learning.
Why Dashboards Matter: Moving from Data to Decisions
A well-designed marketing dashboard should do more than just display numbers. Here’s what sets an actionable dashboard apart:
- Surface “Why,” Not Just “What”
- Go beyond basic metrics. AI-powered dashboards (like those in TapClicks) uncover patterns, root causes, and correlations—answering not just what happened, but why.
- Real-Time Troubleshooting
- Spot issues like a sudden drop in conversions or a spike in ad spend as soon as they happen.
- Instantly investigate:
- Did your traffic sources shift?
- Was there a demographic change?
- Did a particular creative underperform?
Turning Insights into Action: What High-Performing Teams Do
The most agile marketing teams use dashboards to:
- Act Fast on Trends and Anomalies
- Example: If paid social campaigns start outperforming email, shift your budget in real time to maximize ROI.
- Use automated alerts to avoid missing critical moments.
- Optimize Campaigns Continuously
- A/B test creative as soon as engagement dips.
- Tweak targeting or pause underperforming ads immediately—no waiting for month-end reviews.
- Collaborate Across Teams
- Share live dashboards and AI-generated insight summaries with all stakeholders.
- Enable everyone from CMO to campaign manager to make data-backed decisions.
Fostering a Data-Driven Marketing Culture
Making dashboards part of your marketing DNA means:
- Reviewing Insight Summaries Regularly
- Use TapClicks SmartEmail or scheduled KPI reports to keep everyone informed.
- Encouraging Organization-Wide Learning
- Celebrate quick wins and share lessons from data-driven experiments.
- Aligning Marketing with Business Goals
- Ensure every campaign, adjustment, and budget allocation can be traced back to real performance data.
How TapClicks Supercharges Data-Driven Marketing
With TapClicks, marketers get:
| Benefit | What It Means for You |
|---|---|
| Unified Source of Truth | Aggregate, normalize, and visualize all your marketing data—no silos. |
| Automated AI Insights | Get instant answers to “why” performance shifts happen. |
| Real-Time Optimization | Act immediately with live data and automated recommendations. |
| Scalable Reporting | Keep every client, stakeholder, and team member in the loop with automated, branded reports. |
Bottom Line:
With platforms like TapClicks, dashboards become more than reports—they’re engines for continuous improvement, smarter decisions, and measurable marketing success.
Choosing the Right Digital Marketing KPI Dashboard Solution
Selecting the best digital marketing KPI dashboard is a critical decision that can impact your team’s productivity, client satisfaction, and overall marketing ROI. With countless solutions on the market, it’s important to focus on a few essential features and to ask the right questions during your evaluation.
1. Must-Have Features for Your KPI Dashboard
-
Robust Integrations: Make sure your dashboard connects seamlessly to all the marketing, advertising, and business platforms you use—think paid search, social, analytics, CRM, and more. The ability to unify data from 10,000+ sources, as seen in leading platforms, ensures you can centralize performance tracking without manual workarounds.
-
Scalability: Whether you’re an agency juggling hundreds of clients or a brand with dozens of locations, your dashboard should handle large volumes of data and users—without sacrificing speed or reliability.
-
Security & Access Controls: Data privacy is non-negotiable. Look for a solution with enterprise-grade security features, role-based access, and granular permissions to protect sensitive information.
-
Customization: No two businesses track performance the same way. Your dashboard should offer customizable widgets, branding, and reporting formats to meet the unique needs of your stakeholders.
-
Advanced Analytics & AI: Modern dashboards go beyond static charts. Features like automated insights, anomaly detection, and predictive analytics can help you spot trends and optimize campaigns faster.
-
Automated Reporting: Scheduled, branded reports that reach the right people (internally or externally) save hours every week and reduce the risk of human error.
2. All-in-One Platforms vs. Point Solutions
All-in-one marketing operations platforms, such as TapClicks, provide a unified experience for data integration, analytics, reporting, and workflow. This approach eliminates the headache of stitching together multiple point solutions, reduces costs, and ensures consistency across your operations. In contrast, point solutions (like standalone reporting or dashboard tools) may be easier to implement initially but often struggle with scale, data harmonization, or automation as your needs grow.
3. Key Questions to Ask When Evaluating Dashboard Tools
- Does the solution support all your current and future data sources?
- Can it handle your scale—number of users, dashboards, clients, or locations?
- What security and compliance features are in place?
- How customizable are the dashboards and reports?
- Are AI-driven insights and automated recommendations available?
- What is the level of customer support and onboarding provided?
- How does pricing scale as your business grows?
By focusing on integrations, scalability, security, and smart automation, you can choose a digital marketing KPI dashboard that empowers your team to visualize metrics and prove ROI—fast. For a deeper look at what a unified dashboard can do, explore TapClicks’ all-in-one platform and see how you can streamline your marketing analytics from day one.
Start Automating Your Marketing Data Today!
No Credit Card Required.

