

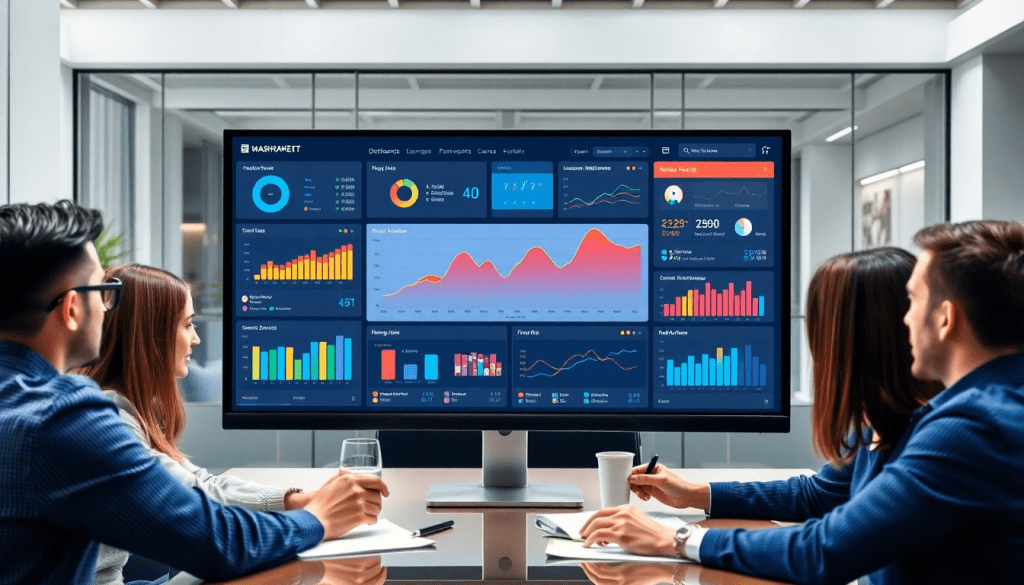
Digital Marketing KPI Dashboard: Visualize Metrics & ROI Fast
A digital marketing KPI dashboard is more than just a pretty interface—it’s a mission-critical tool for marketers who need instant clarity on campaign performance, ROI, and strategic opportunities. By consolidating marketing metrics from every channel into one real-time view, these dashboards eliminate manual reporting headaches and unlock sharper, data-driven decisions. Whether you’re managing dozens of campaigns or optimizing spend across platforms, the right KPI dashboard streamlines performance tracking, surfaces actionable insights, and empowers teams to deliver stronger results with less effort.
What Is a Digital Marketing KPI Dashboard?
A digital marketing KPI dashboard is your single source of truth for campaign performance. It brings together critical data from all your channels—paid search, social, display, email, and more—into a visual, interactive workspace that’s designed for quick insights and smarter decision-making.
Why Use a KPI Dashboard?
- Eliminates Data Silos: No more switching between platforms or wrangling spreadsheets.
- Instant Clarity: See the big picture and granular details in one place.
- Drives Real Action: Spot trends, diagnose issues, and optimize campaigns on the fly.
What Makes These Dashboards Different?
Not all dashboards are created equal. Here’s what sets a true marketing KPI dashboard apart:
| Feature | What It Means for You |
|---|---|
| Multi-channel Data Integration | Pulls in real-time metrics from every marketing tool you use. |
| Customizable Visualization | Lets you build charts and widgets that track the KPIs that matter most. |
| Real-time Updates | Keeps your team on the same page with the latest numbers—always. |
| Actionable Insights | Highlights anomalies, benchmarks, and growth opportunities—automatically. |
What Does a KPI Dashboard Actually Do?
With a KPI dashboard, you can:
- Monitor campaign health across all channels in one view.
- Contextualize metrics like CTR, conversions, and ROAS—see what’s normal and what needs attention.
- Optimize quickly by drilling down into underperforming areas.
- Report results to stakeholders with automated, branded visuals.
Who Benefits Most?
- Marketing teams juggling multiple platforms and campaigns.
- Agencies and media companies managing reporting for dozens or hundreds of clients.
- Brands looking to unify reporting and drive ROI at scale.
Ready to see how streamlined campaign performance tracking can be?
Check out TapClicks’ digital marketing KPI dashboard overview for real-world features, benefits, and use cases.
Essential Metrics to Track on Your Dashboard
Choosing the right KPIs for your digital marketing dashboard is the foundation of effective performance tracking and ROI analysis. At a minimum, your dashboard should include core metrics such as Cost Per Acquisition (CPA), Click-Through Rate (CTR), conversions, Return on Investment (ROI), and Customer Lifetime Value (CLTV). These KPIs provide a direct line of sight into campaign efficiency, audience engagement, and the bottom-line impact of your marketing spend.
For example, tracking CPA reveals how much you’re paying for each new customer, while CTR highlights how compelling your creative and calls-to-action are across different channels. Monitoring conversions—whether that’s a sale, a lead form submission, or another goal—shows which campaigns are driving meaningful results. Calculating ROI ensures you’re investing in the highest-performing tactics, not just the ones with the most clicks or impressions.
Regularly monitoring these KPIs isn’t just about numbers; it’s about accountability and transparency. A well-built dashboard allows you to instantly see if campaigns are hitting targets, where budgets may be wasted, and how performance trends evolve over time. This visibility is critical for agencies needing to prove value to clients, as well as for in-house teams tasked with justifying spend and demonstrating marketing’s impact on business outcomes.
Automated KPI reporting takes this a step further—tools like TapClicks’ digital marketing dashboards can schedule and deliver KPI summaries directly to stakeholders’ inboxes, ensuring everyone stays aligned without the need for time-consuming manual updates. This keeps decision-makers in the loop, promotes data-driven collaboration, and frees up valuable analyst time for deeper strategic work.
Finally, customizing your dashboard to fit each channel or campaign is best practice. While some KPIs (like CTR) are universal, others—such as Cost Per View for video, Engagement Rate for social, or Share of Voice for brand campaigns—should be tailored to your specific goals and platforms. By thoughtfully selecting and organizing your metrics, your dashboard becomes a powerful tool for both high-level overviews and granular optimization across the entire marketing funnel.
Cross-Channel Analytics: Unifying All Your Campaign Data
In today’s fragmented marketing landscape, campaigns span a dizzying array of platforms—Google Ads, Facebook, programmatic display, email, SEO, and more. Without a unified view, measuring true performance and ROI can feel impossible. That’s where a cross-channel analytics dashboard becomes indispensable.
By integrating data from every paid, owned, and earned media channel, a cross-channel dashboard reveals the complete story behind your marketing efforts. Instead of toggling between siloed reports or spreadsheets, marketers gain instant access to holistic insights: Which channels drive the highest conversions? Where is your budget delivering the strongest ROI? Are there underperforming touchpoints draining resources?
This unified approach to marketing data doesn’t just save time—it fuels smarter decisions. With all metrics normalized and visualized side by side, marketing teams can quickly spot trends, attribute results accurately, and allocate resources where they’ll make the biggest impact. For agencies and enterprise teams managing multi-client or multi-location campaigns, the ability to blend and compare performance across sources is game-changing.
To see how this works in practice, TapClicks offers a cross-channel dashboard solution that pulls in data from over 10,000 connectors, enabling fully automated, customizable analytics at scale. The result? Better collaboration, clearer performance insights, and a foundation for continuous optimization—no matter how complex your marketing mix becomes.
Learn more about how TapClicks can help you unify your marketing data and unlock actionable insights at TapClicks.com.
Bringing Your Marketing Data to Life: Why Interactive Dashboards Matter
Interactive dashboards have changed the way marketers engage with their data. Gone are the days of static spreadsheets and flat PDF reports. Today, dynamic, customizable dashboards make it easy to spot what’s working—and what isn’t—so you can act fast.
What Sets Interactive Dashboards Apart?
- Real-Time Visualization:
See up-to-the-minute data without waiting for manual exports or end-of-week updates. - Instant Filtering:
Quickly filter by date range, campaign, channel, or audience segment to surface trends or spot outliers. - Immediate Alerts:
Notice performance dips—like a sudden drop in CTR—and respond before budget is wasted.
Key Features at Your Fingertips
Here’s what makes interactive dashboards so powerful for marketing teams:
| Feature | What It Lets You Do |
|---|---|
| Drag-and-drop widgets | Build dashboards that match your workflow—no coding required |
| Dynamic filters | Toggle between channels (search, social, display) or drill into specific campaigns with a single click |
| Drill-down capability | Go from high-level metrics (e.g., ROI) down to specific ad groups and creatives |
| Custom views | Tailor dashboards for execs, channel leads, or clients—each sees what matters most |
Example in Action
Imagine a paid search campaign’s CTR drops overnight. Instead of waiting for a static report, your dashboard flags the change immediately. You click to drill down, find the underperforming ad group, and reallocate spend—all before the next coffee break.
Why It Matters
- Faster Decisions: Respond to trends as they happen, not days later.
- Better Budget Control: Move ad dollars to what’s working, pause what’s not.
- Tailored Insights: Give each stakeholder the view they need—no information overload.
The TapClicks Edge
For marketers running multiple campaigns and channels, platforms like TapClicks provide:
- Unified data from 10,000+ sources
- Highly customizable, interactive dashboards
- Automated reporting and instant visualization
Bottom line:
Interactive dashboards transform raw marketing data into actionable insights—so your team can move from analysis to action, without missing a beat.
Automated KPI Reports: Save Time & Eliminate Manual Work
One of the most transformative features of a digital marketing KPI dashboard is its ability to automate reporting, turning what was once a laborious, manual process into a seamless, set-and-forget workflow. Instead of building spreadsheets or assembling slide decks by hand, marketers can now schedule delivery of customized, branded KPI reports to the right stakeholders—whether that’s internal teams, clients, or executives—at whatever cadence they prefer (daily, weekly, monthly, or even in real time).
With platforms like TapClicks’ automated reporting capabilities, it’s easy to configure reports that are tailored to different audiences. Marketers can define which metrics and visualizations matter most for each recipient, apply role-based permissions to control access, and ensure every report reflects their agency or brand's unique style. The result? Everyone receives the information they need, in the format they prefer, without overloading your team with repetitive reporting tasks.
The benefits go beyond just time savings. Automated KPI reports reduce errors caused by manual data entry, guarantee up-to-date numbers, and free up analysts and campaign managers to focus on what really matters: interpreting results, uncovering insights, and driving strategy. Instead of spending hours wrangling data, teams can devote their energy to optimizing campaigns and delivering greater ROI.
By embracing automated KPI reporting, your organization can keep stakeholders informed, maintain transparency, and reclaim hours each week—accelerating your path to smarter marketing decisions and stronger business outcomes. To see how TapClicks streamlines reporting at scale, visit TapClicks.
AI Marketing Dashboards: Smarter Insights, Faster Decisions
Modern marketing dashboards are no longer just about displaying yesterday’s numbers—they’re about driving tomorrow’s strategy. With AI at the helm, dashboards transform from static reports into dynamic intelligence engines that empower teams to act, not just observe.
What Sets AI Dashboards Apart?
AI-powered marketing dashboards do more than aggregate campaign data. Here’s how they elevate your analytics:
-
Proactive Analysis:
AI agents continuously scan your data for patterns, anomalies, and opportunities—no manual digging required. -
Predictive Power:
Dashboards forecast performance, suggest budget reallocations, and flag campaigns that need attention. -
Optimization Recommendations:
Get real-time suggestions for improving KPIs, from adjusting spend to refining targeting. -
Automated Trend Discovery:
Surface emerging keyword or audience trends far before they’re obvious in traditional reports.
See AI in Action
Let’s break down what AI-driven dashboards can do for marketers:
| AI Feature | What It Delivers | Example in Action |
|---|---|---|
| Automated Anomaly Detection | Spots dips/spikes in KPIs instantly | Flags sudden drop in CTR for a paid search ad |
| Predictive Analytics | Forecasts outcomes based on current trends | Projects next month’s lead volume by channel |
| Smart Budget Pacing | Recommends where to reallocate spend | Suggests moving budget from Display to Social |
| Insight Summaries (SmartEmail) | Delivers digestible, actionable updates | Sends stakeholders a daily summary of key shifts |
Why It Matters: Benefits at a Glance
-
Time Savings:
No more sifting through endless spreadsheets—AI surfaces what matters instantly. -
Actionable Insights:
Automated recommendations help teams move from reactive to proactive optimization. -
Better Collaboration:
Real-time insight summaries keep everyone on the same page—whether it’s your internal team or external clients. -
Higher ROI:
Campaigns are more agile, gaps are closed sooner, and your marketing dollars work harder.
TapClicks: Turning AI Insights into Marketing Wins
Platforms like TapClicks are leading the charge by weaving AI and automation directly into dashboard workflows. With features like TapInsights, SmartEmail, and customizable AI agents, TapClicks helps marketers:
- Monitor all channels from a unified view,
- Receive instant, actionable recommendations,
- And effortlessly share insights across teams and clients.
The bottom line:
AI-infused dashboards let you move from simply reporting results to optimizing them in real time—unlocking the full potential of your marketing data.
How to Choose the Right KPI Dashboard Solution
Selecting a digital marketing KPI dashboard is a pivotal decision that impacts how your team tracks performance, collaborates, and drives ROI. With countless solutions on the market, it’s important to look beyond surface-level features and focus on factors that ensure long-term value and scalability.
Key Factors to Evaluate
- Scalability: Does the platform support your current reporting needs—and will it scale as your campaigns, clients, or locations grow? Look for dashboards proven to handle high volumes of data, dashboards, and users without latency or downtime.
- Integrations: The right solution should offer robust, native integrations (not just basic APIs) to all your marketing, advertising, and analytics platforms. Seamless data connectivity is essential for unified, cross-channel reporting.
- Customization: Can you tailor dashboards, visualizations, and automated reports to match your brand, clients, or unique KPIs? Flexible customization ensures you’re not locked into rigid templates.
- Support & Training: Responsive customer support, onboarding assistance, and ongoing training resources make a big difference in adoption and troubleshooting.
- Security & Compliance: Ensure the platform meets your organization’s security requirements, including data encryption, user roles, and compliance with standards like GDPR or SOC 2.
Mini-Checklist by Use Case
- Agencies: Multi-client support, white labeling, role-based permissions, and bulk reporting tools.
- Brands: Multi-location rollups, budget oversight features, and the ability to blend online/offline data.
- Enterprise Teams: API access, data export options, and compatibility with BI tools (e.g., Tableau, Power BI).
Questions to Ask Vendors
- Which marketing channels and platforms are natively integrated?
- How does the dashboard handle large data volumes and multiple users?
- What options exist for dashboard and report customization?
- Can you automate scheduled, role-specific, or client-facing reports?
- What security features and compliance certifications are in place?
- How does your platform leverage AI for insights or recommendations?
- What does onboarding and ongoing support look like?
Evaluating these areas helps ensure your KPI dashboard won’t just meet your needs today but will also adapt as your marketing operations evolve. For a deeper understanding of what a leading solution offers, explore TapClicks’ marketing dashboard capabilities and see how unified data, automation, and AI insights can transform your reporting workflows.
Conclusion: Unlocking Marketing ROI with Real-Time KPI Dashboards
In today’s hyper-competitive landscape, the difference between marketing teams that simply report numbers and those that drive growth comes down to one thing: actionable, real-time insights. A digital marketing KPI dashboard isn’t just a reporting convenience—it’s a strategic advantage. By centralizing all your key metrics, automating routine reporting, and surfacing timely insights across every channel, these dashboards empower marketers to maximize ROI, adapt quickly, and prove their impact with confidence.
The most successful organizations are those that move beyond manual spreadsheets and fragmented tools. They invest in unified, automated dashboards that deliver not only comprehensive visualization, but also the intelligence to optimize spend, allocate resources efficiently, and align teams around results. With features like cross-channel analytics, interactive visualizations, and AI-powered recommendations, today’s best dashboards turn data into a true engine for marketing growth.
Ready to see how real-time KPI dashboards can transform your approach to marketing performance? Explore the possibilities with TapClicks’ digital marketing dashboard solutions and unlock a new level of clarity, speed, and ROI for your team.
Start Automating Your Marketing Data Today!
No Credit Card Required.

