

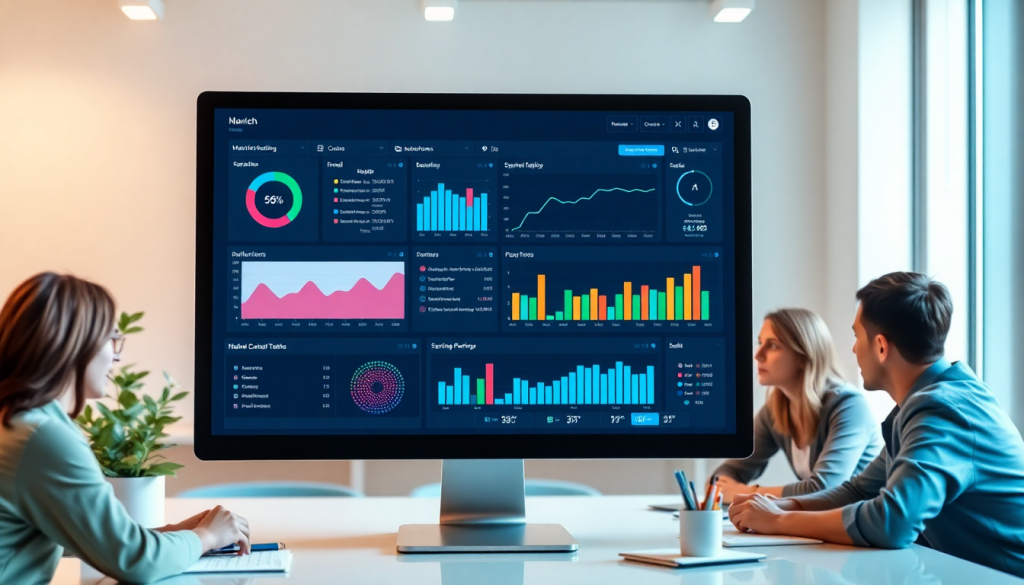
Digital Marketing KPI Dashboard: Visualize Metrics & ROI Fast
Marketing teams rely on clear, actionable data to drive strategy and prove ROI. A digital marketing KPI dashboard brings all your key performance indicators into one interactive space—making it easy to analyze campaigns, report results, and spot opportunities for growth. Whether you need to monitor cross-channel analytics, automate reporting, or give stakeholders real-time performance visibility, the right dashboard is a game-changer for marketing operations. This guide breaks down what to look for, how to set up your dashboard for maximum impact, and how AI-powered tools are raising the bar for marketing analytics.
What is a Digital Marketing KPI Dashboard?
A digital marketing KPI dashboard is a centralized, interactive tool designed to track and visualize your most important marketing metrics—Key Performance Indicators (KPIs)—in real time. Unlike static spreadsheets or basic reports, a KPI dashboard pulls data from multiple sources (such as Google Ads, Facebook, email platforms, and web analytics) and presents it in a unified, visually compelling format. This provides marketers with an at-a-glance view of campaign performance, helping them understand what’s working, what isn’t, and where to optimize.
The core function of a digital marketing KPI dashboard goes beyond simple data collection. It transforms raw numbers into actionable insights by presenting metrics through charts, graphs, and custom widgets that make trends and outliers easy to spot. Unlike traditional reporting—which often involves manual data gathering and long lag times—a true dashboard updates automatically, giving teams immediate access to the latest results and enabling data-driven decision-making on the fly.
Centralizing KPIs in one dashboard streamlines performance tracking across channels and campaigns, making it much easier to correlate efforts, identify cross-channel opportunities, and eliminate blind spots. For agencies juggling multiple clients or brands managing campaigns in different regions, a unified dashboard also standardizes reporting and ensures everyone—from analysts to executives—operates from a single source of truth.
For a deeper dive into how a digital marketing KPI dashboard can transform your strategy and reporting, check out "Digital Marketing KPI Dashboard: Visualize Metrics & ROI Fast".
Key Metrics to Track for Campaign Success
Selecting the right marketing KPIs is fundamental to understanding campaign performance and driving meaningful business results. While every organization’s priorities differ, there are several essential metrics that form the backbone of any effective digital marketing KPI dashboard:
- Impressions: Tracks how often your content or ads are seen. Impressions reveal your campaign’s reach and brand visibility across channels.
- Clicks: Measures user engagement by counting how many times your ads, emails, or links are clicked. This is a key indicator of interest and audience interaction.
- Click-Through Rate (CTR): Calculated by dividing clicks by impressions, CTR helps you gauge the effectiveness of your creative and calls to action.
- Conversions: Represents the number of desired actions taken—such as form fills, purchases, or downloads. This is a direct measure of campaign success.
- Cost Per Acquisition (CPA): Shows how much it costs to acquire a new customer or lead. Keeping CPA low while maintaining quality is a common goal.
- Return on Investment (ROI): Assesses the profitability of your campaigns by comparing revenue generated against spend. ROI is critical for justifying marketing efforts and budget allocation.
The most impactful dashboards don’t just display data—they align KPIs with specific business goals and campaign objectives. For instance, a lead generation campaign may prioritize conversion rate and CPA, while a brand awareness push might focus on reach, impressions, and share of voice. Define what success looks like for your organization, then tailor your dashboard to highlight those metrics.
Real-time KPI monitoring is also essential. Timely insights let you spot performance shifts, optimize budgets, and address issues before they escalate. Modern dashboards—especially those powered by platforms like TapClicks—refresh data automatically, ensuring teams and stakeholders always have access to the latest results.
To explore a comprehensive list of KPIs and best practices for metric tracking, check out "Visualize and Track Metrics".
Why Visualizing Your Marketing Metrics Makes All the Difference
Transforming endless columns of numbers into dynamic visuals turns data from a chore into a strategic advantage. Here’s why marketers and agencies rely on visualization tools—especially within platforms like TapClicks—to unlock better performance and decision-making.
What Makes Visual Dashboards So Powerful?
-
Instant Clarity:
- Spot performance spikes or dips with line graphs
- Compare channels or campaigns side-by-side via bar charts
- Uncover geographic patterns using interactive heat maps
-
Deeper Insights:
- Use cohort analysis charts to track how different segments move through the customer journey
- Leverage scatter plots to reveal relationships, like spend vs. conversions
-
Real-Time Exploration:
- Drill down by campaign, location, or date range with a single click
- Filter and pivot data to answer questions on the fly
- Move beyond static reports—find insights as they happen
How Visualization Drives Team Alignment
-
Collaboration:
- Stakeholders can view live dashboards, ensuring everyone’s on the same page
- Reduce miscommunication—visuals make it easy to share wins and address challenges
- Enable faster, more confident decision-making
-
Transparency:
- Interactive dashboards let every team member (from execs to campaign managers) see outcomes and contribute ideas
- No more digging through spreadsheets—impact is obvious at a glance
Visualization in Action: What Can You Build?
Here's how different chart types can answer your biggest marketing questions:
| Visualization Type | Answers… | Example Use Case |
|---|---|---|
| Line Graph | Are we growing over time? | Monthly leads or conversions trend |
| Bar Chart | Which channel performs best? | Comparing Facebook vs. Google Ads |
| Heat Map | Where are our top-performing locations? | Regional sales or engagement |
| Cohort Analysis | How do customer segments behave? | Onboarding or retention by segment |
| Scatter Plot | Is more spend driving more conversions? | Budget allocation effectiveness |
Ready to Build Better Dashboards?
For practical ideas and step-by-step tips, check out Visualize Metrics & Performance—your guide to making your marketing data work harder, not just look prettier.
Setting Up an Automated KPI Reporting System
Creating an automated KPI reporting system is essential for modern marketing teams that want to maximize efficiency and accuracy. By seamlessly integrating your various data sources and automating the data collection process, you can ensure that your digital marketing KPI dashboard always reflects the most up-to-date campaign performance—without the need for tedious manual updates.
Step 1: Integrate Your Data Sources
Begin by connecting all relevant marketing platforms, such as Google Ads, Facebook, email marketing tools, and CRM systems, to your dashboard solution. Advanced platforms like TapClicks offer thousands of pre-built connectors, making it easy to unify data from multiple channels. This integration allows for a single source of truth and eliminates siloed reporting.
Step 2: Automate Data Pulls and Transformations
Leverage your dashboard’s automated ETL (Extract, Transform, Load) capabilities to schedule regular data imports. This ensures your KPIs are refreshed in real-time or at set intervals, reducing the risk of outdated or incomplete information. Automation also minimizes manual errors, so you can trust the accuracy of your reports.
Step 3: Configure Automated Reporting and Distribution
With your data flowing in automatically, set up scheduled KPI reports tailored to different stakeholders—whether that’s daily performance summaries for your marketing team or comprehensive monthly overviews for executives. Best practices include:
- Customizing report frequency based on recipient needs
- Segmenting dashboards by channel, campaign, or region
- Branding reports with your organization’s look and feel
- Using dynamic dashboards for live, always-on access
Step 4: Continuously Optimize Your Reporting Workflow
Regularly review your reporting processes to identify bottlenecks or opportunities for further automation. TapClicks, for example, offers workflow automation tools that route reports, gather feedback, and even trigger alerts when KPIs hit certain thresholds.
By automating your KPI reporting system, you not only save valuable time—often reclaiming 50+ hours per analyst per month—but also empower your team to focus on strategic analysis instead of repetitive tasks. Explore how TapClicks' automated reporting features can streamline your marketing operations and deliver insights to stakeholders faster than ever.
Cross-Channel Analytics Dashboard: Unifying All Your Data
Modern marketing rarely happens in a vacuum—your audience interacts with your brand across search engines, social platforms, email campaigns, and a multitude of digital channels. That’s why cross-channel analytics is essential for marketers aiming to understand true campaign performance and optimize spend.
A cross-channel analytics dashboard provides a single, unified view of all your marketing data, pulling together metrics from sources like Google Ads, Facebook, LinkedIn, programmatic display, and email marketing tools. This holistic perspective enables you to quickly spot which channels are driving the best results, how your messaging resonates across platforms, and where budget adjustments could maximize ROI.
The real power of a unified dashboard goes beyond aggregation. Advanced platforms like TapClicks automate data normalization and blending, ensuring KPIs from disparate channels are compared apples-to-apples. For example, TapClicks’ Smart Connectors can map and standardize data from over 10,000 sources, allowing marketers to track conversions, cost per acquisition, or engagement side-by-side—regardless of each platform’s native definitions or reporting formats.
With all your search, social, email, and display data harmonized within one dashboard, you can:
- Instantly identify high-performing campaigns and underperforming segments
- Uncover cross-channel synergies—like how a spike in paid search clicks correlates with increased direct traffic or email engagement
- Report on total marketing ROI and channel attribution with confidence
- Save hours each week by eliminating manual data stitching and disparate spreadsheet analysis
TapClicks’ platform is purpose-built for cross-channel analytics at scale, offering drag-and-drop dashboards, automated reporting, and deep data enrichment. To see how unified data visualization can transform your marketing operations, explore TapClicks’ cross-channel analytics capabilities and discover the difference a truly integrated dashboard can make.
Leveraging AI in Your Marketing Dashboard
Artificial intelligence is transforming the way marketers approach data—turning traditional dashboards into proactive, insight-driven engines. Modern AI marketing dashboard capabilities go far beyond static reports, introducing predictive analytics, anomaly detection, and automated insight summaries that empower teams to act faster and smarter.
Predictive Analytics: AI can analyze vast amounts of historical marketing data to forecast future campaign outcomes, budget pacing, and even customer behaviors. For instance, TapClicks’ AI-powered dashboards use predictive models to benchmark performance, highlight underperforming channels, and recommend optimal budget allocations—so you’re not just reporting on what happened, but preparing for what’s next.
Anomaly Detection: Manually spotting sudden dips or spikes in campaign performance can be time-consuming and error-prone. AI-driven dashboards automatically scan your metrics for outliers, alerting you to unusual trends—like a surge in cost per acquisition or a drop in conversions—before they impact your bottom line. This proactive monitoring means you can troubleshoot and optimize campaigns in real time.
Instant Insight Summaries: With features like SmartEmail and AI agents, platforms such as TapClicks now deliver curated insight summaries directly to your inbox or dashboard. These AI-generated reports distill key findings, flag urgent issues, and even suggest data-driven next steps—saving hours of manual analysis and ensuring stakeholders always have actionable information at their fingertips.
By leveraging AI in your marketing KPI dashboard, you move from reactive tracking to strategic optimization. Automated insights, smart recommendations, and predictive intelligence ensure your team focuses less on wrangling data and more on scaling results. For marketers seeking a competitive edge, AI-powered dashboards are no longer a luxury—they’re a necessity.
Customization & Interactive Performance Metrics
A truly effective digital marketing KPI dashboard is more than a static scorecard—it’s a dynamic, customizable workspace tailored to your unique business needs. Customization is key to ensuring every stakeholder, from C-suite executives to campaign analysts, sees the data most relevant to their goals. Solutions like TapClicks empower users with granular control over dashboard design, offering features such as user roles, modular widgets, and robust white-labeling options for seamless branding.
User Roles & Permissions:
Not all users need the same level of access. With configurable user roles, you can control who sees which data, ensuring clients, executives, and team members have access only to pertinent metrics. For agencies and multi-location brands, this means sensitive information stays protected while clients get a focused view of their results.
Widgets & Modular Layouts:
Modern dashboards let you build with drag-and-drop widgets—visual components for KPIs, charts, and interactive tables. This flexibility means you can surface high-level overviews for executives, while analysts can dive deep into granular channel or audience breakdowns. Adding, removing, or resizing widgets lets teams adapt dashboards as campaigns evolve.
White-Labeling & Branding:
For agencies and media companies, the ability to present dashboards under your own brand is critical. White-labeling features allow you to customize colors, logos, and even domain names, delivering a professional, client-centric reporting experience.
Interactive Exploration:
Interactive dashboards take analytics to the next level. Users can click to filter by date range, campaign, or channel, drill down into specific metrics, or compare performance across locations—all in real time. Features like cohort selectors, dynamic heat maps, and drill-through capabilities make it easy to spot trends and uncover actionable insights.
Tailoring for the Audience:
Executives often need high-level summaries that highlight ROI and strategic impact, while analysts require granular, channel-specific data. Customize dashboard views by audience, providing streamlined executive summaries or detailed analytical workspaces as needed.
By leveraging advanced customization and interactive features, you empower your teams and clients to explore marketing data on their own terms—leading to faster insights, stronger collaboration, and more informed decision-making. For a deeper dive into tailored dashboard solutions, explore the capabilities at TapClicks.
Measuring and Communicating ROI to Stakeholders
One of the most powerful advantages of a digital marketing KPI dashboard is its ability to simplify ROI tracking for marketers—transforming complex data into clear, actionable insights that resonate with stakeholders at every level. Instead of sifting through spreadsheets or manually compiling disparate reports, teams can instantly visualize the impact of their campaigns and tie every tactic to measurable business outcomes.
To create compelling digital campaign reporting for clients or leadership, start by leveraging your dashboard’s ability to showcase both high-level and granular ROI metrics in real time. Use visual storytelling elements—such as trend lines, comparison charts, and summary widgets—to highlight how marketing investments are driving conversions and revenue. For example, TapClicks dashboards let you automate the calculation of cost per acquisition, return on ad spend, and customer lifetime value across all channels, making it easy to demonstrate the direct relationship between spend and results.
When presenting to stakeholders, focus on turning data into actionable narratives. Begin with the key business question (“How did our recent campaign impact sales?”), then walk through the most relevant metrics and visualizations that answer it. Contextualize wins by comparing current results to historical benchmarks, and use dynamic filters to spotlight specific channels, regions, or audience segments as needed. This approach not only proves ROI but also uncovers new opportunities for optimization.
Finally, don’t underestimate the importance of automated reporting. By scheduling regular, branded performance reports to be delivered directly to decision-makers—complete with AI-generated insights and recommendations—you ensure that stakeholders stay informed, engaged, and confident in the value your marketing delivers. For more on streamlining ROI communication and reporting, explore TapClicks’ marketing analytics and reporting solutions or see how automation can elevate your campaign presentations.
Conclusion
A well-designed digital marketing KPI dashboard is more than just a reporting tool—it’s the engine for smarter, faster, and more strategic marketing. By centralizing your most important metrics, automating reporting, and leveraging advanced visualization and AI-driven insights, you can unlock greater clarity into campaign performance and ROI. This empowers your team to make data-backed decisions, rapidly identify new opportunities, and clearly communicate results to stakeholders.
As the marketing landscape evolves, the difference between reactive and proactive growth often comes down to how effectively you harness your data. If you’re ready to take your analytics to the next level, now is the time to assess your current approach and consider advanced solutions like TapClicks—purpose-built to unify, automate, and amplify every aspect of marketing operations. With the right dashboard in place, you’ll not only visualize your success—you’ll drive it.
Start Automating Your Marketing Data Today!
No Credit Card Required.

