

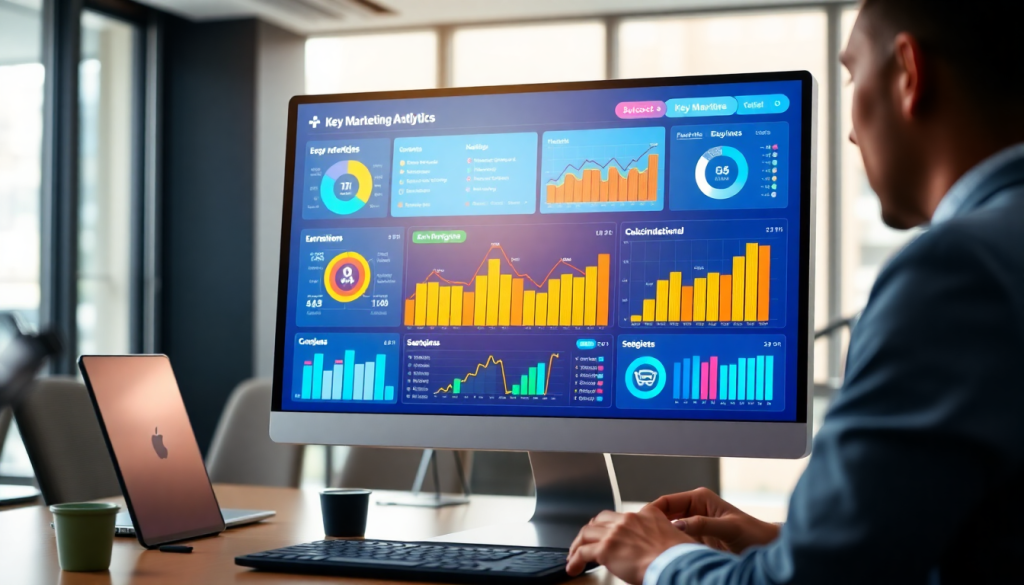
Digital Marketing KPI Dashboard: Visualize Metrics & ROI Fast
A digital marketing KPI dashboard is more than just a collection of charts — it’s the command center for marketers who need real-time visibility, actionable insights, and unified campaign tracking. With the right dashboard, you can centralize data from every channel, automate reporting, and quickly spot what’s working (and what’s not). Whether you’re an agency juggling dozens of clients or an in-house team aiming for sharper ROI, an effective dashboard turns marketing metrics into decisions that drive results.
What Is a Digital Marketing KPI Dashboard?
A digital marketing KPI dashboard is a centralized, interactive tool that visualizes your critical marketing metrics—known as key performance indicators (KPIs)—in real time. Rather than sifting through spreadsheets or toggling between multiple analytics platforms, marketers use these dashboards as a mission control hub to track performance across all digital channels at a glance.
The core function of a digital marketing KPI dashboard is to collect data from disparate marketing sources (think: Google Ads, Facebook, LinkedIn, programmatic platforms, email, and more) and present it in a unified, customizable view. This empowers marketing teams and agencies to monitor campaign effectiveness, budget pacing, ROI, and channel performance in one place—making it easier to spot trends, identify underperforming tactics, and make informed decisions quickly.
Real-time visualization is where dashboards truly shine. Instead of waiting for manual reports, marketers can instantly see how campaigns perform as the data flows in. This up-to-the-minute visibility is vital for agile optimization—adjusting spend, creative, or targeting based on what’s working now, rather than last week. Especially for agencies or brands managing multiple campaigns or clients, dashboards unify cross-channel analytics, reduce reporting silos, and enable smarter, faster collaboration.
To understand how automation and dashboarding can drastically improve efficiency, check out this in-depth guide: "How Marketing Dashboard Automation Boosts Agency Reporting Efficiency". By centralizing and automating KPI tracking, digital marketing dashboards transform raw data into actionable insights—putting performance at your fingertips and helping you drive better results with every campaign.
The Metrics That Matter Most: What to Watch on Your Dashboard
Building an effective digital marketing dashboard starts with picking the right KPIs. The right metrics make it easy to spot trends, diagnose issues, and demonstrate value — all in one place. Here’s how to focus on what truly moves the needle:
Must-Track KPIs for Every Marketer
-
Impressions
- How many times your ads, posts, or content are seen.
- Great for measuring awareness and reach.
- Pro tip: High impressions don’t always mean high engagement, but they’re a vital first step.
-
Clicks
- The number of users who interact with your content or ads.
- Bridges the gap between being seen and being noticed.
-
Click-Through Rate (CTR)
- Formula:
Clicks ÷ Impressions - Shows the effectiveness of your messaging and creative.
- Watch for: A high CTR = resonant content; a low CTR = time to optimize.
- Formula:
-
Conversions
- The end goal: purchases, sign-ups, downloads, or other key actions.
- Tracks how well your marketing is driving real business outcomes.
-
Cost Per Acquisition (CPA)
- Measures how much you spend to earn each conversion.
- Crucial for budget planning and efficiency.
- Insight: Rising CPA? Time to re-evaluate targeting or creative.
-
Return on Investment (ROI)
- Compares revenue generated to marketing spend.
- Answers the ultimate question: Is your marketing profitable?
Digging Deeper: Granular Metrics You Can Track
| Granular Metric | What it Tells You |
|---|---|
| Bounce Rate | Are visitors sticking around or leaving fast? |
| Average Session Duration | How long are users engaging with your content? |
| Ad Frequency | Are your audiences seeing the same ads too often? |
Why Flexibility Matters
A smart dashboard lets you:
- Toggle between high-level KPIs (like conversions or ROI) and channel-specific deep dives.
- Drill down into audiences, creatives, or campaign elements for actionable insights.
- Pivot quickly when you spot trends — or trouble.
Want to see this in action?
Explore how dashboard automation streamlines reporting and boosts efficiency in our post: How Marketing Dashboard Automation Boosts Agency Reporting Efficiency.
With the right KPIs on your dashboard, you’ll always have a clear view of both the big picture and the fine details — empowering you to optimize, report, and win.
Benefits of Automated KPI Reports and Interactive Dashboards
Modern marketing moves fast — and so should your reporting. Automated KPI reports and interactive dashboards are transforming how marketers manage data, make decisions, and prove value to stakeholders.
Save Hours and Eliminate Manual Data Wrangling
Automated KPI reporting eliminates the tedious, error-prone process of gathering, cleaning, and combining data from multiple channels. With the right platform, metrics from Google Ads, Facebook, SEO tools, CRMs, and more flow directly into your dashboard in real time. No more late nights with spreadsheets; marketers can reclaim countless hours each month and focus on strategy, not admin.
Interactive Dashboards: Explore, Drill Down, and Filter Instantly
Unlike static reports, interactive dashboards empower users to explore data on their terms. Want to see how a specific campaign performed in a certain region or drill down from overall ROI to channel-level CPA? With features like filtering, segmentation, and dynamic visualizations, teams can instantly pivot their view — uncovering trends and insights that might otherwise go unnoticed.
Reliable, Timely Data for Better Decisions
Automation dramatically improves data reliability and consistency. With scheduled data refreshes and standardized calculations, teams trust that every metric is accurate and up to date. This means faster, more confident decision-making — from daily budget adjustments to long-term strategy pivots.
For a deeper dive into how dashboard automation can supercharge your analytics and reporting, check out "Boost Analytics Reporting with Dashboard Automation".
In short, automated, interactive dashboards don’t just make reporting easier; they unlock the full potential of your marketing data, enabling smarter performance tracking and faster, more impactful results. To see how platforms like TapClicks make this a reality, explore their comprehensive approach to unified analytics and reporting.
How to Set Up a Cross-Channel Analytics Dashboard
Creating a cross-channel analytics dashboard is the foundation for holistic digital marketing measurement. By unifying paid, owned, and earned channel data, marketers gain the clarity needed to optimize spend, compare performance, and showcase ROI. Here’s how to set up a powerful dashboard that brings all your marketing metrics together:
1. Gather and Integrate Channel Data
Start by identifying all the marketing platforms you use—think Google Ads, Facebook, LinkedIn, email platforms, organic social, SEO tools, and even offline channels. The goal is to pull data from every source that matters for your campaigns. Use robust data connectors (like those in TapClicks) to automate data extraction, ensuring your dashboard always reflects the latest metrics without manual uploads or spreadsheets.
2. Choose the Right Data Connectors
Not all connectors are created equal. Look for connectors that support not just surface-level metrics, but also granular details like campaign, ad group, and creative performance. This flexibility allows you to drill down when you need to diagnose issues or highlight wins. For custom or niche data sources, leverage smart connectors or APIs to bring in additional datasets.
3. Plan Your Dashboard Structure
Before building, map out which metrics matter most for your goals. Separate high-level KPIs (e.g., total conversions, cost per acquisition, ROI) from channel-specific indicators (e.g., CTR for paid search, engagement rate for organic social). Organize your dashboard with intuitive tabs or sections—such as “Overview,” “Paid Media,” “Organic,” and “ROI Analysis”—so users can quickly navigate from a summary to detailed views.
4. Visualize Multi-Channel Performance Effectively
Effective dashboards don’t just display numbers—they make insights obvious. Use charts and visualizations that highlight trends, comparisons, and anomalies across channels. For example, multi-channel line graphs can show how total conversions from paid, owned, and earned efforts trend over time. Pie charts or bar graphs can compare spend or performance share by channel. Incorporate filters and drill-down capabilities so users can explore data by time period, campaign, or audience segment.
5. Automate and Streamline Reporting
Automate data refreshes and schedule regular exports or report emails for your stakeholders. This not only saves time but also ensures everyone is aligned with the most recent results—no more chasing down the latest numbers. For more on creating frictionless reporting processes, see "Streamline Analytics Reporting with Dashboard Automation".
Best Practices to Maximize Your Dashboard’s Impact:
- Keep it actionable: Focus on metrics that drive decisions, not vanity numbers.
- Maintain consistency: Standardize definitions and calculations across channels for apples-to-apples comparisons.
- Iterate regularly: As your campaigns evolve, revisit your dashboard structure and metrics to keep insights relevant.
By following these steps, you’ll build a cross-channel analytics dashboard that empowers marketers to measure, compare, and optimize every campaign from a single source of truth. For more on flexible dashboards and automated reporting, discover the capabilities of TapClicks.
Turning Data into Decisions: How AI Makes Marketing Dashboards Smarter
Modern digital marketing dashboards have evolved far beyond static charts and spreadsheets. With AI-driven features, they don’t just report what’s happening—they help you understand why it’s happening, what’s coming next, and what to do about it.
What Sets AI-Powered Dashboards Apart?
Here’s how AI is transforming the way marketers use data:
-
Predictive Analytics:
- Forecast campaign performance using historical trends and live data.
- Proactively surface at-risk budgets, underperforming channels, or likely customer acquisition costs for the next quarter.
- Example: Instantly know which campaigns might exceed budget before it happens.
-
Automated Anomaly Detection:
- Catch sudden drops in conversions or unexpected spikes in ad spend—without manual monitoring.
- Receive instant alerts when metrics deviate from normal, so you can act immediately.
- Benefit: No more missed opportunities or lingering issues due to delayed reporting.
-
Automated Insights & Recommendations:
- Get concise summaries highlighting the most important trends, optimization suggestions, and budget reallocation ideas.
- Example: TapClicks AI agents scan multi-channel dashboards and automatically email tailored insight reports to your team and clients—no extra manual effort required.
Imagine Your Dashboard Working Like This:
| Feature | How It Helps Your Team | Example in Action |
|---|---|---|
| Predictive Analytics | Anticipate and adjust campaigns in real time | “Your paid search campaign may overspend by 12% next week.” |
| Anomaly Detection | Resolve issues before they escalate | “Conversion rate dropped 15%—investigate landing page.” |
| AI-Generated Insights | Save hours on manual analysis | “Social engagement is up 23%—consider boosting budget.” |
Why This Matters for Marketers
- Less time spent on manual number crunching
- More time for creative strategy and optimization
- Always-on alerts so nothing slips through the cracks
- Actionable recommendations tailored to your actual KPIs
When you bring AI and advanced analytics together in a platform like TapClicks, your dashboard becomes a true command center—not just a data repository. That means faster, smarter decisions and the agility to stay ahead in today’s fast-moving digital landscape.
Why Customization and Scalability Matter for Agencies & Large Teams
For agencies and enterprise marketing teams, every client has unique needs—and “one-size-fits-all” dashboards just don’t cut it. The best digital marketing KPI dashboards are built for flexibility, so you can deliver a tailored, branded experience at any scale.
Ways to Make Your Dashboards Truly Yours
-
White-Labeling:
- Add your agency’s logo, colors, and messaging
- Reinforce your brand at every client touchpoint
- Elevate your agency’s value as a strategic, data-driven partner
-
Role-Based Access Control:
- Set granular user permissions
- Ensure that each stakeholder (client, account manager, exec) only sees the data that’s relevant to them
- Maintain data privacy across hundreds of clients or campaigns
- Create custom reporting templates for different audiences
Scaling Without Sacrifice
As your client roster grows, so does the complexity. You need tools that scale seamlessly—without slowing down your workflow or compromising reliability.
Here’s what to look for:
| Scalability Feature | Why It Matters |
|---|---|
| Bulk dashboard creation | Launch dashboards for new clients or campaigns in minutes, not hours |
| Streamlined onboarding workflows | Get new clients up and running quickly |
| Centralized management interfaces | Oversee thousands of dashboards, campaigns, or users from a single admin hub |
| High-performance infrastructure | Maintain speed and reliability as the volume of data and users grows |
Automate and Integrate for Maximum Efficiency
-
Automated Report Scheduling:
- Schedule recurring, branded reports for each client
- Save analysts from repetitive manual tasks
- Ensure stakeholders always have the latest insights
-
Workflow Integrations:
- Tie dashboards into broader platforms like TapClicks
- Connect campaign management, analytics, and client communication in one place
- Create a seamless journey—from data to decision
The Bottom Line
Customizable, scalable KPI dashboards empower agencies and large teams to:
- Deliver consistent, high-quality reporting at scale
- Adapt quickly to each client’s unique needs
- Streamline operations and maximize efficiency
When you have the right platform, you’re not just keeping up—you’re setting the pace.
Turning Dashboard Insights Into Action
A powerful digital marketing KPI dashboard isn’t just about visualizing numbers—it’s about driving continuous improvement. To truly capitalize on your dashboard’s value, you need to transform insights into concrete actions that move the needle on campaign performance.
Interpreting Data and Prioritizing Optimizations
Start by regularly reviewing your dashboard’s key metrics—such as click-through rates, conversion rates, and ROI—alongside advanced analytics like attribution paths or channel-specific performance. Use these insights to pinpoint which campaigns, channels, or creative assets are underperforming or exceeding expectations. For example, a sudden dip in conversion rate paired with increased ad spend might indicate a need for creative refresh or landing page optimization. Prioritize your optimizations based on both impact and effort: focus first on the high-value changes that can deliver the greatest ROI.
Leveraging Dashboard Alerts and Automated Recommendations
Modern platforms like TapClicks offer intelligent features such as automated alerts and AI-driven recommendations. Set up threshold-based alerts to notify you instantly if spend spikes or engagement drops, enabling rapid response before issues escalate. Use automated recommendations—like budget reallocations, keyword tweaks, or creative adjustments—to take the guesswork out of optimization. These tools help you stay proactive, catching anomalies and surfacing opportunities you might otherwise miss.
Establishing Routines for Ongoing KPI Monitoring
To turn insights into sustained results, make dashboard review and action a habit. Schedule weekly or bi-weekly check-ins to assess performance trends, review automated reports, and track progress on your optimization tasks. Encourage your team to annotate changes and hypotheses directly within the dashboard or reporting suite, creating a feedback loop that links actions to outcomes. Over time, this disciplined approach builds a culture of data-driven marketing where continual improvement is the norm.
By making your dashboard a living part of your marketing workflow—not just a static reporting tool—you ensure that valuable insights lead to smarter decisions, quicker pivots, and stronger campaign outcomes.
What to Look for in a Digital Marketing KPI Dashboard Platform
Finding the right KPI dashboard can make the difference between simply collecting data and actually driving better marketing results. Here’s a friendly guide to help you focus on what really matters when choosing your platform.
Key Features That Make a Difference
Seamless Data Integration
No more juggling spreadsheets or manual uploads. The ideal platform should:
- Connect to all your marketing and ad sources (Google Ads, Facebook, CRMs, analytics tools, etc.)
- Offer 1000+ pre-built connectors or easy custom integrations
- Automate ETL/ELT processes so data flows in effortlessly
Automation, Everywhere
Let your team focus on strategy, not busywork. Look for:
- Automated data pulls and dashboard refreshes
- Scheduled and recurring report delivery (internal and client-facing)
- Automated insight generation—so you’re not just getting numbers, but answers
Customization and Flexibility
Every brand and agency is different. Make sure your dashboard:
- Allows drag-and-drop customization
- Supports white-label branding for your clients and execs
- Offers role-based access so everyone sees what matters to them
AI-Powered Intelligence
Modern dashboards should do more than display trends—they should spot them. Top platforms:
- Surface key insights and trends automatically
- Flag budget pacing issues and optimization opportunities
- Deliver recommendations you can act on, not just data you have to interpret
Scalability that Grows with You
Whether you have 10 campaigns or 10,000, your platform should:
- Handle massive data volumes with ease
- Support multi-client, multi-location reporting
- Integrate with workflow and order management tools for true operational scale
Platform Evaluation Cheat Sheet
Here’s a quick checklist to keep handy as you evaluate options:
| Must-Have Capability | Present? |
|---|---|
| Connects to all marketing/ad data sources | ☐ |
| Automates data integration and report delivery | ☐ |
| Customizable, white-labeled dashboards | ☐ |
| Built-in AI insights and recommendations | ☐ |
| Role-based/client-specific access | ☐ |
| Scales for multi-client/multi-location needs | ☐ |
| Integrates with workflow/order management | ☐ |
Why TapClicks Is a Standout Choice
TapClicks brings all these essentials—and more—into one unified platform:
- Massive library of data connectors
- Automated ETL, reporting, and insight delivery
- Flexible, white-labeled, role-based dashboards
- Powerful AI analysis and recommendations
- Enterprise-grade scalability for agencies and brands
Ready to turn raw data into real marketing impact? Learn more about TapClicks and see how your team can work smarter, not harder.
Start Automating Your Marketing Data Today!
No Credit Card Required.

