

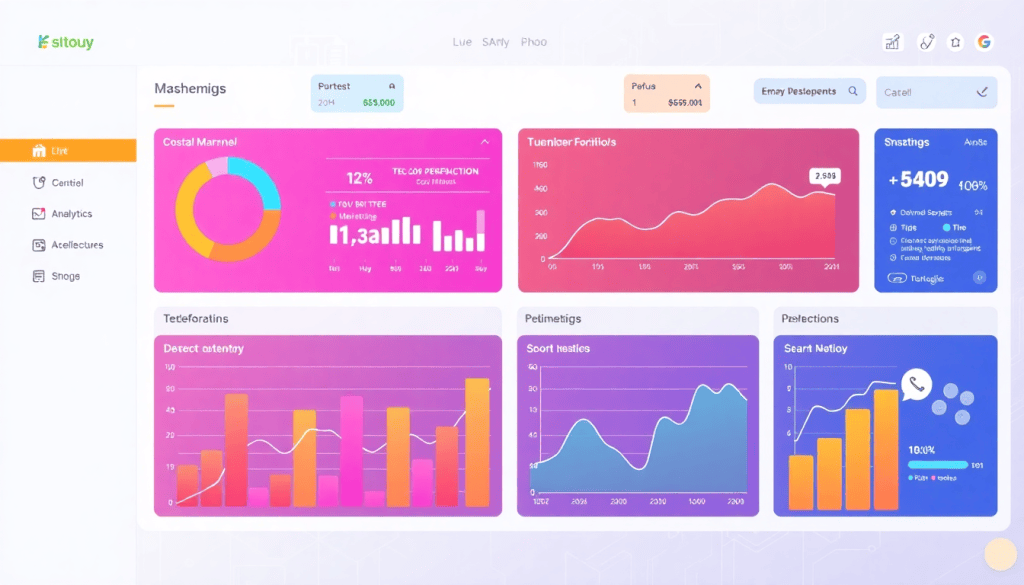
Digital Marketing KPI Dashboard: Visualize Metrics & ROI Fast
Marketing teams are expected to deliver results, prove ROI, and react quickly to trends across multiple channels. A digital marketing KPI dashboard gives you a clear, real-time view of your most important marketing metrics—streamlining campaign reporting, surfacing actionable insights, and saving hours of manual data wrangling. With the right dashboard setup, you can monitor goals, share progress with stakeholders, and make smarter decisions faster.
What is a Digital Marketing KPI Dashboard?
A digital marketing KPI dashboard is a centralized, visual platform designed to track and display your most critical marketing metrics in real time. By aggregating key performance indicators (KPIs) from multiple channels—such as website analytics, paid advertising, social media, and email campaigns—these dashboards provide a unified view of marketing performance, allowing teams to quickly assess what’s working, identify areas for improvement, and demonstrate ROI to stakeholders.
The primary purpose of a digital marketing KPI dashboard is to streamline the often complex process of campaign reporting. Instead of juggling spreadsheets or logging into multiple analytics tools, marketers can view all essential metrics in one place. This empowers teams to make data-driven decisions faster and with greater confidence.
Who benefits most from these dashboards?
- Agencies and media companies rely on dashboards to manage reporting for numerous clients, keeping campaign performance transparent and client communications efficient.
- In-house marketing teams use dashboards to monitor goals, track budgets, and share progress with leadership—all without manual data wrangling.
- Multi-location or enterprise brands leverage dashboards to consolidate performance data from across regions, products, or business units, ensuring consistency and visibility at scale.
As marketing channels and data sources proliferate, so does the need for centralized metric visualization. Teams are increasingly turning to automated dashboards to save time, reduce errors, and unlock cross-channel insights that would otherwise be buried in siloed reports. To learn more about how automation is transforming dashboard reporting, check out "What is Marketing Dashboard Automation?".
By providing a single source of truth and surfacing actionable insights, digital marketing KPI dashboards are now essential tools for modern marketing operations. For organizations seeking a scalable, automated approach, platforms like TapClicks make it easy to unify, visualize, and act on your data—no matter how complex your marketing ecosystem.
Essential KPIs to Track for Digital Campaign Reporting
Choosing the right KPIs is fundamental to building a digital marketing KPI dashboard that delivers actionable insights and drives business results. The most effective dashboards focus on metrics that directly reflect your marketing goals and ROI, while also enabling granular analysis across channels and campaigns.
Core Marketing KPIs:
Every robust digital marketing dashboard should track foundational metrics such as:
- Website Traffic: Total visits, unique visitors, pageviews, and session duration help gauge the reach and engagement of your campaigns.
- Conversions: Track completed actions (purchases, sign-ups, downloads) to understand which channels and campaigns drive results.
- Cost Metrics: Monitor ad spend, cost per click (CPC), cost per lead (CPL), and cost per acquisition (CPA) to assess efficiency.
- Return on Investment (ROI): Calculate ROI or ROAS (Return on Ad Spend) to connect marketing spend with revenue.
- Click-Through Rate (CTR): Measure ad and email performance to optimize creative and messaging.
- Engagement Metrics: Includes likes, shares, comments, and video views for social and content campaigns.
Channel-Specific vs. Cross-Channel KPIs:
While each channel—such as Google Ads, Meta, email, or SEO—offers unique metrics, a best-in-class dashboard consolidates these into a unified view. For instance, you may want to compare paid search conversions against organic search or social media performance to identify the most effective tactics. Cross-channel metrics like total conversions, blended CPA, and multi-touch attribution provide deeper insights into overall marketing performance.
Aligning KPIs With Objectives:
It’s essential to select KPIs that tie directly to your business and campaign objectives. For example, lead generation campaigns may prioritize CPL and lead quality, while e-commerce brands will focus on sales, average order value, and customer lifetime value (CLV). Defining clear goals ensures your dashboard surfaces the metrics that matter most—so you can quickly spot trends, diagnose issues, and optimize spend.
The Power of Interactive Performance Metrics:
Static reports only go so far. Interactive dashboards empower users to filter data, drill down into specific campaigns or timeframes, and visualize performance trends over time. This dynamic approach makes it easier for marketers, agencies, and brands to uncover actionable insights, customize views for stakeholders, and drive continuous improvement.
For a deeper dive into how automated dashboards can streamline KPI tracking and reporting, explore "What is Marketing Dashboard Automation?".
What Makes a Performance Dashboard Truly Powerful?
A best-in-class digital marketing KPI dashboard is much more than a collection of charts—it’s a command center for marketers. It empowers teams to act quickly, collaborate seamlessly, and deliver measurable results. Here’s what sets top-tier dashboards apart:
Instantly Up-to-Date: Real-Time Data Access
- Live Campaign Monitoring: Data is automatically pulled from sources like Google Ads, Meta, CRM platforms, and more.
- Unified View: No more fragmented spreadsheets—see all your performance metrics in one place.
- Immediate Action: Spot trends, address issues, and seize opportunities as they happen, not at the end of the week.
Reporting That Runs Itself: Automated, Customizable KPI Reporting
- Set It and Forget It: Schedule updates and automate report delivery.
- Tailored for Every Stakeholder:
- Segment by client, region, or campaign.
- Customize widgets to match your key metrics.
- Time-Saving: Eliminate manual reporting and reduce errors.
Smarter Decisions, Faster: AI-Driven Insights & Recommendations
- AI Highlights What Matters:
- Automated anomaly detection.
- Predictive analytics for future outcomes.
- Smart recommendations for optimization.
- Clarity, Not Clutter: Skip the data overload—get practical, context-rich guidance for better ROI.
Effortless to Use: Intuitive, Interactive Design
- Drag-and-Drop Dashboards: Build, edit, and rearrange with ease.
- Interactive Filters: Drill down on any metric instantly.
- Visual Cues: Color-coded indicators spotlight urgent KPIs.
- Role-Based Views: Campaign managers see details; executives see the big picture.
Built for Teams: Collaboration & Secure Access
- Role-Based Access: Protect sensitive data while enabling transparency.
- Collaboration Tools:
- Comment threads.
- Approval workflows.
- Sharing controls for clients and team members.
- Aligned Goals: Keep everyone on the same page, from sales to fulfillment.
Beyond Static Reports: Why Interactivity Matters
| Static Reports | Interactive Dashboards |
|---|---|
| Fixed, inflexible PDFs | Drill down and explore live data |
| Manual updates required | Always up-to-date |
| Limited answers for stakeholders | Instant answers to ad hoc queries |
| Hard to share and collaborate | Easy sharing and team comments |
Curious how automation can transform your reporting?
Check out these Automated Reporting Benefits.
With these capabilities, your dashboard isn’t just a reporting tool—it’s a strategic asset. It accelerates workflows, boosts team collaboration, and delivers the real-time insights that drive marketing performance at scale.
Want to see it in action?
Explore how TapClicks brings these features together: TapClicks.com
How to Set Up Automated KPI Reports That Save Time
Building an automated reporting workflow is the key to turning your digital marketing KPI dashboard from a static snapshot into a living, breathing resource for your team. Here’s how you can set up automated KPI reports that save time, reduce errors, and keep everyone on the same page:
1. Connect and Unify Data from Multiple Sources
Start by determining which marketing platforms you need to include—think Google Ads, Meta, LinkedIn, programmatic display, CRM systems, and more. Modern marketing operations platforms like TapClicks let you connect thousands of data sources using built-in connectors or custom integrations. Once connected, the platform automatically extracts, transforms, and loads your campaign data into a single, unified dashboard. This eliminates manual data pulls and ensures your reports are always up-to-date.
2. Design Your Dashboard and Select KPIs
Next, map out your dashboard layout and choose the KPIs that matter most—such as impressions, clicks, conversions, cost per lead (CPL), return on ad spend (ROAS), and more. Use customizable widgets to visualize each KPI, and segment data by channel, campaign, region, or client to fit your reporting needs. Interactive dashboards allow you to drill down for deeper analysis, while filters make it easy to tailor the view for different stakeholders.
3. Automate Scheduling and Delivery
With your dashboard in place, set up automated reporting schedules. Most advanced platforms let you trigger daily, weekly, or monthly reports that are sent directly to team members, executives, or clients. You can segment reports by audience—sharing high-level summaries with leadership, and detailed performance reports with your marketing team. Automated workflows also allow for customized branding and format options, ensuring professionalism and consistency with every report.
4. Customize and Annotate Reports for Clarity
Add narrative summaries, annotations, or automated insight sections to your reports. AI-powered tools can flag anomalies, surface optimization recommendations, and even pre-write key takeaways—saving your analysts hours each month and ensuring stakeholders understand not just the numbers, but what they mean. This level of customization highlights wins, explains variances, and drives better decision-making.
5. Monitor, Refine, and Scale
Once your automated KPI reporting workflow is live, monitor for accuracy and relevance. As your campaigns evolve, regularly review which data sources and KPIs are most impactful—and update your dashboards accordingly. Automation makes it easy to scale your reporting across new campaigns, clients, or regions, minimizing manual work and reducing the risk of errors from spreadsheet-based processes.
By following these steps, you’ll streamline campaign reporting, reclaim valuable analyst hours, and empower your team to move from reactive data crunching to proactive marketing optimization. For more on the real-world benefits of automated dashboards, check out "Automated Reporting Benefits".
Cross-Channel Analytics Dashboard: Unifying All Your Marketing Data
In today’s fragmented marketing landscape, cross-channel analytics is no longer a “nice-to-have”—it’s essential for maximizing ROI and understanding true campaign performance. Cross-channel analytics means pulling together data from every touchpoint—paid search, social, display, email, organic, and even offline channels—so you can see not just isolated results, but the full story of how your marketing efforts work together.
A cross-channel analytics dashboard simplifies this complexity by blending data from multiple sources into a unified view. Imagine tracking your Google Ads spend, Facebook conversions, website engagement, and PR mentions—all in one dashboard. This holistic approach enables marketers to compare channel effectiveness side by side, identify which combinations drive the best results, and allocate budget with confidence.
Blending paid, owned, and earned data isn’t just about convenience—it’s about accuracy. When you unify metrics across platforms, you eliminate data silos and ensure you’re measuring what matters: the real impact of your marketing mix. For example, you might discover that email campaigns amplify the effect of paid social ads, or that organic search lifts brand awareness generated by influencer partnerships. With all your KPIs in one place, you gain actionable insights into the customer journey, pinpointing bottlenecks and opportunities for optimization.
This level of visibility transforms ROI tracking. Instead of juggling spreadsheets and logging into multiple platforms, your team can instantly access up-to-date performance metrics, spot trends, and make data-driven decisions faster. As highlighted in "Unlock Analytics & Reporting", a well-built cross-channel dashboard helps marketers “move from reactive reporting to proactive strategy”—empowering teams to optimize campaigns on the fly.
Whether you’re managing marketing for a single brand or reporting to hundreds of clients, a cross-channel analytics dashboard is the key to unlocking a truly holistic view of your marketing ecosystem. To see how unified analytics can elevate your organization, explore more about TapClicks’ cross-channel solutions.
Unlocking Deeper Insights with AI Marketing Dashboards
The pace of digital marketing is relentless—trends shift in hours, not days, and missing a key anomaly can mean lost revenue or wasted spend. That’s why AI-powered marketing dashboards are now essential, turning raw data into real-time, actionable intelligence for agencies and brands alike.
What Today’s AI Dashboards Really Do
Forget static charts and after-the-fact reporting. Modern AI dashboards—like those in TapClicks—supercharge your marketing analytics by:
-
Automated Anomaly Detection:
- Instantly flagging unexpected spikes or drops in KPIs
- Surfacing issues such as sudden increases in CPL, decreases in conversions, or outlier channel performance
- Sending proactive alerts so you can act before minor issues escalate
-
Predictive Analytics:
- Forecasting campaign results based on historical and real-time data
- Enabling proactive budget shifts and channel adjustments
- Highlighting where your efforts are likely to have the most impact
-
Smart Recommendations:
- Using machine learning to suggest tactical optimizations
- Recommending spend reallocations, creative tweaks, or audience targeting changes
- Benchmarking your campaigns against industry standards
Before and After: Manual Analysis vs. AI Dashboards
| Manual Analysis | AI-Powered Dashboards | |
|---|---|---|
| Speed | Hours or days | Real-time, continuous |
| Accuracy | Prone to human error | Automated, consistent |
| Insights | Pattern-spotting is manual | Trends & anomalies surfaced automatically |
| Strategic Value | Report generation focus | Enables proactive optimization & growth |
How AI Dashboards Change the Game
-
From Reactive to Proactive:
Instead of scrambling to explain last month's drop in leads, AI dashboards let you fix issues as they happen. -
From Data Wrangling to Strategy:
No more endless spreadsheet slicing—AI highlights what matters, so your team can focus on campaign innovation. -
From Guesswork to Benchmarked Confidence:
Always know how your KPIs stack up against goals and industry norms, not just last month’s numbers.
See AI in Action: TapClicks Example
With TapClicks’ AI Agents, you can:
- Get instant notification of anomalies (e.g., a sudden CPC spike)
- Receive AI-curated recommendations for spend reallocation
- Benchmark campaigns and channels with predictive analytics
Ready to move beyond reporting and into real-time marketing intelligence?
Explore TapClicks’ AI-powered dashboards and start transforming your marketing insights today.
Best Practices for Campaign KPI Monitoring and Visualization
Designing an effective digital marketing KPI dashboard goes beyond simply displaying numbers—it’s about building an intuitive, actionable workspace that empowers every stakeholder to understand performance at a glance and dive deeper when needed. Here’s how you can maximize the clarity, impact, and utility of your dashboards:
1. Prioritize Clarity and Simplicity in Dashboard Design
A well-designed dashboard should instantly answer your most critical questions. Focus on clean layouts with logical groupings: place high-level KPIs (like total conversions, spend, or ROI) at the top, followed by supporting metrics and channel-specific details below. Use contrasting colors and bold type to highlight trends, anomalies, or underperforming areas, while avoiding visual clutter. Customizable widgets let you tailor views for different campaigns, regions, or products, ensuring everyone sees the most relevant data.
2. Tailor KPI Presentations for Different Stakeholders
Not everyone needs the same level of detail. Executives want concise, big-picture overviews—think scorecards, trend lines, and ROI summaries—while marketing specialists and analysts benefit from granular breakdowns, channel comparisons, and cost analysis. Leverage role-based access and dashboard customization so each user gets the context and transparency they need without information overload.
3. Enable Interactive Metrics and Drill-Down Capabilities
Static reports can’t match the value of interactive dashboards. Make it easy for users to click into KPIs and explore underlying data—such as breaking down conversions by channel, geography, or creative asset. Visualization tools like filters, comparison toggles, and time-series charts empower users to uncover insights and answer follow-up questions on the fly, reducing back-and-forth requests to analysts.
4. Support Continuous Campaign Optimization with Real-Time Data
Dashboards shouldn’t just be rear-view mirrors. With automated, real-time performance tracking, teams can monitor campaign health daily and respond to shifts in audience behavior, budget pacing, or channel performance immediately. Set up alerts for anomalies or goal deviations, and use AI-generated recommendations to proactively optimize campaigns before issues escalate.
5. Foster a Culture of Data-Driven Improvement
Encourage regular dashboard reviews as part of campaign stand-ups or executive reporting cycles. Use dashboards as a collaborative hub to identify what’s working, spot opportunities for quick wins, and align teams on next steps. Over time, analyzing historical dashboard data helps refine benchmarks, set smarter goals, and demonstrate marketing’s impact with confidence.
For more in-depth guidance on optimizing your reporting workflow and unlocking the full potential of your analytics, check out Automated Reporting Benefits. Or, to explore how TapClicks can streamline your KPI monitoring and visualization at scale, visit TapClicks.
Conclusion
A digital marketing KPI dashboard is no longer a “nice-to-have”—it’s a mission-critical tool for any team aiming to deliver results and stay competitive in today’s fast-paced environment. By centralizing your most important metrics, automating reporting, and leveraging advanced features like AI-driven insights, you can transform how you track performance and prove ROI to stakeholders.
The key is to start by identifying your core KPIs—those metrics that align most closely with your business and campaign objectives. From there, explore dashboard solutions that unify your data, streamline workflows, and provide the real-time visibility you need to make smarter, faster decisions.
Ready to see the difference an intelligent dashboard can make? Consider requesting a personalized demo, experimenting with a dashboard template, or auditing your current reporting workflows to uncover new opportunities for efficiency and impact. To learn more about how TapClicks empowers marketers to visualize, analyze, and optimize their campaigns at scale, visit TapClicks and take the first step toward next-level marketing performance.
Start Automating Your Marketing Data Today!
No Credit Card Required.

