

Digital Marketing KPI Dashboard: Visualize Metrics & ROI Fast
A digital marketing KPI dashboard brings your most important marketing metrics into clear focus—so you can track, analyze, and act on campaign performance in real time. With the right dashboard, you’ll move beyond spreadsheets and scattered reports, consolidating all your channels, KPIs, and ROI indicators into a single, interactive view. This guide explores how to streamline performance tracking, automate reporting, and leverage AI-powered insights to drive smarter marketing decisions.
What is a Digital Marketing KPI Dashboard?
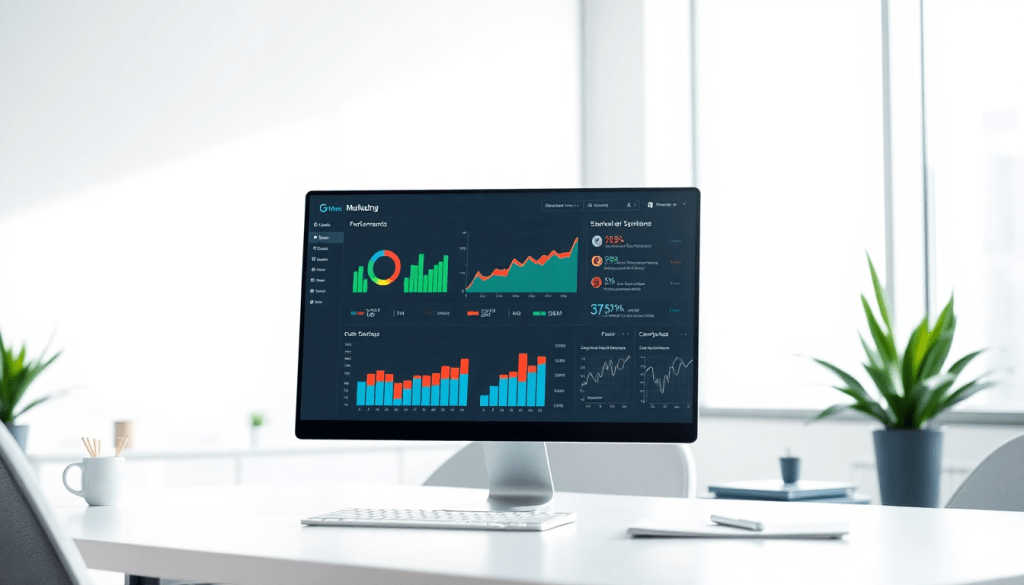
A digital marketing KPI dashboard is a centralized, interactive tool designed to monitor, visualize, and report on your most important marketing metrics in real time. Instead of toggling between multiple spreadsheets, ad platforms, and analytics tools, marketers use a KPI dashboard to bring all campaign performance data—across channels, clients, or regions—into a single, unified view. This enables faster, more confident decision-making and empowers teams to react to trends and anomalies as they happen.
At its core, a digital marketing KPI dashboard connects directly to the sources of your marketing data—from paid search and social media to programmatic, email, and beyond. The best dashboards offer real-time data integration, meaning your metrics update automatically as new data comes in, eliminating manual data pulls and reducing reporting lag. They include interactive visualizations—customizable charts, graphs, and scorecards—that make it easy to spot trends, outliers, and ROI at a glance. Automated reporting features further streamline workflow, enabling teams to deliver scheduled reports and on-demand insights to stakeholders without repetitive manual effort.
By centralizing your campaign KPIs—impressions, clicks, conversions, CPA, ROAS, and more—a dashboard not only streamlines performance tracking but also ensures everyone on your team is working from a single source of truth. This kind of tool is especially valuable for agencies and multi-location brands managing data at scale, as it brings together disparate sources and surfaces the metrics that matter most for your business goals.
For a deeper dive into how dashboard automation can boost efficiency and reporting for agencies, check out TapClicks’ guide on dashboard automation and agency efficiency.
Essential Marketing Metrics: What Every Dashboard Needs
A digital marketing dashboard is only as valuable as the metrics it tracks. To get actionable insights—and not just vanity numbers—your dashboard should spotlight the KPIs that truly measure impact. Here’s how to ensure you’re monitoring what matters:
Must-Track Marketing KPIs
| Metric | What It Measures | Why It Matters |
|---|---|---|
| Impressions | Number of times your ads/content are displayed | Gauges overall reach and brand visibility |
| Clicks & Click-Through Rate (CTR) | Total clicks and clicks per impression | Indicates creative/message effectiveness; signals optimization needs |
| Conversions & Conversion Rate | Completed actions (purchases, sign-ups, downloads) | Directly connects activity to ROI; reveals what’s working |
| Cost Per Acquisition (CPA) / Lead (CPL) | Spend required to acquire a customer or lead | Optimizes budget allocation and campaign efficiency |
| Return on Ad Spend (ROAS) | Revenue generated per ad dollar spent | The ultimate measure of marketing ROI |
| Engagement Metrics | Likes, shares, comments, time on page, etc. | Shows audience interest and interaction |
| Channel-Specific Metrics | Email open rates, video completions, share of voice, etc. | Provides a tailored view of each platform’s performance |
Cross-Channel Analytics: The Big Picture
Tracking individual metrics is useful—but integrating them across all your platforms is where the real magic happens. With unified cross-channel analytics, you can:
- Spot trends that would be invisible in siloed data.
- Attribute conversions more accurately across the customer journey.
- Optimize spend based on holistic performance, not assumptions.
Pro Tip: TapClicks brings all your channel data together, so you can analyze, compare, and act—all from one dashboard.
Tailoring Dashboards for Every Stakeholder
Not everyone needs the same data depth. Here’s how to customize your dashboard views for maximum impact:
-
Executives:
- High-level ROI
- Budget pacing
- Channel performance summaries
-
Marketing Analysts:
- Granular engagement and audience data
- Attribution breakdowns
- A/B test results
-
Clients:
- Branded, simplified dashboards
- Key wins and headline results
- Clear visuals, minimal jargon
With TapClicks, you can easily filter, customize, and brand reports for every audience—ensuring everyone gets the insights they need (and nothing they don’t).
Make Every Campaign Count
By focusing on these high-impact KPIs, your marketing team can:
- Make faster, smarter decisions
- Prove campaign value to stakeholders
- Continuously optimize for better results
Ready to bring all your metrics into one powerful view? Learn more about TapClicks dashboards.
Benefits of Automated KPI Reporting
Automated KPI reporting is a game-changer for marketing teams aiming to scale their impact while minimizing repetitive work. Instead of spending hours manually pulling data, building spreadsheets, and formatting presentations, marketers can let automation handle these tasks—freeing up time for strategy and analysis.
Save Time and Reduce Errors:
Manual reporting is not only tedious; it’s also prone to mistakes. With an automated KPI reporting solution, data from every connected source flows directly into your dashboard at scheduled intervals. This means you get the most up-to-date metrics without the risk of copy-paste errors, version control issues, or misaligned timeframes. Teams using automation often save dozens of hours per month, allowing analysts and account managers to focus on campaign optimization rather than data wrangling.
Scheduled Delivery and On-Demand Insights:
Automated reporting platforms like TapClicks make it easy to set up scheduled report deliveries—whether it’s a weekly summary for your clients or a daily performance digest for your marketing team. Stakeholders get the information they need, exactly when they need it, without having to log in and hunt for updates. And when you want deeper insights, on-demand access to interactive dashboards means you’re never more than a click away from the latest numbers.
Consistency and Professionalism:
Automated reports ensure that formatting, branding, and data presentation are consistent across every delivery. This professionalism not only builds trust with clients and internal teams but also reduces the time spent on review cycles and manual adjustments.
TapClicks’ Approach to Automation:
TapClicks takes automated dashboard reporting a step further by offering advanced scheduling, customizable templates, and role-based access—so the right people see the right metrics, every time. Their platform also supports automated dashboard reporting, letting marketers streamline the entire process from data integration to report distribution.
In short, automated KPI reporting empowers marketers to move faster, make smarter decisions, and deliver consistent value—without the headaches of manual workflows. For more on how TapClicks can transform your reporting process, visit TapClicks.
Visualizing Marketing Metrics for Better Decision-Making
Turning data into action starts with how you present it. Effective marketing dashboards don’t just look good—they help your team (and clients) spot what matters and act faster.
How to Turn Metrics Into Meaning
-
Use the Right Visuals for the Right Story:
- Bar/Line Charts: Show how impressions, clicks, or conversions change over time.
- Scorecards: Instantly highlight KPIs like CPA (cost per acquisition) or ROAS (return on ad spend).
- Custom Widgets (Funnels, Heatmaps): Reveal user journeys or campaign hot spots at a glance.
-
Prioritize Clarity and Action:
- Keep dashboards focused—avoid clutter.
- Use bold visuals for key numbers and subtle color cues to flag anomalies.
Why Interactivity Matters
Great dashboards do more than display numbers—they invite exploration:
- Filter & Drill Down: Quickly slice data by channel, region, or campaign.
- Compare Side-by-Side: Spot which tactics or markets deliver the best ROI.
- Detect Issues Instantly: Notice a spike in ad spend or dip in conversions without digging through spreadsheets.
Real-World Example: Data Storytelling That Clicks
Imagine an agency presenting campaign performance to multiple clients:
| KPI | Value | Visualization Type |
|---|---|---|
| Total Leads | 1,200 | Scorecard |
| Cost per Lead | $22 | Scorecard |
| Top Ad Performance | 3.1% CTR | Bar Chart |
| Geography Split | US: 800, CA: 400 | Map/Filter Widget |
- Scenario:
A marketing manager walks clients through a dashboard:- Starts with a summary page: bold scorecards for leads and CPL.
- Clicks to filter by geography or device.
- Highlights a funnel diagram showing where users drop off.
- Outcome:
The client sees what’s working and where to optimize—no spreadsheet headaches, just clear stories and next steps.
How TapClicks Makes This Easy
Platforms like TapClicks take visualization to the next level:
- Drag-and-drop dashboard builder: No coding needed.
- Customizable scorecards & widgets: Show what matters to each stakeholder.
- Interactive data views: Instantly filter, segment, and analyze—all in one place.
Bottom line:
When you transform raw marketing data into dynamic, interactive visuals, everyone—from analysts to clients—can understand performance at a glance and make smarter, quicker decisions.
Cross-Channel Analytics: Unifying Your Campaign Data
Modern marketing rarely happens in silos—your audience is spread across search engines, social platforms, email, programmatic ads, and countless other touchpoints. To truly understand what’s working, marketers need a unified view that brings all these channels together. This is where cross-channel analytics dashboards shine.
By integrating data from every source—Google Ads, Facebook, LinkedIn, email marketing, programmatic platforms, and more—cross-channel dashboards provide a holistic snapshot of your campaigns. Instead of piecing together separate reports or logging into multiple platforms, you get one centralized hub for all your key performance indicators (KPIs), ensuring that nothing slips through the cracks.
This unified approach eliminates data silos, which are a common barrier to effective analysis and optimization. When reporting is fragmented, it’s easy to miss attribution paths, duplicate spend, or overlook underperforming tactics. With a cross-channel analytics dashboard, you can quickly spot trends, identify which channels are driving the most value, and compare performance side by side. For example, you might discover that while paid social is generating the most impressions, your highest-converting leads are coming from search—insights that help you rebalance budgets for maximum impact.
Scenario-based reporting is another advantage. Imagine an agency managing campaigns for a multi-location brand: unified dashboards allow them to group and compare data by region, product line, or audience segment. This makes it possible to allocate spend more strategically, optimize creative assets per channel, and react quickly to shifts in performance.
Platforms like TapClicks make cross-channel analytics seamless, connecting to thousands of marketing and advertising data sources. With automated ETL pipelines and enrichment tools, TapClicks enables marketers to blend, normalize, and visualize all their data in one place—empowering smarter decisions and better ROI across the entire marketing ecosystem.
Leveraging AI and Insights for Performance Optimization
The next frontier in digital marketing dashboards isn’t just collecting data—it’s transforming that data into actionable insights at scale. This is where AI-powered marketing dashboards truly shine, turning overwhelming streams of campaign metrics into clear, strategic guidance for marketers.
AI marketing dashboards leverage advanced algorithms to automatically analyze trends, identify anomalies, and surface opportunities you might otherwise miss. Features like predictive analytics enable teams to forecast future results, proactively adjust budgets, and optimize campaigns before issues arise. For example, if your cost-per-acquisition suddenly spikes on a particular platform, anomaly detection can flag the outlier instantly, prompting your team to investigate and resolve the issue in real time.
But AI doesn’t stop at detection; it goes a step further with automated recommendations. These dashboards can suggest budget reallocations, highlight underperforming channels, or even score campaigns based on likelihood of meeting KPIs. With tools like TapClicks’ SmartPilot, insights are not just surfaced—they’re prioritized and explained, helping marketers make smarter decisions faster and with greater confidence.
Bringing these capabilities together, AI-powered dashboards transform raw marketing data into a competitive advantage. They not only automate the heavy lifting of data analysis, but also empower your team to act on insights immediately—whether it’s optimizing creative, reallocating spend, or refining audience targeting. For a deeper dive into how automation and AI can unlock the full potential of your analytics and reporting, check out TapClicks’ guide on unlocking analytics and reporting with automation.
By embedding AI and insights directly into your KPI dashboard, you move from reactive reporting to proactive performance optimization—ensuring your marketing investments consistently deliver maximum ROI.
Choosing the Right Dashboard for Your Marketing Team
Selecting a digital marketing KPI dashboard isn’t just about pretty charts—it’s about enabling true visibility, efficiency, and agility across your marketing operation. With countless analytics platforms available, it’s important to balance what you need today with what you’ll require as you scale.
Comparing Your Dashboard Options
Let’s break down the main categories of dashboard solutions, each with its own strengths and trade-offs:
1. DIY Dashboards
- Tools: Google Data Studio, Excel
- Best For: Small teams with basic reporting needs
- Limitations:
- Manual data entry and maintenance
- Limited automation
- No built-in role-based security
2. Lightweight Tools
- Examples: Agency Analytics, NinjaCat
- Best For: Quick setup and basic automation
- Limitations:
- Can struggle with large data volumes
- Limited multi-client or multi-location support
- May lack customization for complex environments
3. Enterprise Solutions
- Standout: TapClicks
- Best For: Agencies, media companies, mid-market and enterprise brands
- Strengths:
- Thousands of data connectors
- Advanced automation and visualization
- Built-in workflow and cross-channel analytics
- Scalable for hundreds or thousands of clients and campaigns
What Should You Look For?
Before making a decision, here’s what to keep front and center:
- Scalability: Can it handle your current and future workload?
- Integrations: Native connections to all your paid, owned, earned, and offline data sources?
- Customization: Flexible dashboards and KPIs for different users—no developers needed.
- User Roles & Access: Granular permissions for both internal teams and external clients.
- Automation & AI: Automated report creation, scheduling, delivery, and actionable AI insights.
- Support & Onboarding: Responsive support, training, and onboarding resources.
Dashboard Decision Checklist
Use this quick table to evaluate each contender:
| Requirement | Must-Have? | Notes/Examples |
|---|---|---|
| Integrates all data sources | ☑️ | Paid, owned, earned, offline |
| Automated reporting | ☑️ | Creation, scheduling, delivery |
| Customizable dashboards | ☑️ | For clients, brands, business units |
| User-friendly interface | ☑️ | For all skill levels |
| Role-based access | ☑️ | Security, collaboration |
| AI-powered insights | ☑️ | Recommendations, alerts |
| Future scalability | ☑️ | Grows with your business |
| Onboarding & support | ☑️ | Training, troubleshooting |
How to Move Forward
- List your non-negotiables: What’s critical for your team’s workflow and client needs?
- Demo top contenders: See how each platform handles your real-world data and reporting scenarios.
- Prioritize future-proofing: Choose a solution that won’t hold you back as you grow.
- Involve your team: Gather feedback from both technical and non-technical users.
By taking a structured approach and focusing on what matters most, you’ll empower your marketing team with a dashboard that not only delivers insights—but transforms how you work, collaborate, and win.
Getting Started: Setting Up Your Digital Marketing KPI Dashboard
Launching a digital marketing KPI dashboard doesn’t have to be daunting. With the right strategy and tools, you can turn fragmented data into a unified, actionable resource in just a few steps. Here’s how to get started:
1. Integrate Your Marketing Data Sources
Begin by connecting all relevant data channels—think Google Ads, Facebook, email platforms, SEO tools, and programmatic networks. A robust dashboard platform like TapClicks offers thousands of pre-built connectors, making it easy to centralize data from across your entire marketing stack. For custom sources, many platforms also support smart connectors and data enrichment to ensure your information is complete and normalized.
2. Define and Select Your KPIs
With your data flowing in, work with stakeholders to identify the key performance indicators that matter most—such as impressions, conversions, CPA, ROAS, and engagement rates. Tailor your dashboard view to different roles: executives may prefer high-level ROI metrics, while analysts and campaign managers might need granular, channel-specific details.
3. Set Up Visualizations
Turn raw numbers into insights with compelling visualizations. Use charts, trend lines, scorecards, and custom widgets to highlight goals, performance trends, and anomalies. Group related metrics (e.g., paid search vs. organic) for easy comparison and set up filters so users can drill down by campaign, date range, or location.
4. Automate Reporting and Alerts
Leverage your dashboard’s automation features to schedule recurring reports for stakeholders—daily, weekly, or monthly, as needed. Set up automated alerts for metric anomalies or goal attainment, so your team can act quickly when performance shifts. This ensures everyone stays informed and responsive without the manual reporting grind.
5. Onboard Your Team and Drive Adoption
Roll out the dashboard with a clear onboarding plan. Offer training sessions, share documentation, and create quick-start guides tailored to each user role. Encourage adoption by demonstrating how the dashboard saves time, reduces errors, and empowers smarter, faster decisions. Collect feedback early to refine your setup and ensure it meets your team’s needs.
6. Iterate and Optimize
Once live, treat your dashboard as a living tool. Regularly review KPIs, tweak visualizations, and update integrations as your marketing strategy evolves. Solicit input from users to surface new requirements or pain points, and take advantage of platform enhancements—like AI insights or new connectors—to keep your reporting ahead of the curve.
Next Steps:
Ready to transform your reporting workflow? Start by mapping out your data sources and KPIs, then explore platforms like TapClicks that streamline setup, automate reporting, and scale with your business. With a modern digital marketing KPI dashboard in place, your team will gain clarity, speed, and the actionable insights needed to drive growth.
Start Automating Your Marketing Data Today!
No Credit Card Required.

