

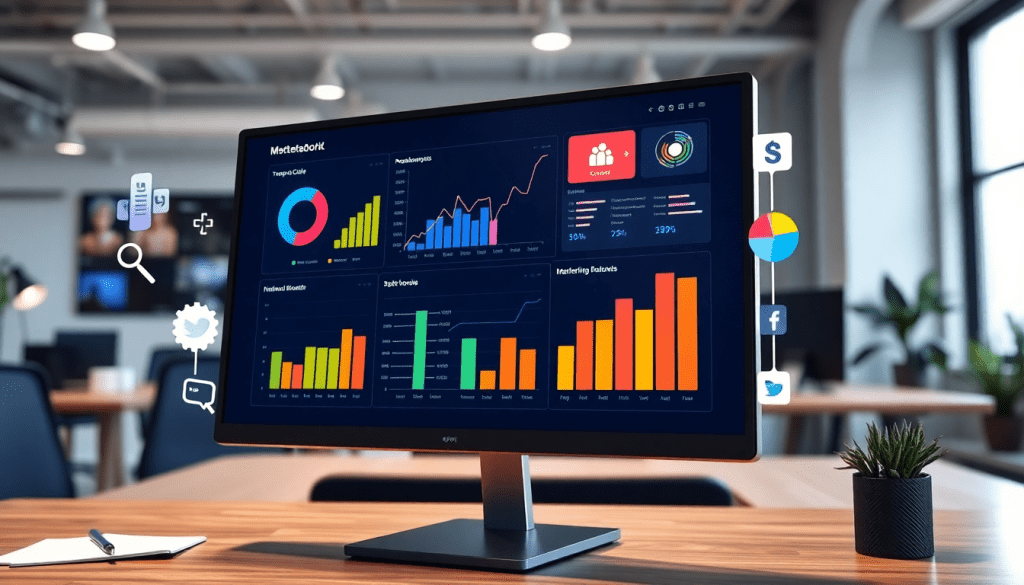
Digital Marketing KPI Dashboard: Visualize Metrics & Performance
A digital marketing KPI dashboard is more than just a collection of charts — it’s a mission control for your campaigns, bringing together marketing metrics visualization, performance tracking, and actionable insights into one interactive hub. Unifying cross-channel analytics, these dashboards empower marketers to monitor campaign KPIs in real time, automate reporting, and make smarter decisions to maximize ROI. In this guide, you’ll learn how to leverage a modern digital marketing KPI dashboard to streamline operations, boost results, and gain a strategic edge.
What is a Digital Marketing KPI Dashboard?
A digital marketing KPI dashboard is an interactive platform that consolidates and visualizes all your most important marketing key performance indicators (KPIs) in one unified, real-time view. Traditionally, marketers tracked performance metrics in fragmented spreadsheets, isolated analytics tools, or individual channel dashboards. As digital marketing matured—spanning paid search, social, programmatic, email, and more—this siloed approach made it nearly impossible to get a holistic picture of campaign health or ROI.
The modern digital marketing KPI dashboard has evolved to solve this complexity. At its core, it acts as a mission control center for marketers, centralizing critical data streams from across the marketing ecosystem—Google Ads, Facebook, programmatic platforms, website analytics, and CRM—into a single, customizable hub. This centralization is more than a convenience; it’s essential for today’s data-driven marketing teams tasked with managing multi-channel campaigns, optimizing budgets, and demonstrating value to stakeholders.
A robust KPI dashboard empowers marketers to:
- Visualize performance across channels in real time
- Monitor and compare campaign KPIs side-by-side
- Detect trends, anomalies, and opportunities instantly
- Share insights with internal teams and clients through automated, branded reports
With the explosion of marketing data and the increasing pressure to prove ROI, having a unified KPI dashboard is no longer a luxury—it’s a competitive necessity. To see how these dashboards work in practice and why they’re pivotal for marketing success, explore the "TapClicks: Digital Marketing KPI Dashboard Overview".
Essential KPIs and Metrics Every Dashboard Should Track
A high-impact digital marketing KPI dashboard is only as powerful as the metrics it displays. Selecting the right mix of key performance indicators (KPIs) ensures that your team can quickly gauge the health of campaigns, pinpoint opportunities for optimization, and prove ROI to stakeholders. Here are the essential KPIs and metrics every dashboard should track:
1. Traffic and Audience Metrics:
Start with the basics—track website sessions, unique visitors, and new vs. returning users. These indicators provide an instant pulse on your reach and audience growth across channels.
2. Conversions and Conversion Rate:
Monitor the total number of conversions (such as form fills, purchases, or sign-ups) alongside the conversion rate, which shows the percentage of visitors who take your desired action. These KPIs are central to understanding campaign effectiveness.
3. Cost Per Lead (CPL) and Cost Per Acquisition (CPA):
For paid campaigns, CPL and CPA tell you how efficiently you’re generating leads or customers. Tracking these metrics helps you allocate budget to the highest-performing channels.
4. Return on Ad Spend (ROAS) and Overall ROI:
ROAS measures revenue generated for every dollar spent on advertising, while ROI takes a broader view by considering all marketing costs. Both are critical for demonstrating the financial impact of your campaigns.
5. Engagement Metrics:
Beyond clicks and impressions, advanced engagement metrics—such as click-through rate (CTR), average session duration, bounce rate, and social media engagement (likes, shares, comments)—reveal how deeply your audience interacts with your content.
6. Attribution and Multi-Touch Metrics:
Modern dashboards should track attribution models (first touch, last touch, linear, etc.) to help you understand which channels and tactics influence customer journeys and ultimately drive conversions.
7. Customer Lifetime Value (CLV):
CLV estimates the total revenue a single customer generates over their relationship with your brand. This long-term metric is key for brands focused on retention and maximizing overall customer value.
8. Custom KPIs for Teams and Clients:
No two organizations are alike, and a robust dashboard solution should allow you to customize KPIs for different teams, business units, or clients. Whether you’re an agency managing hundreds of accounts or an in-house marketing leader aligning metrics to executive goals, flexibility is essential for relevant, actionable reporting.
By tracking a blend of core and advanced metrics—and tailoring them to your unique objectives—you’ll transform your dashboard from a static report into a dynamic decision-making engine that drives continuous improvement and measurable results.
Core Features of an Effective KPI Dashboard
A high-impact digital marketing KPI dashboard goes beyond basic charts — it empowers marketing teams with the clarity, speed, and collaboration needed to drive better outcomes. Let’s break down the essential features every KPI dashboard should offer:
1. Interactive Performance Metrics
Dynamic dashboards allow users to drill down, filter, and segment data in real time. Marketers can instantly toggle between channels, campaigns, or timeframes, revealing granular insights without manual data wrangling. This interactivity is vital for quickly identifying what’s working and where to pivot strategy.
2. Real-Time Updates
Modern campaigns move fast, and so should your data. A top-tier dashboard ingests and visualizes metrics as they come in, providing immediate visibility into campaign health and performance KPIs. Real-time data eliminates lag, ensuring teams can respond to trends, anomalies, or opportunities the moment they arise.
3. Automated KPI Reports
No more late nights spent assembling spreadsheets. Effective KPI dashboards automate the process of generating and distributing performance reports — whether on a set schedule or on demand. This automation saves time, reduces manual errors, and keeps stakeholders consistently informed.
4. Cross-Channel Analytics and Data Unification
Siloed data is a thing of the past. A robust dashboard brings together metrics from paid search, social, display, email, and more, unifying them into a single view. This cross-channel approach enables marketers to spot patterns, compare performance, and attribute results across the full marketing mix — all in one place.
5. Intuitive Visualization and User-Friendly Design
Even the richest data sets are only valuable if they’re easy to interpret. The best dashboards offer drag-and-drop widgets, customizable layouts, and clear visualizations (charts, heat maps, tables, etc.) tailored to different roles and preferences. This ease of use ensures everyone — from analysts to executives — can glean insights quickly and confidently.
To see how these core features come together in practice, explore "Visualizing Metrics & Performance with Dashboards". The right dashboard doesn’t just show what’s happening — it turns marketing data into your team’s most powerful decision-making tool.
For organizations seeking a unified, scalable dashboard solution, platforms like TapClicks deliver all these features and more, empowering marketing teams to operate at peak performance.
Campaign KPI Monitoring: How Dashboards Streamline Performance Tracking
Effective campaign KPI monitoring is the backbone of marketing agility and results. A modern digital marketing KPI dashboard transforms what could be a cumbersome, manual process into a streamlined, real-time workflow—enabling marketers to not only track performance but also optimize campaigns as data unfolds.
Setup for Success:
The first step is connecting your marketing channels—think Google Ads, Facebook, email, SEO, and more—into a unified dashboard. Tools like TapClicks simplify this by integrating thousands of data sources, ensuring all your KPIs (such as conversions, CPL, ROAS, and engagement rates) are automatically pulled in and standardized. Customizable widgets let you tailor the dashboard to each campaign’s unique goals, whether you’re focusing on lead generation, e-commerce sales, or brand awareness.
Proactive Alerts and Rapid Response:
Once your dashboard is live, automated alerts play a crucial role. Set thresholds for key metrics—like a sudden drop in click-through rate or an unexpected spike in cost per lead—and the system will notify you instantly. This proactive monitoring lets teams address issues before they escalate, reallocating budget or adjusting creative in near real time.
Scenario: Daily, Weekly, and Monthly Monitoring:
- Daily: A media agency starts each morning by scanning their dashboard’s real-time campaign summary. An alert flags unusually high spend on a social ad set. Within minutes, the team pauses the underperforming ads and reallocates budget to top performers—saving thousands over the month.
- Weekly: Marketing managers review automated reports summarizing cross-channel KPIs. Trends like declining engagement are spotted early, prompting creative refreshes or strategic pivots.
- Monthly: Stakeholders receive branded performance recaps, complete with visualizations of progress toward goals, allowing for informed planning and resource allocation in the next cycle.
Ultimately, a digital marketing KPI dashboard doesn’t just display data—it empowers marketers to monitor, analyze, and optimize campaigns with speed and confidence. By centralizing campaign KPI monitoring, teams can move from reactive troubleshooting to proactive strategy, driving better outcomes and higher ROI.
Automating KPI Reports: Save Time and Reduce Errors
Manual reporting is one of the most time-consuming and error-prone aspects of digital marketing analytics. With campaigns running across multiple channels and clients demanding frequent updates, teams can easily spend dozens of hours each month pulling data, formatting spreadsheets, and double-checking numbers for accuracy. Automating KPI reports transforms this process, delivering several critical advantages for both internal teams and client communications.
Benefits of Automated KPI Reporting
First, automation slashes the time required to generate campaign performance updates. Instead of manually aggregating data from multiple sources, a digital marketing KPI dashboard like TapClicks pulls metrics in real time from thousands of marketing, advertising, and business platforms. Reports can be scheduled to run at any frequency—daily, weekly, monthly, or custom intervals—ensuring stakeholders always receive the latest insights without waiting.
Second, automated reports drive consistency and reduce the risk of human error. By leveraging pre-built templates and standardized data pipelines, you eliminate discrepancies that might arise from copy-pasting or manual calculations. This uniformity builds stakeholder trust and enables accurate performance tracking over time.
TapClicks’ Approach to Automated Digital Campaign Reporting
TapClicks takes reporting automation a step further. Users can create drag-and-drop dashboards and branded reporting studios that automatically update with the latest campaign KPIs. Reports can be scheduled for delivery to internal teams or directly to clients, with access tailored by role and permission level. For agencies managing hundreds of clients, this means a single platform can handle thousands of dashboards and reports simultaneously—no more scrambling to update PowerPoints or spreadsheets for every review meeting.
TapClicks also offers on-demand reporting, allowing users to instantly generate up-to-date KPI summaries whenever ad hoc insights are needed. The platform’s SmartEmail feature can even deliver AI-curated insight summaries directly to stakeholders’ inboxes, highlighting key trends and recommendations without requiring manual analysis.
The Bottom Line
Automating KPI reports isn’t just about efficiency—it’s about enabling marketing teams to focus on strategy and optimization instead of repetitive tasks. With tools like TapClicks, you can ensure your reporting is fast, accurate, and always actionable, giving you and your clients a powerful edge in today’s data-driven marketing landscape.
Advanced Analytics: How AI Turns Dashboards Into Decision Engines
Today’s digital marketing dashboards are far more than static reporting tools. With AI and advanced analytics, they’ve become dynamic platforms that help marketers forecast trends, reveal hidden opportunities, and drive ROI across every channel.
What Makes AI Dashboards a Game Changer?
AI-powered dashboards do more than display data—they interpret it. Here’s how they help marketers move from hindsight to foresight:
- Pattern Recognition: AI analyzes cross-channel data to detect emerging trends and performance anomalies.
- Real-Time Alerts: Get notified instantly about underperforming campaigns or budget issues.
- Personalized Recommendations: TapClicks’ SmartPilot AI Agents proactively suggest optimizations, such as reallocating budgets or scaling high-performing audiences.
Predictive Analytics: Your Marketing Crystal Ball
Looking to stay ahead of the curve? Predictive analytics built into platforms like TapClicks can:
- Forecast Outcomes: Anticipate campaign performance across channels.
- Benchmark Results: Compare your metrics with industry standards.
- Offer Actionable Guidance: Receive suggestions—like shifting spend or tweaking creative—to prevent wasted budget and seize new opportunities.
This means less guesswork and more confident, data-backed decisions, faster than ever.
See the Full Picture with Unified Data
One of the biggest advantages of advanced analytics platforms is data unification. TapClicks, for example, lets you:
| Data Source | Unified by TapClicks? | Example Metrics |
|---|---|---|
| Paid Search | ✅ | CPC, Conversions |
| Social Media | ✅ | Engagement, Reach |
| Display Ads | ✅ | Impressions, CTR |
| Email Marketing | ✅ | Opens, Clicks |
Why does this matter?
- You get a single source of truth for performance.
- Attribution is simplified—see exactly which channels drive value.
- It’s easier to visualize the full customer journey and optimize for holistic ROI.
Ready to See the Impact?
Curious how unified analytics and AI insights can transform your marketing outcomes?
Track ROI with a Digital Marketing KPI Dashboard (TapClicks Blog)
By harnessing AI and advanced analytics, your dashboards become more than reports—they become your competitive edge for smarter, faster, and more profitable marketing.
Choosing the Right Dashboard Solution for Your Team
With a growing landscape of digital marketing dashboard solutions, selecting the right platform is critical—and not as simple as checking off a list of integrations. The best choice will empower your team with reliable data, actionable insights, and operational efficiency that scales with your business.
Compare Platform Options and Integrations
Modern marketing teams often evaluate dashboard tools like TapClicks, Funnel.io, Adverity, Agency Analytics, Datorama, and Supermetrics. Each offers different strengths: some specialize in data piping, others in lightweight reporting, and others—like TapClicks—combine robust data integration, AI-powered analytics, and workflow automation within a single platform. When comparing, prioritize a solution with broad native integrations (across ad platforms, CRM, analytics, and more), as well as flexible data blending and enrichment to support complex, multi-channel reporting needs.
Key Considerations: Scalability, Flexibility, and Support
- Scalability: Can the dashboard handle hundreds (or thousands) of campaigns, clients, or locations as your business grows? Platforms like TapClicks are designed for high-volume use, making them ideal for agencies and enterprise teams.
- Flexibility: Does the tool allow you to customize dashboards, KPI selections, and reporting templates for different stakeholders? Look for platforms that support both out-of-the-box visualizations and advanced, user-defined metrics.
- Ease of Onboarding: Is the platform intuitive for new users? Consider how quickly your team can deploy the dashboard and start creating value.
- Support and Service: Responsive support, onboarding assistance, and access to a knowledge base can be just as important as technology features. Ensure your vendor is a true partner in your success.
Tips for Evaluating Dashboard Tools
- Map Requirements to Use Cases: Identify your most important KPIs, data sources, and reporting workflows. Choose a platform that aligns with your unique needs—whether that’s multi-location reporting for a franchise brand, or automated client reports for a digital agency.
- Test Integrations: Pilot the connection of your primary marketing platforms (Google Ads, Facebook, CRM, etc.) to ensure seamless data flow.
- Assess User Experience: Involve both analysts and end users in demos or trials to gauge usability and adoption potential.
- Plan for Growth: Select a platform that won’t require a costly migration as your reporting needs evolve.
By carefully evaluating dashboard solutions on these criteria, you’ll set your team up for measurable success—turning your digital marketing KPI dashboard into the nerve center for smarter, data-driven decisions.
Getting Started: Best Practices for Dashboard Implementation
Launching a digital marketing KPI dashboard can be a transformative step for your organization—but only if you approach implementation strategically. To ensure your dashboard delivers maximum value from day one and continues to evolve with your needs, consider these best practices:
1. Define Clear Objectives and KPIs
Start by aligning stakeholders on the primary goals for your dashboard. Are you focused on lead generation, brand awareness, ROI, or client reporting? Select KPIs that directly support your business objectives, and avoid information overload by prioritizing metrics that truly matter for your team or clients.
2. Audit and Integrate Your Data Sources
Map out all data sources that will feed your dashboard—advertising platforms, CRM, web analytics, email, social, and more. Use a platform like TapClicks to streamline integration and unify your datasets. This ensures your dashboard provides a single source of truth and eliminates manual data wrangling.
3. Design with the End User in Mind
Create dashboards that are intuitive and actionable. Involve end users (marketers, analysts, clients) early in the design process to gather input on layout, visualizations, and navigation. Focus on clarity: use filters, drill-downs, and customizable views so each stakeholder sees the most relevant insights.
4. Automate Reporting and Alerts
Set up automated reporting schedules to deliver regular KPI updates to internal teams and clients. Leverage built-in alerting features to notify you of anomalies or sudden shifts in performance, enabling faster responses to opportunities and challenges.
5. Train Teams and Foster Adoption
Organize training sessions and provide documentation to help users get comfortable with your dashboard’s features. Encourage feedback and create an open channel for support. Adoption increases when teams understand the “why” and “how” behind their new analytics hub.
6. Establish a Continuous Improvement Loop
Your dashboard isn’t a set-it-and-forget-it tool. Regularly review performance, solicit user feedback, and iterate on your dashboard’s structure and KPIs. Schedule quarterly check-ins to assess whether your dashboard is still aligned with business goals, and adjust as your strategy evolves.
7. Measure Success and Celebrate Wins
Track metrics like report usage, time saved, and improvements in campaign outcomes as a result of dashboard adoption. Share success stories internally to reinforce the value of data-driven decision-making and keep teams engaged.
By following this checklist—and leveraging powerful solutions like TapClicks for seamless data integration, reporting automation, and ongoing optimization—you’ll lay the foundation for a KPI dashboard that not only visualizes metrics, but drives smarter marketing operations for years to come.
Start Automating Your Marketing Data Today!
No Credit Card Required.

