

Digital Marketing KPI Dashboard: Visualize Metrics & Performance
For marketers and agencies managing multiple channels, clients, and campaigns, making sense of performance data can quickly become overwhelming. A digital marketing KPI dashboard brings clarity and control, letting you see all your vital metrics—across platforms—in one place. With automated reporting, interactive visualizations, and AI-powered insights, KPI dashboards turn raw numbers into actionable intelligence. This guide will show you what makes a high-impact performance tracking dashboard, how to select the right metrics, and how to use automated KPI reports to drive smarter decisions and better ROI.
What is a Digital Marketing KPI Dashboard?
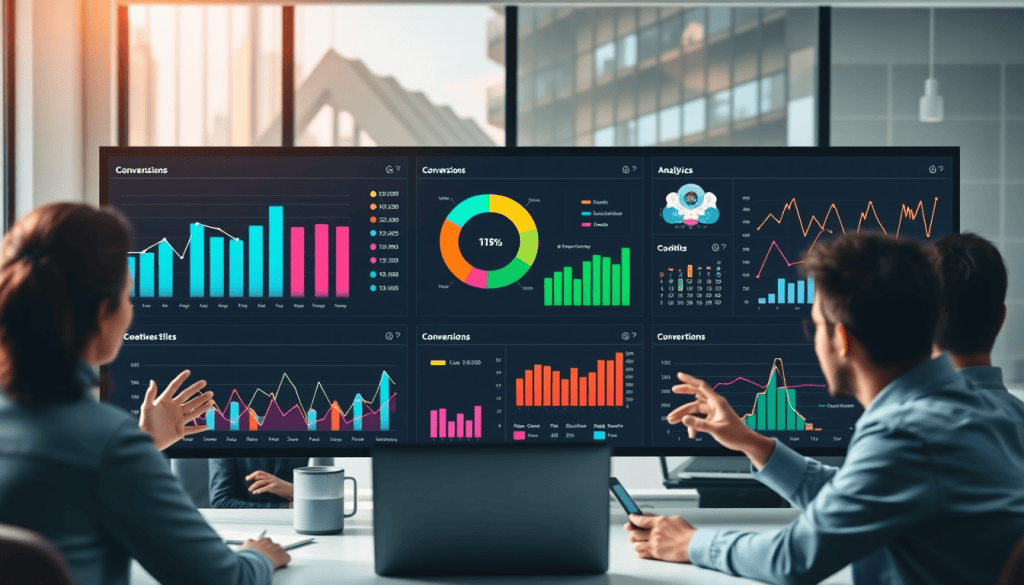
A digital marketing KPI dashboard is a centralized, visual platform that tracks and displays your most important marketing metrics—Key Performance Indicators (KPIs)—in real time. Its core purpose is to provide marketers, agencies, and stakeholders with a clear, at-a-glance overview of how campaigns and channels are performing against business objectives.
Unlike traditional spreadsheets or manual reports, which require time-consuming data gathering and manipulation, a KPI dashboard automatically consolidates metrics from multiple sources—such as Google Ads, Facebook, LinkedIn, programmatic platforms, and more—into one intuitive interface. This means you can monitor impressions, clicks, conversions, cost per acquisition (CPA), return on ad spend (ROAS), and other vital stats without jumping between platforms or wrangling unwieldy Excel files.
The benefits of this unified approach are significant. With all your marketing data in one place, you reduce manual errors, save hours on reporting, and get a holistic view of performance. Dashboards also enable faster decision-making by highlighting real-time trends, surfacing outliers, and making it easy to compare results across campaigns, channels, or clients. Visualizations and automated updates transform raw numbers into actionable intelligence, empowering teams to identify opportunities and address issues before they impact ROI.
In summary, a digital marketing KPI dashboard is more than just a reporting tool—it’s a command center that streamlines your analytics workflow, enhances collaboration, and drives smarter, data-backed marketing decisions. To learn more about how a unified dashboard can transform your marketing operations, visit TapClicks.
Core KPIs Every Digital Marketer Should Track
Building a truly effective digital marketing KPI dashboard starts with knowing which metrics matter most. While every business is unique, there are foundational KPIs that nearly all marketers should monitor to gauge campaign health, optimize spend, and prove value to stakeholders.
Essential KPIs for Digital Marketing Success
- Impressions: The total number of times your ad or content is displayed. This measures reach and helps assess brand visibility.
- Clicks: The number of times users interact with your ad or link. Clicks are a direct measure of engagement and initial interest.
- Click-Through Rate (CTR): The ratio of clicks to impressions, revealing how compelling your messaging is.
- Conversions: The number of desired actions completed (purchases, sign-ups, downloads). This shows how well your campaigns drive business outcomes.
- Cost Per Acquisition (CPA): The average spend required to acquire a new customer or lead. Lower CPA indicates more efficient campaigns.
- Return on Investment (ROI): The profitability of your marketing efforts, calculated as (Revenue – Cost) / Cost.
- Return on Ad Spend (ROAS): Measures the revenue generated per dollar spent on advertising—key for paid media optimization.
- Engagement Rate: Tracks likes, shares, comments, and other interactions on social or content channels to gauge audience involvement.
- Bounce Rate: The percentage of users who leave your site after viewing only one page, signaling potential issues with landing page relevance or user experience.
- Average Order Value (AOV): The average amount spent per transaction, helping refine upselling and cross-selling strategies.
Aligning KPIs with Business Goals
Selecting the right KPIs means looking beyond vanity metrics and focusing on those that map directly to your marketing objectives. For example, a brand awareness campaign will prioritize impressions and reach, while a lead generation campaign should emphasize conversions and CPA. Consider your sales funnel and business goals: Are you aiming to boost visibility, generate leads, drive online sales, or retain customers? Tailoring your dashboard to these objectives ensures you’re tracking what truly matters for growth.
Prioritizing and Organizing Your Dashboard
A cluttered dashboard can obscure critical insights. Start by grouping KPIs into logical categories—such as awareness, engagement, acquisition, and retention. Highlight your primary goals at the top, with supporting metrics below for context. Use filters and drill-down capabilities to let users explore data by channel, campaign, or time frame. With platforms like TapClicks, you can customize dashboard layouts and automate data flows, ensuring that your team and clients always see the most relevant, up-to-date performance indicators at a glance.
By tracking the right KPIs, aligning them to your business strategy, and presenting them clearly, your marketing dashboard becomes a powerful tool for data-driven decision-making and continuous improvement.
Visualizing Marketing Metrics for Better Insights
Visualizing marketing metrics is crucial for transforming raw data into actionable intelligence. When performance numbers are presented as intuitive visuals—rather than dense tables—they become far easier to interpret, enabling teams to spot trends, patterns, and outliers at a glance. This instant clarity drives faster, more confident decision-making, ensuring marketers don’t miss opportunities or warning signs buried in spreadsheets.
Key Visualization Types:
- Line graphs effectively show changes over time, such as the rise and fall of website traffic or conversion rates by week.
- Bar charts make it simple to compare performance across channels or campaigns—for example, quickly revealing which paid social platform is delivering the most leads.
- Heatmaps highlight areas of highest activity or engagement, ideal for web analytics or understanding which ad creatives resonate best.
- Funnel visualizations map out each stage of the customer journey, pinpointing where prospects drop off so you can optimize conversion paths.
For example, a marketing team may use a line graph to monitor click-through rates across multiple campaigns, instantly identifying any sudden drops that require immediate attention. With a heatmap, they might uncover that certain landing pages consistently outperform others, guiding content strategy and A/B testing efforts. Funnel charts, meanwhile, make it obvious where users abandon the signup process, helping prioritize UX improvements.
These powerful visual tools not only save time but also make it easier to communicate results and insights to stakeholders who may not be data experts. Modern marketing dashboard platforms take this a step further by automating the process, updating visualizations in real time as new data flows in. For a deeper dive into how automated dashboard reporting and visualization can elevate your analytics and storytelling, check out this article on marketing dashboard automation for analytics & reporting.
By leveraging clear, interactive visuals, marketers can move from simply collecting data to actively using it—unlocking new opportunities and driving smarter growth. To see how a unified marketing operations platform like TapClicks can power these visualizations at scale, explore more at TapClicks.
Cross-Channel Analytics: Unifying Data from Every Platform
In today’s fragmented digital landscape, marketers run campaigns that span Google Ads, Facebook, Instagram, LinkedIn, TikTok, programmatic display, email, and more. Each of these platforms operates in its own ecosystem—producing unique data formats, reporting structures, and performance definitions. This complexity creates a major challenge: how can you truly measure campaign effectiveness or optimize spend when your data is siloed across so many sources?
A cross-channel analytics dashboard is designed to solve this problem by aggregating all your marketing data into a single, unified view. Instead of logging into multiple ad managers or wrangling CSV exports, you see consolidated KPIs—like impressions, conversions, cost per acquisition, and ROI—side by side, regardless of channel. This holistic approach empowers marketers and agencies to compare performance, spot trends, and identify which combinations of platforms drive the best results for each client or campaign.
The power of a cross-channel dashboard hinges on its integration capabilities. Leading solutions, such as TapClicks, offer thousands of pre-built data connectors for advertising, social, search, CRM, and web analytics platforms. These connectors automatically extract, standardize, and update your data, eliminating hours of manual spreadsheets and copy-paste errors. Advanced dashboards also provide enrichment tools, letting you blend and normalize datasets—so you can accurately track multi-touch attribution, monitor budget pacing, or report on multi-location performance.
By unifying your marketing data, cross-channel analytics dashboards not only improve accuracy and efficiency, but also make it possible to see the full picture. You’ll gain deeper insight into what’s working, where to optimize, and how to allocate budgets for maximum impact—all from one centralized hub.
Automated KPI Reports: Saving Time and Enhancing Accuracy
Automated KPI reports are a game-changer for digital marketers and agencies seeking to streamline their reporting processes. Rather than manually pulling data from multiple platforms, organizing spreadsheets, and painstakingly assembling performance summaries, automated reports harness the power of your dashboard to compile, visualize, and distribute metrics with minimal human intervention. These reports are generated on a schedule or triggered by key events, ensuring stakeholders always have the latest insights—without the need for manual updates.
The core advantage of automated KPI reporting lies in its efficiency. By eliminating repetitive tasks, marketers save significant time—often reclaiming 50+ hours per analyst per month. This time savings can then be reinvested into strategy, campaign optimization, and client communication. Additionally, automation drastically reduces the risk of human error. With data flowing directly from integrated sources, the chances of missed updates, copy-paste mistakes, or outdated numbers drop to near zero, resulting in more accurate and trustworthy reporting.
Practical examples of these benefits can be found in "automated dashboard reporting efficiency", which details how agencies leverage marketing dashboards to deliver timely, error-free KPI updates to clients. With features like scheduled report delivery, dynamic dashboards, and role-based access, automated reporting empowers teams to move faster and provide greater transparency.
Ultimately, integrating automated KPI reporting into your marketing operations platform—such as TapClicks—enables you to focus on what matters most: analyzing trends, making data-driven decisions, and driving measurable results for your business or clients.
AI & Smart Insights: Making Your Dashboard Work Harder
Today’s digital marketing landscape moves faster than ever—so your dashboard needs to do more than just display data. With the advent of AI-powered marketing dashboards, data visualization is evolving into true intelligence. These platforms don’t just show you the numbers; they interpret them, surface hidden patterns, and recommend actionable next steps that drive real business outcomes.
What Sets an AI Marketing Dashboard Apart?
Traditional dashboards aggregate and visualize KPIs, but AI-enhanced dashboards, like those powered by TapClicks’ SmartPilot and TapInsights, go further. They use machine learning to analyze vast datasets in real time, automatically flagging anomalies, detecting trends, and benchmarking performance against historical or industry standards. This means marketers don’t have to hunt through spreadsheets or slice and dice visualizations manually—AI does the heavy lifting, highlighting what matters most.
Uncovering Hidden Trends and Anomalies
AI-driven insights are particularly adept at surfacing what human eyes might miss. For example, if a campaign’s click-through rate suddenly spikes on one channel but drops elsewhere, AI agents can instantly flag this as an anomaly and suggest possible causes. Or, if your multi-location campaigns consistently perform better in a certain region, AI can detect this trend and recommend reallocating budget for optimal ROI.
From Data to Action: Real-World Scenarios
Consider a scenario where your dashboard’s AI agent notices a drop in conversion rates following a recent ad creative change. Instead of waiting for weekly reports, you get an automated SmartEmail with insight summaries and recommended optimizations—perhaps suggesting you A/B test the previous creative or adjust targeting parameters. Or imagine AI-based predictive models alerting you that you’re about to overspend your monthly budget based on current pacing, allowing you to course-correct in real time.
Why AI Insights Matter for Marketers
- Faster Decision-Making: No more waiting for manual analysis—AI delivers insights as soon as patterns emerge.
- Proactive Optimization: AI doesn’t just report on what happened, it tells you what to do next, from reallocating spend to refining messaging.
- Personalized Reporting: AI can tailor insights for different stakeholders, ensuring clients and teams receive the information that matters most.
To see how AI-driven dashboards are revolutionizing marketing analytics, check out the TapClicks platform—where actionable intelligence and automated recommendations help agencies and brands maximize every marketing dollar. With the power of AI, your dashboard becomes a true strategic partner, not just a reporting tool.
Maximizing ROI Tracking and Campaign Optimization
A digital marketing KPI dashboard is more than a reporting tool—it’s a command center for ROI tracking and campaign optimization. By consolidating real-time performance data across every channel, marketers can measure what truly matters: the return on every ad dollar spent.
How Dashboards Enable ROI Tracking
With a modern dashboard, all your critical metrics—costs, conversions, revenue, and more—are automatically pulled from each platform and unified into a single view. This eliminates manual data wrangling and ensures that ROI and ROAS calculations reflect the latest campaign performance. Instead of waiting for end-of-month reports, marketers can instantly spot which channels, creatives, or audiences are driving the highest returns and which are underperforming.
Step-by-Step Campaign Optimization with Dashboards
- Monitor Key ROI Metrics in Real Time: Start by tracking your spend, conversions, and revenue at a granular level (by channel, campaign, or creative). This makes it easy to identify trends and anomalies as they emerge.
- Analyze Performance by Segment: Use dashboard filters to break down results by audience, geography, or device. Visualizations like heatmaps or funnel charts help you see where prospects drop off or which segments yield the best returns.
- Compare Historical and Current Data: Overlay current campaign performance against past periods to assess improvement and seasonality. This context is vital for understanding whether ROI gains are sustainable.
- Act on Insights Quickly: Armed with real-time data, you can reallocate budget from low-performing channels to those with higher ROAS, adjust bids, or test new creative—all within hours, not weeks.
- Automate Reporting and Share Results: Scheduled, automated ROI reports keep stakeholders aligned and enable rapid, data-driven decisions.
For actionable strategies on using dashboards to unlock analytics and ROI reporting, check out this guide on "unlocking dashboard analytics and ROI reporting".
Turning Insights into Action
Dashboards empower marketers to go beyond surface-level metrics. By connecting spend to outcomes, you can justify investments, fine-tune campaigns, and maximize the impact of every marketing dollar. Solutions like TapClicks make this process seamless, offering advanced visualization, automation, and AI-driven recommendations that take the guesswork out of ROI optimization.
Choosing the Right Digital Marketing KPI Dashboard
Selecting the ideal digital marketing KPI dashboard is a strategic decision that impacts your team’s efficiency, data quality, and ultimately, campaign performance. With a crowded market of dashboard platforms, focus on these key criteria to ensure you make the right choice for your agency or brand:
1. Integration Capabilities:
The best dashboards connect seamlessly to all your data sources—think Google Ads, Facebook, LinkedIn, programmatic platforms, CRM, and more. Look for solutions with a broad range of native connectors, support for custom integrations, and the ability to automatically pull in data without manual intervention.
2. Ease of Use:
An intuitive interface is essential for broad adoption. Your dashboard should enable users to build and customize reports, visualize metrics, and set up automations without steep learning curves or heavy IT involvement.
3. Scalability:
As your marketing operations grow, your dashboard must easily handle more data, additional users, and multiple clients or locations. Evaluate whether the platform can manage high volumes of reports, dashboards, and user roles without performance bottlenecks.
4. Customization & Flexibility:
No two marketing teams are identical. Choose a dashboard that allows you to tailor visualizations, KPIs, and workflows to your unique needs—whether that’s custom branding, advanced filtering, or white-labeling for client presentations.
5. Automated Features:
Time-saving tools like scheduled report generation, automated alerts, and AI-driven insights are must-haves. These features help you stay proactive, spot trends early, and deliver value to clients or stakeholders with minimal manual effort.
6. Collaboration & Sharing:
Modern dashboards should support role-based access, granular permissions, and easy report sharing—internally or externally. This ensures the right people see the right data, fostering transparency and teamwork.
7. Support & Training:
Strong onboarding, documentation, and responsive customer support make a big difference in user adoption and troubleshooting. Ask about available resources, training programs, and ongoing support.
Key Questions to Ask Dashboard Vendors
- Which data integrations are included, and how often is data refreshed?
- How customizable are the dashboards and reports for my team’s needs?
- What automated features (alerts, insights, scheduled reports) are available?
- How does the platform handle user permissions and multi-client management?
- What onboarding, training, and support resources do you provide?
- Can I export data or connect it to other tools (like BI platforms or CRMs)?
By applying these criteria and asking the right questions, you’ll be well-equipped to invest in a dashboard solution that scales with your business and unlocks actionable marketing intelligence. To see how a unified, scalable platform can transform your marketing operations, explore TapClicks—built for agencies and brands who demand robust integration, automation, and insight at scale.
Conclusion
A digital marketing KPI dashboard is more than just a reporting tool—it’s a catalyst for smarter, faster, and more impactful decision-making. By consolidating cross-channel data, automating performance tracking, and leveraging AI-powered insights, these dashboards empower marketers and agencies to move beyond guesswork and manual effort. The result: clearer visibility into what’s driving ROI, where optimizations are needed, and how to scale success.
If you’re ready to transform your marketing operations, start by identifying the KPIs that align with your business goals and client objectives. With the right dashboard in place, you’ll not only save valuable time but also unlock new opportunities for growth and efficiency.
For more tips, real-world use cases, and expert strategies, explore the resources and case studies available at TapClicks. Your path to streamlined analytics and better marketing outcomes starts today.
Start Automating Your Marketing Data Today!
No Credit Card Required.

